Special notes of this burst
Image
Pre-slew 15.0-350.0 keV image (Event data)

#   RAcent    DECcent   POSerr    Theta     Phi              Peak Cts       SNR   Name
  263.9289    13.0423   0.0105     9.0780    98.0474         0.5755504     18.303 TRIG_00231231

Foreground time interval of the image:
 -0.092  10.140 (delta_t =  10.232 [sec])
Background time interval of the image:
-239.328  -0.092 (delta_t = 239.236 [sec])
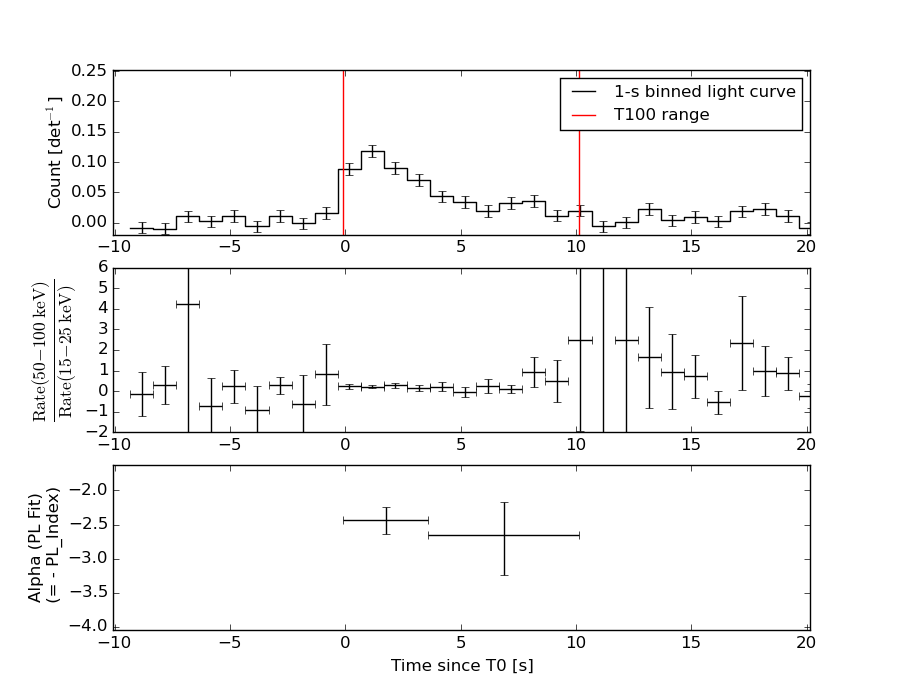
Lightcurves
Notes:
- 1) The mask-weighted light curves are using the flight position.
- 2) Multiple plots of different time binning/intervals are shown to cover all scenarios of short/long GRBs, rate/image triggers, and real/false positives.
- 3) For all the mask-weighted lightcurves, the y-axis units are counts/sec/det where a det is 0.4 x 0.4 = 0.16 sq cm.
- 4) The verticle lines correspond to following: green dotted lines are T50 interval, black dotted lines are T90 interval, blue solid line(s) is a spacecraft slew start time, and orange solid line(s) is a spacecraft slew end time.
- 5) Time of each bin is in the middle of the bin.
1 s binning
From T0-310 s to T0+310 s

From T100_start - 20 s to T100_end + 30 s

Full time interval
64 ms binning
Full time interval

From T100_start to T100_end

From T0-5 sec to T0+5 sec

16 ms binning
From T100_start-5 s to T100_start+5 s

8 ms binning
From T100_start-3 s to T100_start+3 s

2 ms binning
From T100_start-1 s to T100_start+1 s

SN=5 or 10 sec. binning (whichever binning is satisfied first)

SN=5 or 10 sec. binning (T < 200 sec)

Quad-rate summed light curves (from T0-300s to T0+1000s)

Spectral Evolution
Spectra
Notes:
- 1) The fitting includes the systematic errors.
- 2) When the burst includes telescope slew time periods, the fitting uses an average response file made from multiple 5-s response files through out the slew time plus single time preiod for the non-slew times, and weighted by the total counts in the corresponding time period using addrmf. An average response file is needed becuase a spectral fit using the pre-slew DRM will introduce some errors in both a spectral shape and a normalization if the PHA file contains a lot of the slew/post-slew time interval.
- 3) For fits to more complicated models (e.g. a power-law over a cutoff power-law), the BAT team has decided to require a chi-square improvement of more than 6 for each extra dof.
Time averaged spectrum fit using the average DRM
Power-law model
Time interval is from   -0.092 sec. to   10.140 sec.

Spectral model in power-law:
------------------------------------------------------------
Parameters  : value       lower 90%   higher 90%
Photon index: 2.49681     ( -0.213116   0.229232 )
Norm@50keV  : 2.27213E-03    ( -0.000362901   0.000359504 )
------------------------------------------------------------
#Fit statistic : Chi-Squared =          38.41 using 59 PHA bins.
# Reduced chi-squared =         0.6738 for     57 degrees of freedom
# Null hypothesis probability =   9.721502e-01

Photon flux (15-150 keV)    in 10.23 sec: 0.445480 ( -0.0426737  0.0426837 ) ph/cm2/s
Energy fluence (15-150 keV)             : 2.32231e-07 ( -2.68691e-08  2.76872e-08 ) ergs/cm2
Cutoff power-law model

Time interval is from   -0.092 sec. to   10.140 sec.
Spectral model in the cutoff power-law:
------------------------------------------------------------
Parameters  : value       lower 90%   higher 90%
Photon index: 1.95843     (     )
Epeak [keV] : 2.76236      (   )
Norm@50keV  : 4.95270E-03    (     )
------------------------------------------------------------
#Fit statistic : Chi-Squared =          38.59 using 59 PHA bins.
# Reduced chi-squared =         0.6891 for     56 degrees of freedom
# Null hypothesis probability =   9.633137e-01

Photon flux (15-150 keV)    in 10.23 sec: 0.441691 ( -0.045626  0.045201 ) ph/cm2/s
Energy fluence (15-150 keV)             : 2.2631e-07 ( -3.51431e-08  3.24741e-08 ) ergs/cm2
Band function
Time interval is from   -0.092 sec. to   10.140 sec.

Spectral model in the Band function:
------------------------------------------------------------
Parameters  : value       lower 90%   higher 90%
alpha       : -0.208656   ( 1.46962   1.46962 )
beta        : -2.69661    ( 2.61517   0.284667 )
Epeak [keV] : 20.2011      ( -14.937 32.617 )
Norm@50keV   : 0.111039    ( -0.108895   1082.04 )
------------------------------------------------------------
#Fit statistic : Chi-Squared =          37.13 using 59 PHA bins.
# Reduced chi-squared =         0.6751 for     55 degrees of freedom
# Null hypothesis probability =   9.691612e-01

Photon flux (15-150 keV)    in 10.23 sec:  (    ) ph/cm2/s
Energy fluence (15-150 keV)             : 0 ( 0  0 ) ergs/cm2
Single BB

Spectral model blackbody:
------------------------------------------------------------
Parameters  : value    Lower 90%  Upper 90%
kT [keV]    : 6.90685  (-0.744188  0.841613)
R^2/D10^2   : 0.854173  (-0.331267   0.54552)
(R is the radius in km and D10 is the distance to the source in units of 10 kpc)
------------------------------------------------------------
#Fit statistic : Chi-Squared =          56.20 using 59 PHA bins.
# Reduced chi-squared =         0.9859 for     57 degrees of freedom
# Null hypothesis probability =   5.051462e-01

Energy  Fluence     90% Error
[keV]   [erg/cm2]   [erg/cm2]
15- 25  6.603e-08   1.092e-08
25- 50  8.809e-08   1.266e-08
50-150  1.390e-08   5.038e-09
15-150  1.680e-07   2.378e-08
Thermal bremsstrahlung (OTTB)

Spectral model: thermal bremsstrahlung
------------------------------------------------------------
Parameters  : value         Lower 90%    Upper 90%
kT [keV]    : 31.2175       (-6.869      9.695)
Norm        : 3.39904       (-0.707751     0.947772)
------------------------------------------------------------
#Fit statistic : Chi-Squared =          40.31 using 59 PHA bins.
# Reduced chi-squared =         0.7073 for     57 degrees of freedom
# Null hypothesis probability =   9.539002e-01

Energy  Fluence     90% Error
[keV]   [erg/cm2]   [erg/cm2]
15- 25  7.218e-08   8.931e-09
25- 50  8.428e-08   1.074e-08
50-150  4.860e-08   1.673e-08
15-150  2.051e-07   2.593e-08
Double BB

Spectral model: bbodyrad<1> + bbodyrad<2>
------------------------------------------------------------
Parameters  : value         Lower 90%    Upper 90%
kT1 [keV]   : 5.09896        (-1.13426      1.09971)
R1^2/D10^2  : 2.57983        (-1.37761      4.47281)
kT2 [keV]   : 18.2254        (-6.64024      18.3151)
R2^2/D10^2  : 9.21019E-03    (-0.00835721   0.054951)
------------------------------------------------------------
#Fit statistic : Chi-Squared =          37.48 using 59 PHA bins.
# Reduced chi-squared =         0.6815 for     55 degrees of freedom
# Null hypothesis probability =   9.660002e-01

Energy  Fluence     90% Error
[keV]   [erg/cm2]   [erg/cm2]
15- 25  7.562e-08   3.159e-08
25- 50  7.667e-08   2.943e-08
50-150  7.258e-08   4.170e-08
15-150  2.249e-07   8.835e-08
Peak spectrum fit
Power-law model

Time interval is from    0.368 sec. to    1.368 sec.

Spectral model in power-law:
------------------------------------------------------------
Parameters  : value       lower 90%   higher 90%
Photon index: 2.37986     ( -0.246672   0.26804 )
Norm@50keV  : 6.02994E-03    ( -0.00115824   0.00114505 )
------------------------------------------------------------
#Fit statistic : Chi-Squared =          51.51 using 59 PHA bins.
# Reduced chi-squared =         0.9037 for     57 degrees of freedom
# Null hypothesis probability =   6.803699e-01

Photon flux (15-150 keV)    in 1 sec: 1.10268 ( -0.136006  0.136007 ) ph/cm2/s
Energy fluence (15-150 keV)             : 5.85568e-08 ( -8.78927e-09  9.10985e-09 ) ergs/cm2
Cutoff power-law model

Time interval is from    0.368 sec. to    1.368 sec.
Spectral model in the cutoff power-law:
------------------------------------------------------------
Parameters  : value       lower 90%   higher 90%
Photon index: 1.27241     ( -1.81675   0.725933 )
Epeak [keV] : 22.5822      (   )
Norm@50keV  : 3.14269E-02    (     )
------------------------------------------------------------
#Fit statistic : Chi-Squared =          49.33 using 59 PHA bins.
# Reduced chi-squared =         0.8809 for     56 degrees of freedom
# Null hypothesis probability =   7.235977e-01

Photon flux (15-150 keV)    in 1 sec: 1.06785 ( -0.13916  0.14054 ) ph/cm2/s
Energy fluence (15-150 keV)             : 5.19541e-08 ( -9.1589e-09  1.14539e-08 ) ergs/cm2
Band function

Time interval is from    0.368 sec. to    1.368 sec.

Spectral model in the Band function:
------------------------------------------------------------
Parameters  : value       lower 90%   higher 90%
alpha       : 4.57886   ( -12.1322   -4.57886 )
beta        : -2.79910    ( -0.546178   0.397853 )
Epeak [keV] : 23.2635      ( -3.48573 3.18374 )
Norm@50keV   : 1093.62    ( -133.399   11863.5 )
------------------------------------------------------------
#Fit statistic : Chi-Squared =          47.54 using 59 PHA bins.
# Reduced chi-squared =         0.8644 for     55 degrees of freedom
# Null hypothesis probability =   7.522598e-01

Photon flux (15-150 keV)    in 1 sec:  (    ) ph/cm2/s
Energy fluence (15-150 keV)             : 0 ( 0  0 ) ergs/cm2
Single BB

Spectral model blackbody:
------------------------------------------------------------
Parameters  : value    Lower 90%  Upper 90%
kT [keV]    : 7.30970  (-0.928795  1.07619)
R^2/D10^2   : 1.74830  (-0.763554   1.34432)
(R is the radius in km and D10 is the distance to the source in units of 10 kpc)
------------------------------------------------------------
#Fit statistic : Chi-Squared =          55.37 using 59 PHA bins.
# Reduced chi-squared =         0.9714 for     57 degrees of freedom
# Null hypothesis probability =   5.365344e-01

Energy  Fluence     90% Error
[keV]   [erg/cm2]   [erg/cm2]
15- 25  1.566e-08   3.560e-09
25- 50  2.329e-08   4.205e-09
50-150  4.503e-09   1.744e-09
15-150  4.346e-08   8.125e-09
Thermal bremsstrahlung (OTTB)

Spectral model: thermal bremsstrahlung
------------------------------------------------------------
Parameters  : value         Lower 90%    Upper 90%
kT [keV]    : 34.6146       (-9.00971      13.8831)
Norm        : 7.91549       (-1.84035     2.51308)
------------------------------------------------------------
#Fit statistic : Chi-Squared =          49.30 using 59 PHA bins.
# Reduced chi-squared =         0.8649 for     57 degrees of freedom
# Null hypothesis probability =   7.558790e-01

Energy  Fluence     90% Error
[keV]   [erg/cm2]   [erg/cm2]
15- 25  1.721e-08   2.815e-09
25- 50  2.119e-08   3.695e-09
50-150  1.389e-08   5.733e-09
15-150  5.229e-08   9.920e-09
Double BB

Spectral model: bbodyrad<1> + bbodyrad<2>
------------------------------------------------------------
Parameters  : value         Lower 90%    Upper 90%
kT1 [keV]   : 5.55543        (-2.06782      1.75198)
R1^2/D10^2  : 4.31751        (-2.65508      16.8569)
kT2 [keV]   : 16.6064        (-6.90561      -16.6875)
R2^2/D10^2  : 3.07422E-02    (-0.0299897   0.544376)
------------------------------------------------------------
#Fit statistic : Chi-Squared =          48.28 using 59 PHA bins.
# Reduced chi-squared =         0.8778 for     55 degrees of freedom
# Null hypothesis probability =   7.272691e-01

Energy  Fluence     90% Error
[keV]   [erg/cm2]   [erg/cm2]
15- 25  1.745e-08   9.585e-09
25- 50  2.074e-08   1.074e-08
50-150  1.561e-08   9.989e-09
15-150  5.380e-08   2.727e-08
Pre-slew spectrum (Pre-slew PHA with pre-slew DRM)
Power-law model

Spectral model in power-law:
------------------------------------------------------------
Parameters  : value       lower 90%   higher 90%
Photon index: 2.49681     ( -0.213116   0.229232 )
Norm@50keV  : 2.27213E-03    ( -0.000362901   0.000359504 )
------------------------------------------------------------
#Fit statistic : Chi-Squared =          38.41 using 59 PHA bins.
# Reduced chi-squared =         0.6738 for     57 degrees of freedom
# Null hypothesis probability =   9.721502e-01

Photon flux (15-150 keV)    in 10.23 sec: 0.445480 ( -0.0426737  0.0426837 ) ph/cm2/s
Energy fluence (15-150 keV)             : 2.32231e-07 ( -2.68691e-08  2.76872e-08 ) ergs/cm2
Cutoff power-law model
Spectral model in the cutoff power-law:
------------------------------------------------------------
Parameters  : value       lower 90%   higher 90%
Photon index: 1.95843     (     )
Epeak [keV] : 2.76236      (   )
Norm@50keV  : 4.95270E-03    (     )
------------------------------------------------------------
#Fit statistic : Chi-Squared =          38.59 using 59 PHA bins.
# Reduced chi-squared =         0.6891 for     56 degrees of freedom
# Null hypothesis probability =   9.633137e-01

Photon flux (15-150 keV)    in 10.23 sec: 0.441691 ( -0.045626  0.045201 ) ph/cm2/s
Energy fluence (15-150 keV)             : 2.2631e-07 ( -3.51431e-08  3.24741e-08 ) ergs/cm2
Band function

Spectral model in the Band function:
------------------------------------------------------------
Parameters  : value       lower 90%   higher 90%
alpha       : -0.208656   ( 1.46962   1.46962 )
beta        : -2.69661    ( 2.61517   0.284666 )
Epeak [keV] : 20.2011      ( -14.937 32.617 )
Norm@50keV   : 0.111039    ( -0.108895   1081.99 )
------------------------------------------------------------
#Fit statistic : Chi-Squared =          37.13 using 59 PHA bins.
# Reduced chi-squared =         0.6751 for     55 degrees of freedom
# Null hypothesis probability =   9.691612e-01

Photon flux (15-150 keV)    in 10.23 sec:  (    ) ph/cm2/s
Energy fluence (15-150 keV)             : 0 ( 0  0 ) ergs/cm2
S(25-50 keV) vs. S(50-100 keV) plot

S(25-50 keV)  = 7.70e-08
S(50-100 keV) = 5.46e-08
T90 vs. Hardness ratio plot

T90                                   = 8.824000030756 sec.
Hardness ratio (energy fluence ratio) = 0.709091
Color vs. Color plot

Count Ratio  (25-50 keV) / (15-25 keV) = 0.775258
Count Ratio (50-100 keV) / (15-25 keV) = 0.251842
Mask shadow pattern
IMX = -2.236794455097446E-02, IMY = -1.582073322667724E-01
TIME vs. PHA plot around the trigger time

TIME vs. DetID plot around the trigger time

100 us light curve (15-350 keV)

Spacecraft aspect plot
Bright source in the pre-burst/pre-slew/post-slew images
Pre-burst image of 15-350 keV band
Time interval of the image:
-239.328000 -0.092000

# RAcent  DECcent POSerr Theta    Phi  PeakCts   SNR AngSep     Name
#  [deg]    [deg]    ['] [deg]  [deg]                   [']
244.9743 -15.6390    0.2  29.6 -147.5  10.9997  49.6    0.3	Sco X-1
254.2773  35.3571    4.1  23.0   12.6   0.5384   2.8    8.9	Her X-1
255.9812 -37.8368    3.4  50.2 -168.0   1.6443   3.3    0.5	4U 1700-377
256.5301 -36.4529    5.0  48.8 -168.6   1.0097   2.3    4.9	GX 349+2
263.0999 -24.7496    2.2  38.0 -179.1   1.4811   5.4    5.0	GX 1+4
264.8316 -44.3870    9.6  57.5 -175.2   1.2592   1.2    5.4	4U 1735-44
268.3911  -1.3899    3.4  19.4  147.6   0.6455   3.4    4.0	SW J1753.5-0127
270.2642 -25.1202    3.2  40.5  171.3   1.0815   3.6    2.7	GX 5-1
270.3100 -25.8667    8.4  41.2  171.7   0.4325   1.4    7.4	GRS 1758-258
273.9546 -14.0514   10.1  32.6  156.9   0.3255   1.1    3.1	GX 17+2
276.0162 -30.2328    6.4  47.3  168.0   0.9194   1.8    9.3	H1820-303
284.9648 -25.1067   16.2  47.7  155.2   0.4484   0.7   11.8	HT1900.1-2455
288.8074  10.9169    1.1  33.5  102.2   4.4665  10.4    1.8	GRS 1915+105
262.9786 -33.8603    6.6  46.9 -176.1   0.6626   1.8    1.6	GX 354-0
274.6850  49.8332    2.4  40.9   33.1   2.0550   4.9 ------	UNKNOWN
242.3214   7.1518    3.0  13.2  -98.7   0.7833   3.8 ------	UNKNOWN
201.0634  46.4350    5.2  56.3  -28.4   2.7586   2.2 ------	UNKNOWN
216.8093  -4.1364    5.6  41.1  -98.0   2.4431   2.1 ------	UNKNOWN
Pre-slew background subtracted image of 15-350 keV band
Time interval of the image:
-0.092000 10.140000

# RAcent  DECcent POSerr Theta    Phi  PeakCts   SNR AngSep     Name
#  [deg]    [deg]    ['] [deg]  [deg]                   [']
245.1116 -15.7655    4.9  29.7 -147.8  -0.0860  -2.4   10.7	Sco X-1
254.5779  35.5170    0.0  23.2   13.2   0.0452   1.3   12.0	Her X-1
255.9703 -37.8212  695.0  50.2 -168.0  -0.0012  -0.0    1.6	4U 1700-377
256.6233 -36.5472    0.0  48.9 -168.7   0.1235   1.7   11.7	GX 349+2
262.9664 -24.8190  107.5  38.1 -178.9  -0.0049  -0.1    5.0	GX 1+4
264.7632 -44.4635    5.7  57.6 -175.2  -0.3597  -2.0    1.2	4U 1735-44
268.3577  -1.4905    6.4  19.4  147.9  -0.0599  -1.8    2.4	SW J1753.5-0127
270.3991 -25.0165   10.9  40.4  171.1   0.0517   1.1    7.3	GX 5-1
270.3964 -25.5988    3.2  40.9  171.4   0.1828   3.6   10.0	GRS 1758-258
274.1452 -14.0534   10.7  32.7  156.6   0.0470   1.1    8.2	GX 17+2
276.0038 -30.4998    3.0  47.5  168.2  -0.2924  -3.9    9.0	H1820-303
285.0721 -24.8114    4.1  47.6  154.9  -0.2929  -2.8    6.8	HT1900.1-2455
288.7125  10.8617    5.1  33.4  102.3  -0.1572  -2.3    7.1	GRS 1915+105
262.8403 -33.7815   16.9  46.8 -176.0  -0.0402  -0.7    8.1	GX 354-0
291.8355  -2.3888    2.2  39.8  122.6   0.5122   5.3 ------	UNKNOWN
263.9289  13.0423    0.6   9.1   98.0   0.5756  18.3 ------	UNKNOWN
Post-slew image of 15-350 keV band
Time interval of the image:
43.772620 875.972600

# RAcent  DECcent POSerr Theta    Phi  PeakCts   SNR AngSep     Name
#  [deg]    [deg]    ['] [deg]  [deg]                   [']
244.9831 -15.6442    0.2  34.3 -142.8  37.0285  47.7    0.3	Sco X-1
254.3161  35.3208    3.0  23.9  -16.2   2.0921   3.8    7.0	Her X-1
256.0052 -37.8557    4.5  51.5 -168.5   4.3000   2.6    1.1	4U 1700-377
256.4614 -36.5106   23.0  50.1 -168.7   0.6865   0.5    5.4	GX 349+2
263.0485 -24.7169    2.5  37.8 -175.2   3.7677   4.6    2.8	GX 1+4
264.8570 -44.4511    8.6  57.5 -177.3  -4.1665  -1.3    4.9	4U 1735-44
268.3236  -1.3586    2.6  15.1  166.4   2.3727   4.4    6.2	SW J1753.5-0127
270.2837 -25.0814    2.3  38.6  174.3   3.8547   5.0    0.1	GX 5-1
270.2966 -25.7398    6.0  39.3  174.4   1.4372   1.9    0.4	GRS 1758-258
273.9286 -14.0279    3.9  28.8  163.1   1.9651   3.0    4.5	GX 17+2
275.7966 -30.2335    0.0  44.8  168.9  -1.3544  -1.2   10.4	H1820-303
285.0102 -25.0211    4.9  43.3  155.1   3.2143   2.4    6.2	HT1900.1-2455
288.7877  10.9525    0.6  24.4   95.8  14.6205  18.1    0.8	GRS 1915+105
299.5832  35.2066    0.4  39.0   52.7  44.1743  32.2    0.5	Cyg X-1
262.9594 -33.8718    4.8  46.9 -175.4   2.3610   2.4    2.7	GX 354-0
277.3766 -23.7918    2.9  39.1  163.8   3.8169   4.0 ------	UNKNOWN
242.8039  53.9567    2.7  44.2  -14.2   4.2861   4.2 ------	UNKNOWN
243.2989  52.1869    3.3  42.5  -15.2   3.3788   3.5 ------	UNKNOWN
226.8433 -12.5235    3.1  44.8 -119.8  12.2431   3.8 ------	UNKNOWN
223.8687   2.3733    5.1  41.1  -98.1   8.9051   2.3 ------	UNKNOWN
Plot creation:
Sun May 31 11:55:39 EDT 2015