Click here for the BAT GCN circular template
Image
Pre-slew 15.0-350.0 keV image (Event data)
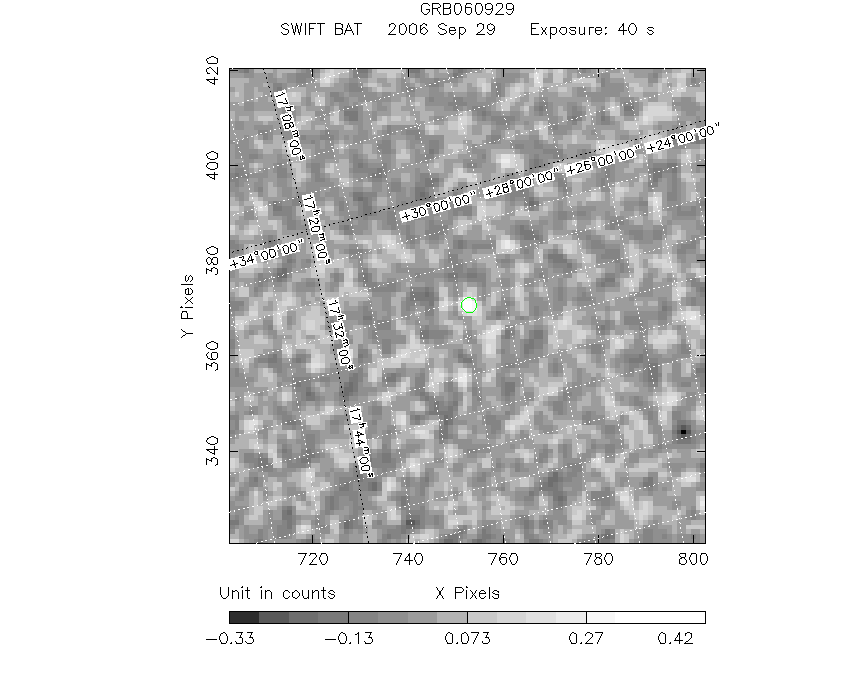
#   RAcent    DECcent   POSerr    Theta     Phi              Peak Cts       SNR   Name
  263.1484    29.8221   0.0273    19.1453    39.8779         0.5109228      7.017 TRIG_00231702

Foreground time interval of the image:
 -4.712  35.773 (delta_t =  40.485 [sec])
Background time interval of the image:
-230.227  -4.712 (delta_t = 225.515 [sec])
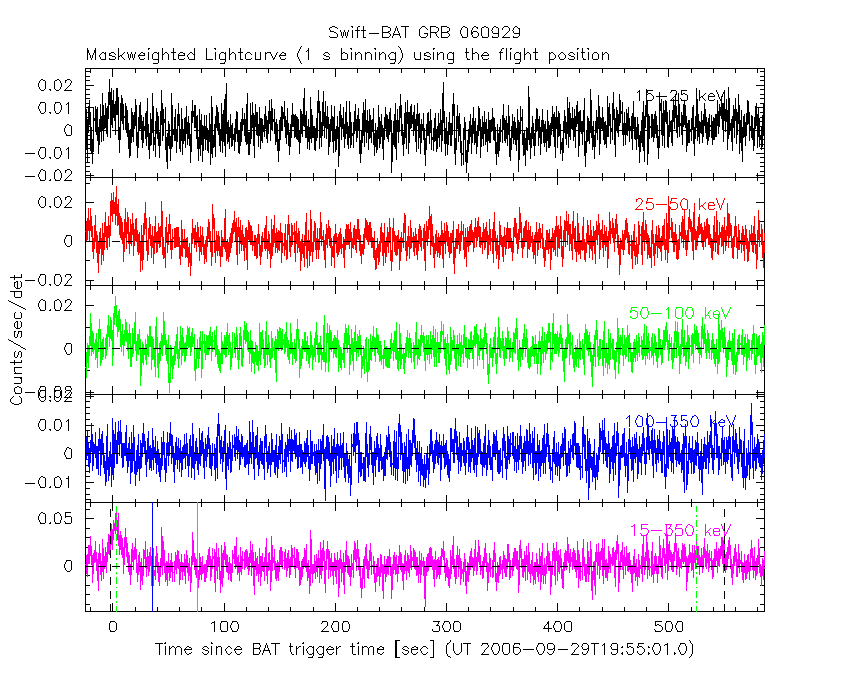
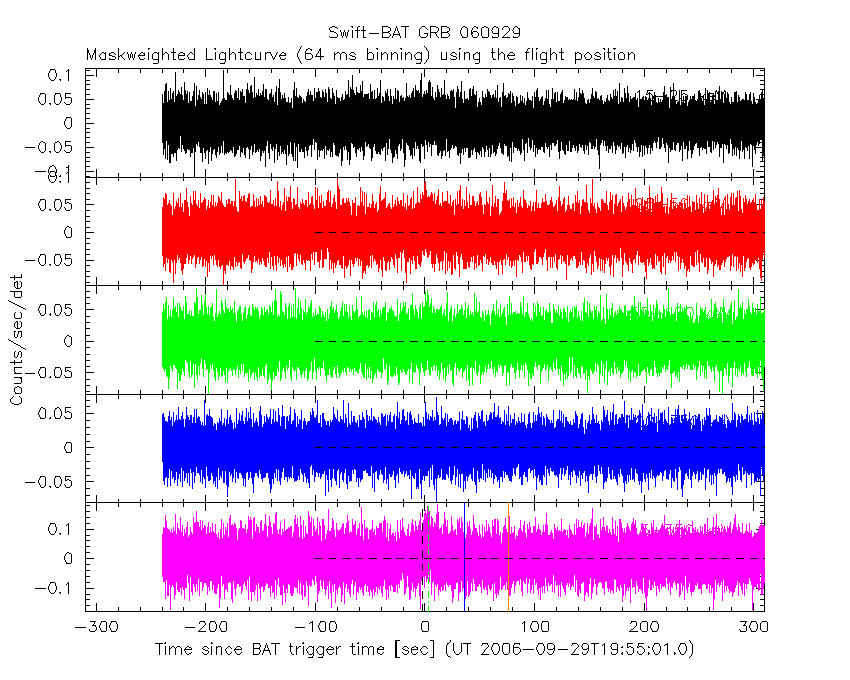
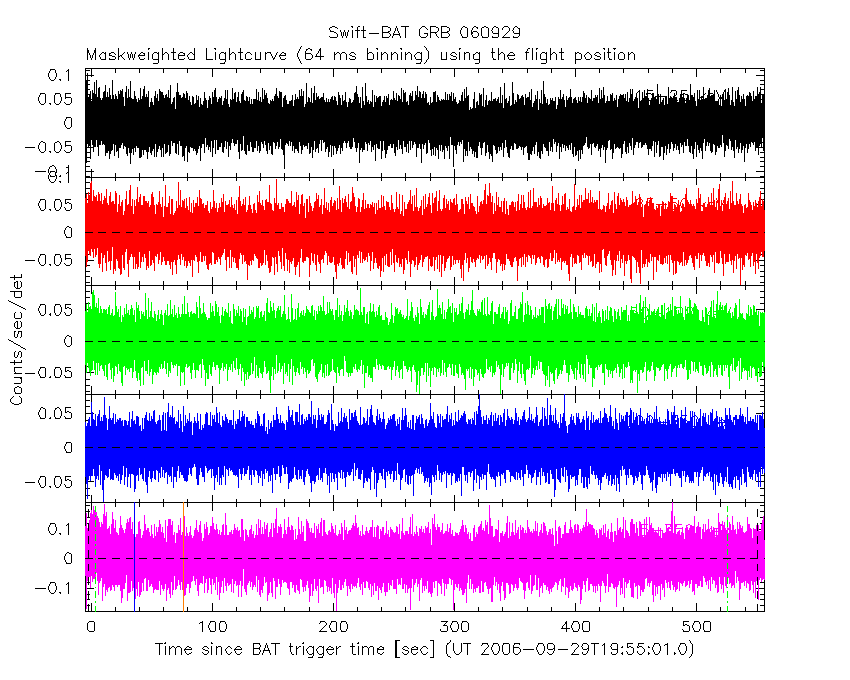
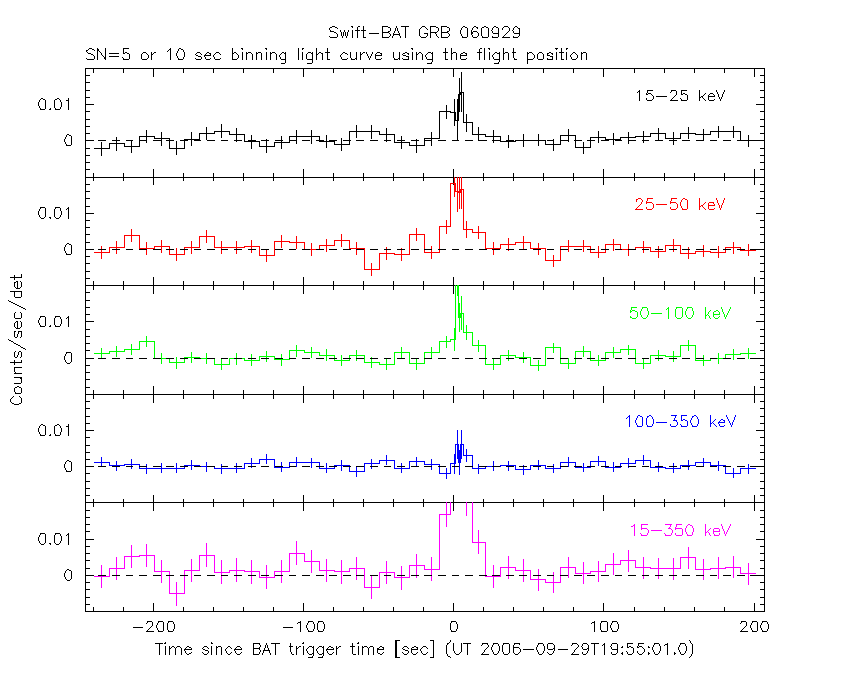
Lightcurves
Notes:
- 1) The mask-weighted light curves are using the flight position.
- 2) Multiple plots of different time binning/intervals are shown to cover all scenarios of short/long GRBs, rate/image triggers, and real/false positives.
- 3) For all the mask-weighted lightcurves, the y-axis units are counts/sec/det where a det is 0.4 x 0.4 = 0.16 sq cm.
- 4) The verticle lines correspond to following: green dotted lines are T50 interval, black dotted lines are T90 interval, blue solid line(s) is a spacecraft slew start time, and orange solid line(s) is a spacecraft slew end time.
- 5) Time of each bin is in the middle of the bin.
1 s binning
From T0-310 s to T0+310 s

From T100_start - 20 s to T100_end + 30 s
Full time interval

64 ms binning
Full time interval
From T100_start to T100_end
From T0-5 sec to T0+5 sec

16 ms binning
From T100_start-5 s to T100_start+5 s

Blue+Cyan dotted lines: Time interval of the scaled map
From 0.000000 to 4.096000
8 ms binning
From T100_start-3 s to T100_start+3 s

Blue+Cyan dotted lines: Time interval of the scaled map
From 0.000000 to 4.096000
2 ms binning
From T100_start-1 s to T100_start+1 s
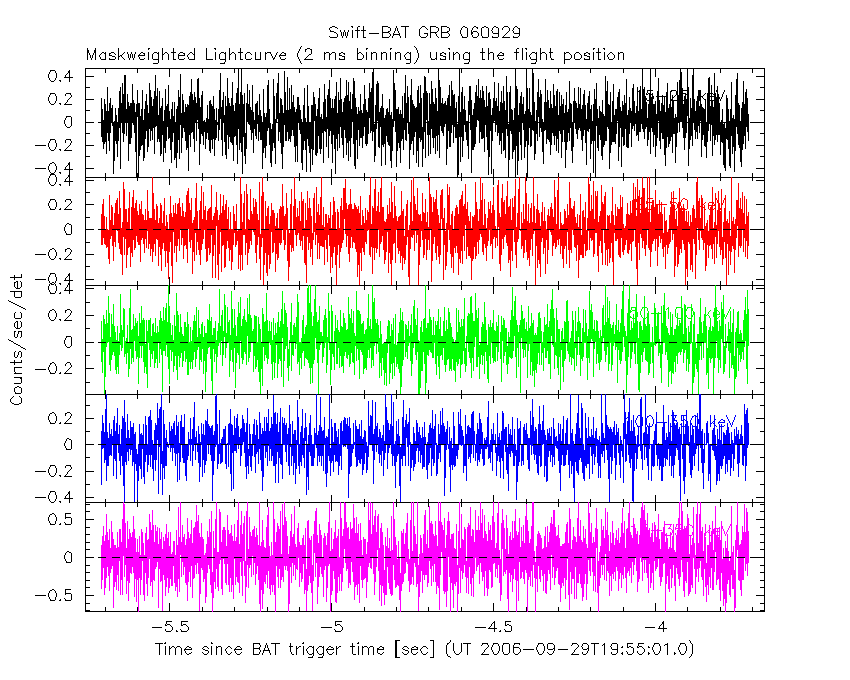
Blue+Cyan dotted lines: Time interval of the scaled map
From 0.000000 to 4.096000
SN=5 or 10 sec. binning (whichever binning is satisfied first)

SN=5 or 10 sec. binning (T < 200 sec)
Quad-rate summed light curves (from T0-300s to T0+1000s)

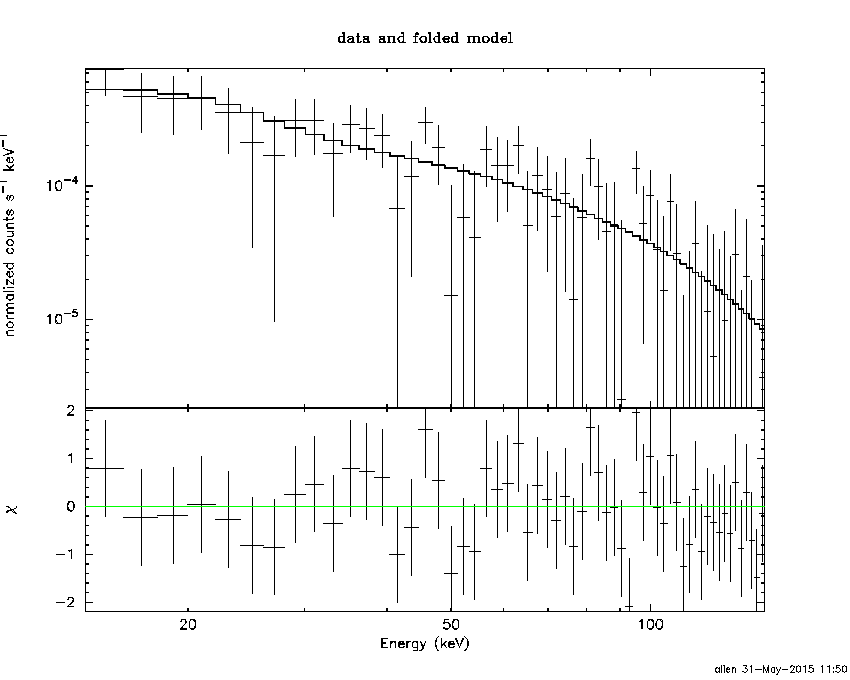
Spectral Evolution

Spectra
Notes:
- 1) The fitting includes the systematic errors.
- 2) When the burst includes telescope slew time periods, the fitting uses an average response file made from multiple 5-s response files through out the slew time plus single time preiod for the non-slew times, and weighted by the total counts in the corresponding time period using addrmf. An average response file is needed becuase a spectral fit using the pre-slew DRM will introduce some errors in both a spectral shape and a normalization if the PHA file contains a lot of the slew/post-slew time interval.
- 3) For fits to more complicated models (e.g. a power-law over a cutoff power-law), the BAT team has decided to require a chi-square improvement of more than 6 for each extra dof.
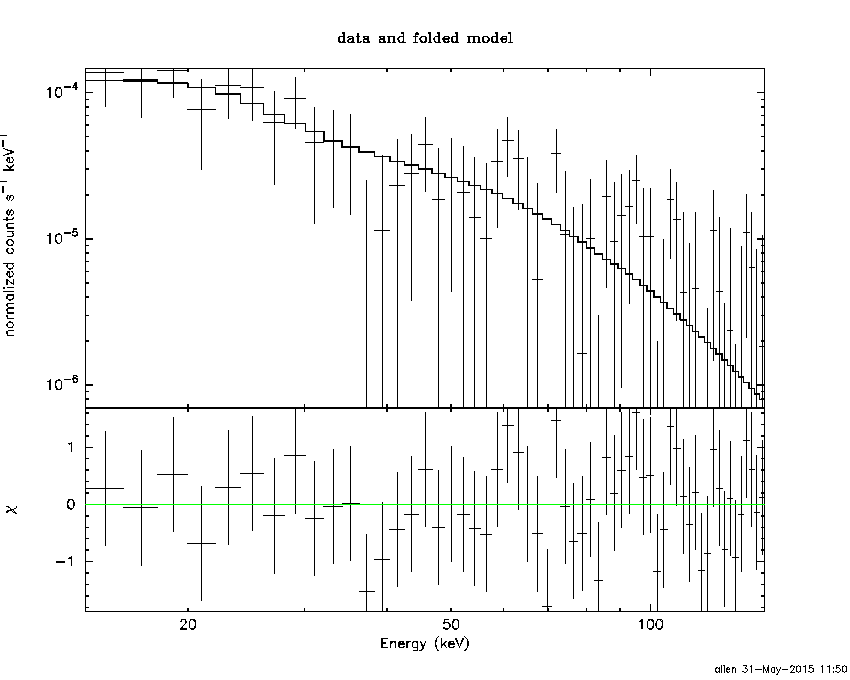
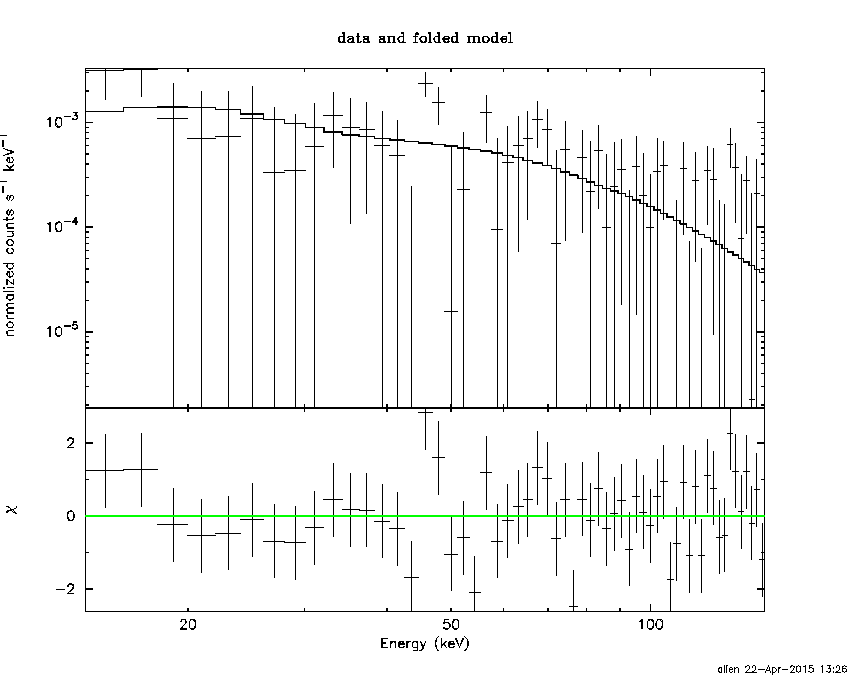
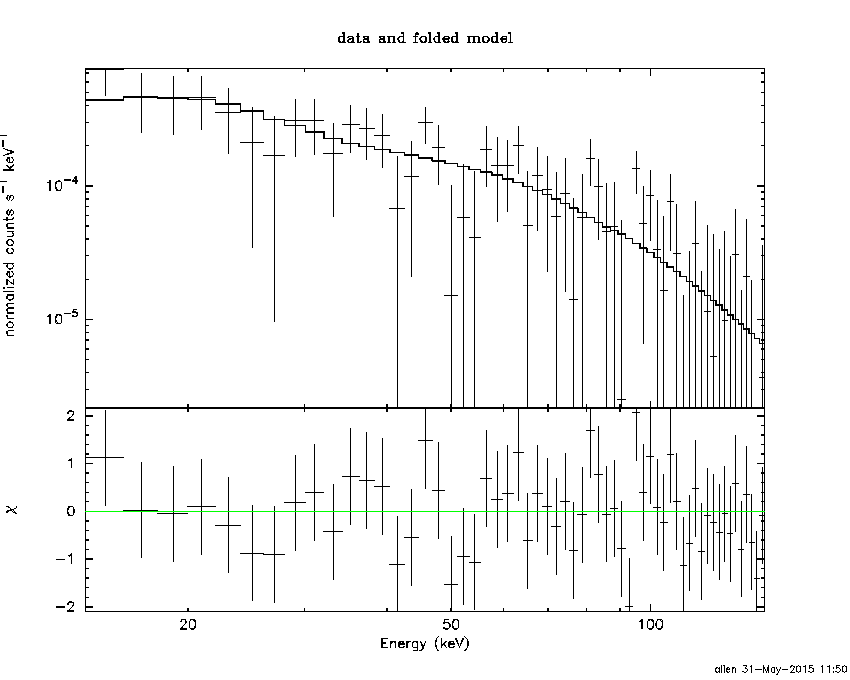
Time averaged spectrum fit using the average DRM
Power-law model

Time interval is from   -4.712 sec. to  556.120 sec.

Spectral model in power-law:
------------------------------------------------------------
Parameters  : value       lower 90%   higher 90%
Photon index: 1.91477     ( -0.4036   0.45473 )
Norm@50keV  : 1.68008E-04    ( -4.75108e-05   4.42474e-05 )
------------------------------------------------------------
#Fit statistic : Chi-Squared =          33.36 using 59 PHA bins.
# Reduced chi-squared =         0.5852 for     57 degrees of freedom
# Null hypothesis probability =   9.947809e-01

Photon flux (15-150 keV)    in 560.8 sec: 2.42635E-02 ( -0.00486043  0.00486055 ) ph/cm2/s
Energy fluence (15-150 keV)             : 8.66363e-07 ( -2.25137e-07  2.37248e-07 ) ergs/cm2
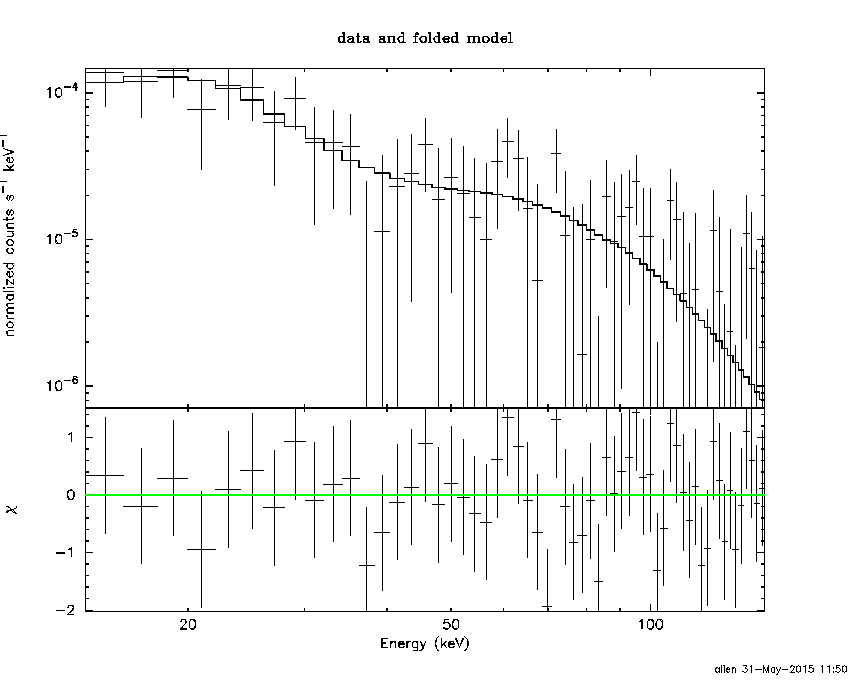
Cutoff power-law model

Time interval is from   -4.712 sec. to  556.120 sec.
Spectral model in the cutoff power-law:
------------------------------------------------------------
Parameters  : value       lower 90%   higher 90%
Photon index: 2.49440     (     )
Epeak [keV] : 172.648      (   )
Norm@50keV  : 8.58916E-05    (     )
------------------------------------------------------------
#Fit statistic : Chi-Squared =          32.77 using 59 PHA bins.
# Reduced chi-squared =         0.5853 for     56 degrees of freedom
# Null hypothesis probability =   9.944101e-01

Photon flux (15-150 keV)    in 560.8 sec: 2.42518E-02 ( -0.0048575  0.0048577 ) ph/cm2/s
Energy fluence (15-150 keV)             : 8.6403e-07 ( -1.1216e-07  2.32121e-07 ) ergs/cm2
Band function
Time interval is from   -4.712 sec. to  556.120 sec.

Spectral model in the Band function:
------------------------------------------------------------
Parameters  : value       lower 90%   higher 90%
alpha       : -1.51227   ( 1.51227   1.51227 )
beta        : -1.91473    ( 1.91474   0.403309 )
Epeak [keV] : 13.2071      ( -13.2037 -13.2037 )
Norm@50keV   : 4.63880E-04    ( -0.000463898   278.074 )
------------------------------------------------------------
#Fit statistic : Chi-Squared =          33.36 using 59 PHA bins.
# Reduced chi-squared =         0.6065 for     55 degrees of freedom
# Null hypothesis probability =   9.907303e-01

Photon flux (15-150 keV)    in 560.8 sec:  (    ) ph/cm2/s
Energy fluence (15-150 keV)             : 0 ( 0  0 ) ergs/cm2
Single BB

Spectral model blackbody:
------------------------------------------------------------
Parameters  : value    Lower 90%  Upper 90%
kT [keV]    : 8.52654  (-2.4814  4.14074)
R^2/D10^2   : 1.93819E-02  (-0.0146758   0.0547049)
(R is the radius in km and D10 is the distance to the source in units of 10 kpc)
------------------------------------------------------------
#Fit statistic : Chi-Squared =          45.15 using 59 PHA bins.
# Reduced chi-squared =         0.7921 for     57 degrees of freedom
# Null hypothesis probability =   8.716562e-01

Energy  Fluence     90% Error
[keV]   [erg/cm2]   [erg/cm2]
15- 25  1.492e-07   6.729e-08
25- 50  2.908e-07   1.150e-07
50-150  9.379e-08   5.640e-08
15-150  5.338e-07   2.342e-07
Thermal bremsstrahlung (OTTB)

Spectral model: thermal bremsstrahlung
------------------------------------------------------------
Parameters  : value         Lower 90%    Upper 90%
kT [keV]    : 85.2116       (-46.7084      -85.2746)
Norm        : 0.110415       (-0.028334     0.0502495)
------------------------------------------------------------
#Fit statistic : Chi-Squared =          35.06 using 59 PHA bins.
# Reduced chi-squared =         0.6150 for     57 degrees of freedom
# Null hypothesis probability =   9.902584e-01

Energy  Fluence     90% Error
[keV]   [erg/cm2]   [erg/cm2]
15- 25  1.612e-07   4.649e-08
25- 50  2.694e-07   1.092e-07
50-150  3.964e-07   2.823e-07
15-150  8.270e-07   4.488e-07
Double BB
Spectral model: bbodyrad<1> + bbodyrad<2>
------------------------------------------------------------
Parameters  : value         Lower 90%    Upper 90%
kT1 [keV]   : 5.01578        (-1.69964      2.21909)
R1^2/D10^2  : 0.129681        (-0.0993234      0.707696)
kT2 [keV]   : 27.4743        (-11.9156      59.9943)
R2^2/D10^2  : 2.32303E-04    (-0.000219701   0.00065082)
------------------------------------------------------------
#Fit statistic : Chi-Squared =          32.10 using 59 PHA bins.
# Reduced chi-squared =         0.5835 for     55 degrees of freedom
# Null hypothesis probability =   9.942326e-01

Energy  Fluence     90% Error
[keV]   [erg/cm2]   [erg/cm2]
15- 25  1.953e-07   1.119e-07
25- 50  2.142e-07   1.134e-07
50-150  5.333e-07   3.261e-07
15-150  9.428e-07   5.246e-07
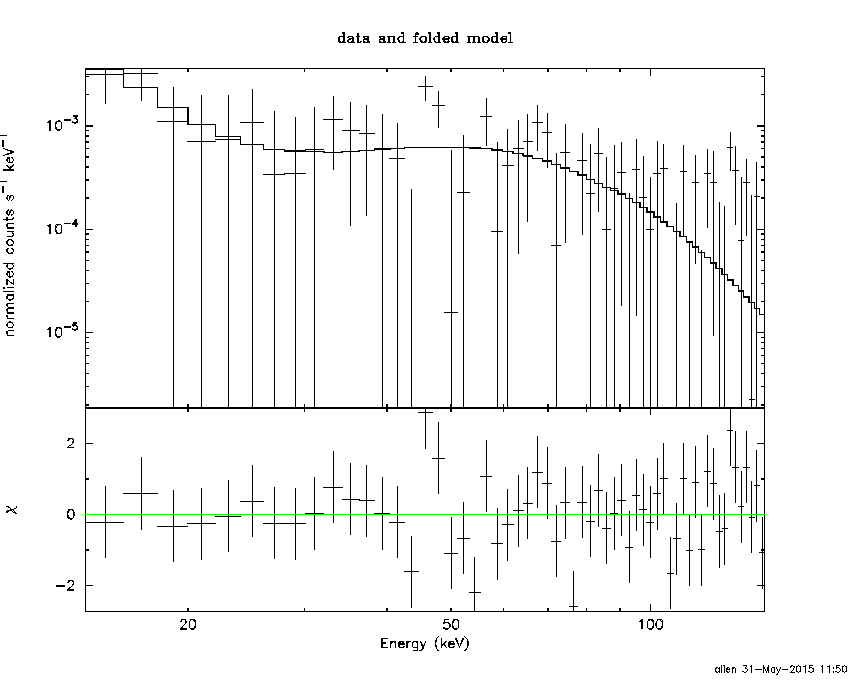
Peak spectrum fit
Power-law model
Time interval is from    2.692 sec. to    3.692 sec.

Spectral model in power-law:
------------------------------------------------------------
Parameters  : value       lower 90%   higher 90%
Photon index: 1.27108     ( -0.598421   0.588063 )
Norm@50keV  : 3.72130E-03    ( -0.00104537   0.00104435 )
------------------------------------------------------------
#Fit statistic : Chi-Squared =          59.69 using 59 PHA bins.
# Reduced chi-squared =          1.047 for     57 degrees of freedom
# Null hypothesis probability =   3.782845e-01

Photon flux (15-150 keV)    in 1 sec: 0.441680 ( -0.129119  0.129884 ) ph/cm2/s
Energy fluence (15-150 keV)             : 3.70378e-08 ( -1.17265e-08  1.19592e-08 ) ergs/cm2
Cutoff power-law model
Time interval is from    2.692 sec. to    3.692 sec.
Spectral model in the cutoff power-law:
------------------------------------------------------------
Parameters  : value       lower 90%   higher 90%
Photon index: 1.29548     ( -0.625887   0.570685 )
Epeak [keV] : 9999.36      ( -9999.36 -9999.36 )
Norm@50keV  : 3.70719E-03    ( -0.00105137   0.0148156 )
------------------------------------------------------------
#Fit statistic : Chi-Squared =          59.70 using 59 PHA bins.
# Reduced chi-squared =          1.066 for     56 degrees of freedom
# Null hypothesis probability =   3.427555e-01

Photon flux (15-150 keV)    in 1 sec: 0.444436 ( -0.131423  0.125479 ) ph/cm2/s
Energy fluence (15-150 keV)             : 3.70359e-08 ( -1.17257e-08  1.16505e-08 ) ergs/cm2
Band function

Time interval is from    2.692 sec. to    3.692 sec.

Spectral model in the Band function:
------------------------------------------------------------
Parameters  : value       lower 90%   higher 90%
alpha       : -1.02625   ( 1.02812   1.02812 )
beta        : -1.27022    ( 1.27098   0.598375 )
Epeak [keV] : 46.7879      ( -45.45 -45.45 )
Norm@50keV   : 6.76620E-03    ( -0.00409737   0.641007 )
------------------------------------------------------------
#Fit statistic : Chi-Squared =          59.69 using 59 PHA bins.
# Reduced chi-squared =          1.085 for     55 degrees of freedom
# Null hypothesis probability =   3.092775e-01

Photon flux (15-150 keV)    in 1 sec:  (    ) ph/cm2/s
Energy fluence (15-150 keV)             : 0 ( 0  0 ) ergs/cm2
Single BB

Spectral model blackbody:
------------------------------------------------------------
Parameters  : value    Lower 90%  Upper 90%
kT [keV]    : 19.9829  (-6.98968  13.6442)
R^2/D10^2   : 1.92428E-02  (-0.0191259   0.0604073)
(R is the radius in km and D10 is the distance to the source in units of 10 kpc)
------------------------------------------------------------
#Fit statistic : Chi-Squared =          64.05 using 59 PHA bins.
# Reduced chi-squared =          1.124 for     57 degrees of freedom
# Null hypothesis probability =   2.430120e-01

Energy  Fluence     90% Error
[keV]   [erg/cm2]   [erg/cm2]
15- 25  1.482e-09   9.520e-10
25- 50  7.377e-09   4.513e-09
50-150  2.183e-08   1.410e-08
15-150  3.069e-08   1.901e-08
Thermal bremsstrahlung (OTTB)

Spectral model: thermal bremsstrahlung
------------------------------------------------------------
Parameters  : value         Lower 90%    Upper 90%
kT [keV]    : 199.363       (-113.777      -199.363)
Norm        : 1.82311       (-0.521374     0.521391)
------------------------------------------------------------
#Fit statistic : Chi-Squared =          60.94 using 59 PHA bins.
# Reduced chi-squared =          1.069 for     57 degrees of freedom
# Null hypothesis probability =   3.362579e-01

Energy  Fluence     90% Error
[keV]   [erg/cm2]   [erg/cm2]
15- 25  4.540e-09   2.822e-09
25- 50  8.733e-09   5.410e-09
50-150  1.915e-08   1.163e-08
15-150  3.243e-08   1.937e-08
Double BB
Spectral model: bbodyrad<1> + bbodyrad<2>
------------------------------------------------------------
Parameters  : value         Lower 90%    Upper 90%
kT1 [keV]   : 1.93364        (-1.29371      1.87132)
R1^2/D10^2  : 485.845        (-484.007      0)
kT2 [keV]   : 23.7121        (-8.42511      20.8489)
R2^2/D10^2  : 1.06457E-02    (-0.0089387   0.0292744)
------------------------------------------------------------
#Fit statistic : Chi-Squared =          57.25 using 59 PHA bins.
# Reduced chi-squared =          1.041 for     55 degrees of freedom
# Null hypothesis probability =   3.914904e-01

Energy  Fluence     90% Error
[keV]   [erg/cm2]   [erg/cm2]
15- 25  4.372e-09   2.322e-09
25- 50  5.972e-09   3.493e-09
50-150  2.472e-08   1.588e-08
15-150  3.507e-08   2.032e-08
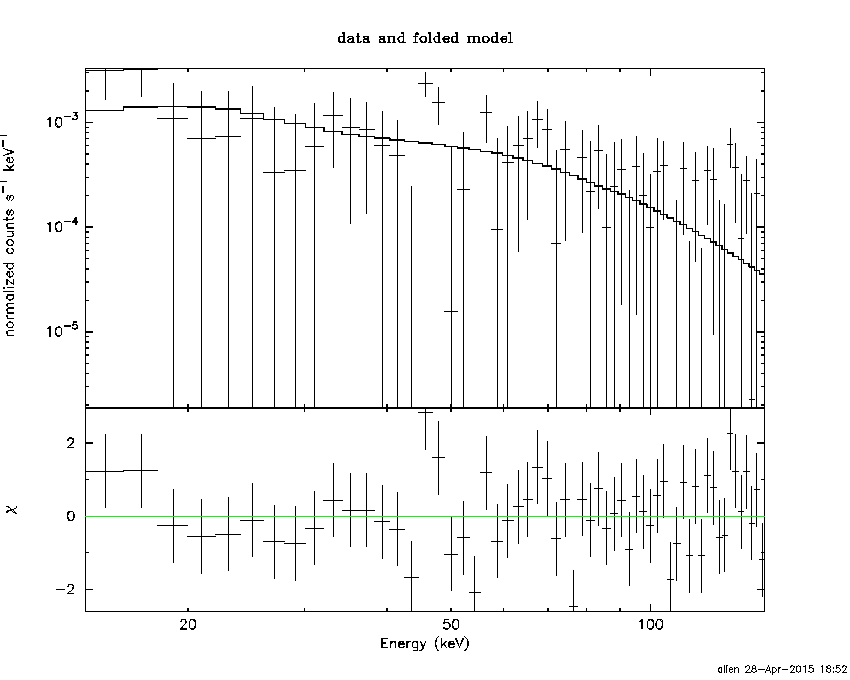
Pre-slew spectrum (Pre-slew PHA with pre-slew DRM)
Power-law model

Spectral model in power-law:
------------------------------------------------------------
Parameters  : value       lower 90%   higher 90%
Photon index: 1.55803     ( -0.312501   0.323869 )
Norm@50keV  : 9.39012E-04    ( -0.000167599   0.000164082 )
------------------------------------------------------------
#Fit statistic : Chi-Squared =          38.37 using 59 PHA bins.
# Reduced chi-squared =         0.6732 for     57 degrees of freedom
# Null hypothesis probability =   9.724160e-01

Photon flux (15-150 keV)    in 40.48 sec: 0.119152 ( -0.0201042  0.0201604 ) ph/cm2/s
Energy fluence (15-150 keV)             : 3.57432e-07 ( -6.89111e-08  7.04838e-08 ) ergs/cm2
Cutoff power-law model
Spectral model in the cutoff power-law:
------------------------------------------------------------
Parameters  : value       lower 90%   higher 90%
Photon index: 2.21337     (     )
Epeak [keV] : 79.0669      (   )
Norm@50keV  : 4.35231E-04    (     )
------------------------------------------------------------
#Fit statistic : Chi-Squared =          38.29 using 59 PHA bins.
# Reduced chi-squared =         0.6837 for     56 degrees of freedom
# Null hypothesis probability =   9.661847e-01

Photon flux (15-150 keV)    in 40.48 sec: 0.119132 ( -0.0208993  0.020098 ) ph/cm2/s
Energy fluence (15-150 keV)             : 3.57376e-07 ( -3.93644e-08  7.01652e-08 ) ergs/cm2
Band function
Spectral model in the Band function:
------------------------------------------------------------
Parameters  : value       lower 90%   higher 90%
alpha       : -2.42325   ( 1.64499   2.42325 )
beta        : -1.55808    ( -0.323727   0.313144 )
Epeak [keV] : 114.961      ( -114.961 -114.961 )
Norm@50keV   : 0.127624    ( -0.0227777   0.0223026 )
------------------------------------------------------------
#Fit statistic : Chi-Squared =          38.37 using 59 PHA bins.
# Reduced chi-squared =         0.6977 for     55 degrees of freedom
# Null hypothesis probability =   9.568884e-01

Photon flux (15-150 keV)    in 40.48 sec:  (    ) ph/cm2/s
Energy fluence (15-150 keV)             : 0 ( 0  0 ) ergs/cm2
S(25-50 keV) vs. S(50-100 keV) plot

S(25-50 keV)  = 2.54e-07
S(50-100 keV) = 2.69e-07
T90 vs. Hardness ratio plot
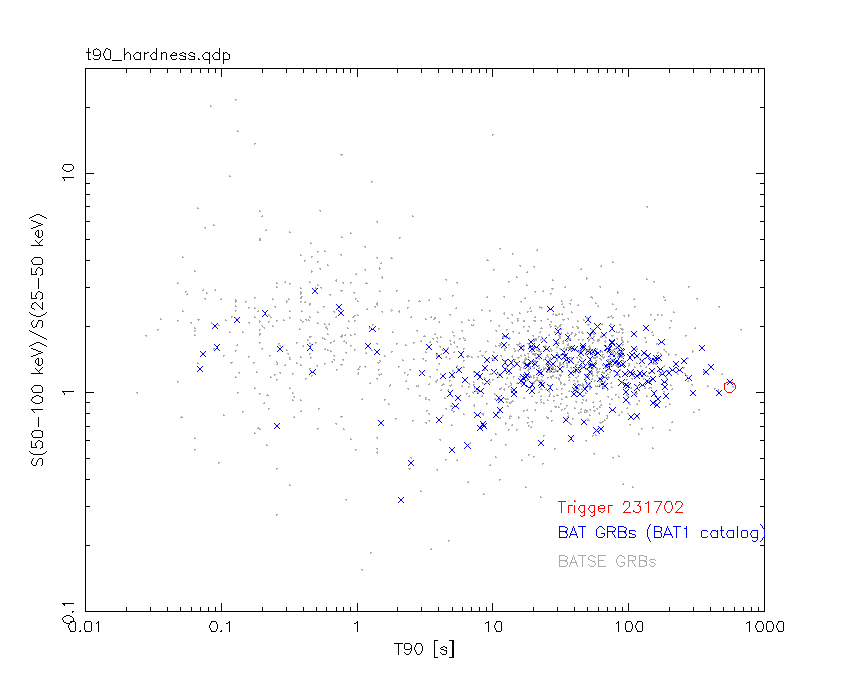
T90                                   = 552.960000008345 sec.
Hardness ratio (energy fluence ratio) = 1.05906
Color vs. Color plot
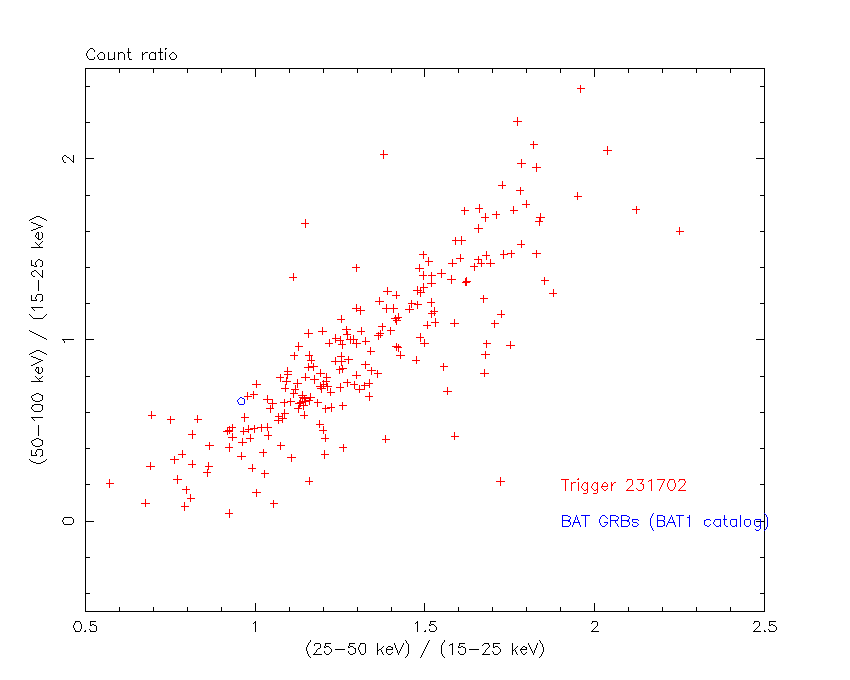
Count Ratio  (25-50 keV) / (15-25 keV) = 0.959047
Count Ratio (50-100 keV) / (15-25 keV) = 0.66233
Mask shadow pattern

IMX = 2.664206550830084E-01, IMY = -2.225879905399725E-01
TIME vs. PHA plot around the trigger time

Blue+Cyan dotted lines: Time interval of the scaled map
From 0.000000 to 4.096000
TIME vs. DetID plot around the trigger time

Blue+Cyan dotted lines: Time interval of the scaled map
From 0.000000 to 4.096000
100 us light curve (15-350 keV)
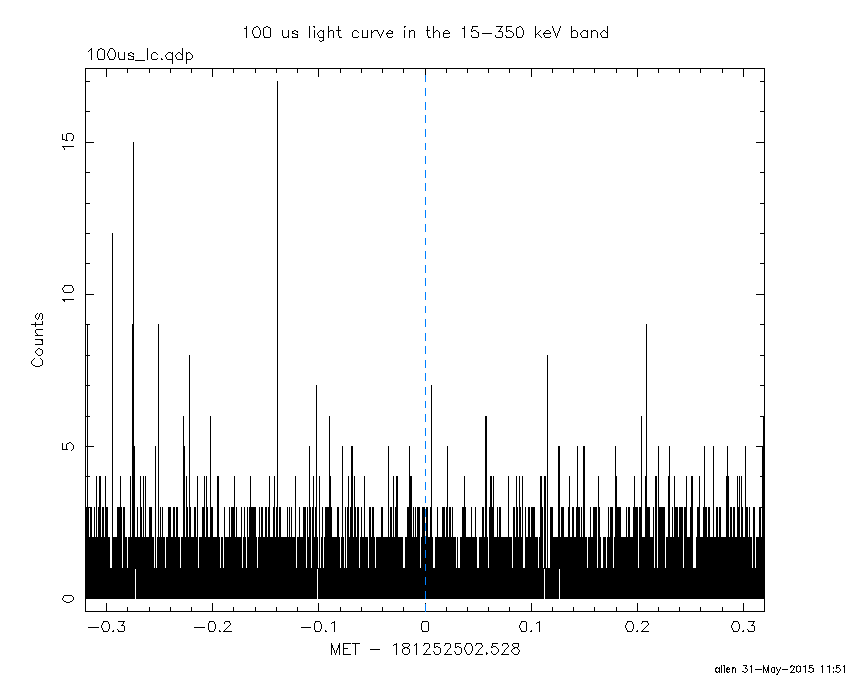
Blue+Cyan dotted lines: Time interval of the scaled map
From 0.000000 to 4.096000
Spacecraft aspect plot

Bright source in the pre-burst/pre-slew/post-slew images
Pre-burst image of 15-350 keV band
Time interval of the image:
-230.227410 -4.712000

# RAcent  DECcent POSerr Theta    Phi  PeakCts   SNR AngSep     Name
#  [deg]    [deg]    ['] [deg]  [deg]                   [']
244.9864 -15.6404    0.3  29.6 -144.2   8.0353  37.7    0.4	Sco X-1
254.2981  35.3622   10.9  23.0   16.1   0.1950   1.1    7.9	Her X-1
255.9814 -37.8355  996.2  50.2 -164.7  -0.0054  -0.0    0.6	4U 1700-377
256.2407 -36.3257    9.7  48.7 -165.0  -0.4588  -1.2   11.1	GX 349+2
262.9544 -24.7968    2.8  38.1 -175.6   1.0678   4.1    4.3	GX 1+4
264.7383 -44.3249    4.0  57.5 -171.8   2.7040   3.0    7.5	4U 1735-44
268.4029  -1.4588    7.4  19.5  151.1   0.2784   1.6    2.1	SW J1753.5-0127
270.3331 -25.0563    2.2  40.5  174.5   1.5342   5.3    3.0	GX 5-1
270.4112 -25.7029    3.5  41.1  174.8   0.9792   3.3    6.3	GRS 1758-258
274.1219 -13.9522   11.4  32.7  159.9   0.2619   1.0    8.4	GX 17+2
275.8310 -30.4553    6.5  47.5  171.7   0.7333   1.8    7.2	H1820-303
284.9121 -24.9152    7.7  47.6  158.5   0.8643   1.5    6.7	HT1900.1-2455
288.7957  10.9396    1.0  33.5  105.6   4.4920  11.7    0.4	GRS 1915+105
262.9189 -33.8430    3.0  46.9 -172.7   1.2888   3.9    3.5	GX 354-0
252.1968  63.4480    2.7  51.1   15.4   2.5901   4.3 ------	UNKNOWN
247.0822  41.9428    2.9  30.3    5.6   0.8038   3.9 ------	UNKNOWN
Pre-slew background subtracted image of 15-350 keV band
Time interval of the image:
-4.712000 35.772600

# RAcent  DECcent POSerr Theta    Phi  PeakCts   SNR AngSep     Name
#  [deg]    [deg]    ['] [deg]  [deg]                   [']
244.9187 -15.6608    4.3  29.6 -144.1   0.1925   2.7    3.7	Sco X-1
254.4317  35.4269   10.6  23.0   16.4  -0.0717  -1.1    5.2	Her X-1
256.1068 -37.8167   11.1  50.2 -164.8  -0.1595  -1.0    5.9	4U 1700-377
256.4994 -36.5178    4.5  48.9 -165.3   0.3543   2.6    6.5	GX 349+2
262.9452 -24.8649    8.5  38.1 -175.5  -0.1167  -1.4    8.0	GX 1+4
264.8343 -44.5862   12.6  57.7 -171.8  -0.3639  -1.0    9.1	4U 1735-44
268.4127  -1.3883    6.5  19.4  151.0   0.1232   1.8    4.7	SW J1753.5-0127
270.3712 -25.0842    3.4  40.5  174.5  -0.3494  -3.4    4.7	GX 5-1
270.4168 -25.6920    6.0  41.1  174.8  -0.2024  -1.9    6.9	GRS 1758-258
273.8727 -14.0523   28.8  32.6  160.3  -0.0365  -0.4    7.8	GX 17+2
275.9224 -30.3355   14.5  47.4  171.5  -0.1152  -0.8    1.9	H1820-303
284.9237 -24.9665   16.0  47.6  158.5  -0.1386  -0.7    6.7	HT1900.1-2455
288.6339  11.0399    0.0  33.3  105.5   0.0661   0.5   11.2	GRS 1915+105
262.8931 -33.7750    3.3  46.8 -172.7  -0.4360  -3.5    6.0	GX 354-0
275.1899  16.6868    2.5  20.4   92.1   0.3572   4.7 ------	UNKNOWN
263.1483  29.8221    1.6  19.1   39.9   0.5110   7.0 ------	UNKNOWN
245.6796 -42.3231    2.5  55.3 -155.2   1.1121   4.5 ------	UNKNOWN
Post-slew image of 15-350 keV band
Time interval of the image:
76.372600 962.512000

# RAcent  DECcent POSerr Theta    Phi  PeakCts   SNR AngSep     Name
#  [deg]    [deg]    ['] [deg]  [deg]                   [']
244.9778 -15.6339    0.7  48.7 -147.7  22.7351  15.7    0.4	Sco X-1
254.4841  35.1942    8.1   9.1  -42.7   0.8270   1.4    9.0	Her X-1
263.1113 -24.7485    9.4  54.6 -171.2  -2.6282  -1.2    5.6	GX 1+4
268.4033  -1.4664    2.4  31.7  178.8   2.8362   4.8    2.3	SW J1753.5-0127
270.1888 -25.0795   50.8  55.3 -179.0  -0.4754  -0.2    5.2	GX 5-1
270.2448 -25.7429  117.3  56.0 -178.9  -0.2191  -0.1    3.1	GRS 1758-258
273.9924 -13.9624    6.0  45.0  173.8   2.3372   1.9    4.5	GX 17+2
288.7876  10.9387    0.5  30.4  131.8  18.2218  21.6    0.8	GRS 1915+105
299.5990  35.2053    0.3  31.0   79.1  36.4657  38.5    0.5	Cyg X-1
308.1009  40.9454   18.2  37.8   69.2  -1.1038  -0.6    0.6	Cyg X-3
263.5990   4.4521    2.8  25.4 -172.2   2.2977   4.2 ------	UNKNOWN
236.7991  18.8725    3.4  26.3  -99.8   2.7233   3.4 ------	UNKNOWN
184.5218  62.8625    4.0  58.6  -22.8  15.6554   2.9 ------	UNKNOWN
206.2246  39.6559    4.7  47.0  -53.1   9.0517   2.5 ------	UNKNOWN
235.3745 -13.6152    5.9  51.0 -135.6   6.2070   2.0 ------	UNKNOWN
227.2178   3.3394    4.0  43.1 -112.2   8.5514   2.9 ------	UNKNOWN
Plot creation:
Sun May 31 11:51:25 EDT 2015