Special notes of this burst
Image
Pre-slew 15.0-350.0 keV image (Event data; DETECTION mask)
#   RAcent    DECcent   POSerr    Theta     Phi              Peak Cts       SNR   Name
   91.6694    29.5442   0.0349    40.1001    70.3721         4.1065963      5.450 TRIG_00234516

Foreground time interval of the image:
-169.480  15.864 (delta_t = 185.344 [sec])
Background time interval of the image:
-239.480 -169.480 (delta_t =  70.000 [sec])
Lightcurves
Notes:
- 1) All plots contain as much data as has been downloaded to date.
- 2) The mask-weighted light curves are using the flight position.
- 3) Multiple plots of different time binning/intervals are shown to cover all scenarios of short/long GRBs, rate/image triggers, and real/false positives.
- 4) For all the mask-weighted lightcurves, the y-axis units are counts/sec/det where a det is 0.4 x 0.4 = 0.16 sq cm.
- 5) The verticle lines correspond to following: green dotted lines are T50 interval, black dotted lines are T90 interval, blue solid line(s) is a spacecraft slew start time, and orange solid line(s) is a spacecraft slew end time.
- 6) Time of each bin is in the middle of the bin.
1 s binning
From T0-310 s to T0+310 s

From T100_start - 20 s to T100_end + 30 s

Full time interval

64 ms binning
Full time interval
From T100_start to T100_end
From T0-5 sec to T0+5 sec

16 ms binning
From T100_start-5 s to T100_start+5 s

Blue+Cyan dotted lines: Time interval of the scaled map
From 0.000000 to 4.096000
8 ms binning
From T100_start-3 s to T100_start+3 s

Blue+Cyan dotted lines: Time interval of the scaled map
From 0.000000 to 4.096000
2 ms binning
From T100_start-1 s to T100_start+1 s

Blue+Cyan dotted lines: Time interval of the scaled map
From 0.000000 to 4.096000
SN=5 or 10 sec. binning (whichever binning is satisfied first)

SN=5 or 10 sec. binning (T < 200 sec)

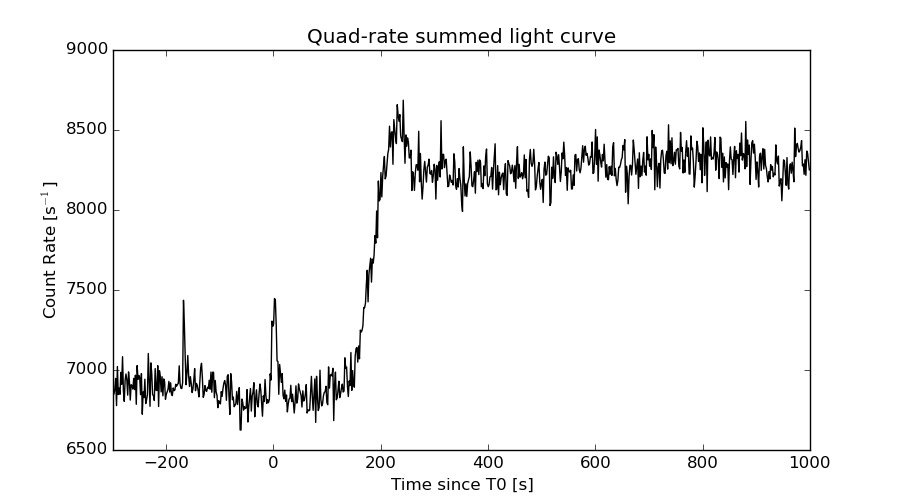
Quad-rate summed light curves (from T0-300s to T0+1000s)
Spectral Evolution

Spectra
Notes:
- 1) The fitting includes the systematic errors.
- 2) For long bursts, a spectral fit of the pre-slew DRM will introduce some errors in both a spectral shape and a normalization if the PHA file contains a lot of the slew/post-slew time interval.
- 3) For fits to more complicated models (e.g. a power-law over a cutoff power-law), the BAT team has decided to require a chi-square improvement of more than 6 for each extra dof.
- 4) For short bursts (T90<1sec), the specrtum is also fit with Blackbody, OTTB, and Double Blackbody.
Time averaged spectrum fit using the pre-slew DRM
Power-law model

Time interval is from -169.224 sec. to   15.192 sec.

Spectral model in power-law:
------------------------------------------------------------
Parameters  : value       lower 90%   higher 90%
Photon index: 1.97743     ( -0.334637   0.368532 )
Norm@50keV  : 1.38686E-03    ( -0.000334658   0.000321157 )
------------------------------------------------------------
#Fit statistic : Chi-Squared =          65.96 using 59 PHA bins.
# Reduced chi-squared =          1.157 for     57 degrees of freedom
# Null hypothesis probability =   1.946693e-01

Photon flux (15-150 keV)    in 184.4 sec: 0.205899 ( -0.0385919  0.0386001 ) ph/cm2/s
Energy fluence (15-150 keV)             : 2.35584e-06 ( -5.24955e-07  5.42997e-07 ) ergs/cm2
Cutoff power-law model

Time interval is from -169.224 sec. to   15.192 sec.
Spectral model in the cutoff power-law:
------------------------------------------------------------
Parameters  : value       lower 90%   higher 90%
Photon index: 1.57671     ( -1.51886   0.578036 )
Epeak [keV] : 44.6048      (   )
Norm@50keV  : 2.36452E-03    (     )
------------------------------------------------------------
#Fit statistic : Chi-Squared =          65.64 using 59 PHA bins.
# Reduced chi-squared =          1.172 for     56 degrees of freedom
# Null hypothesis probability =   1.774432e-01

Photon flux (15-150 keV)    in 184.4 sec: 0.203404 ( -0.039197  0.038993 ) ph/cm2/s
Energy fluence (15-150 keV)             : 2.26937e-06 ( -5.6705e-07  5.96073e-07 ) ergs/cm2
Band function

Time interval is from -169.224 sec. to   15.192 sec.

Spectral model in the Band function:
------------------------------------------------------------
Parameters  : value       lower 90%   higher 90%
alpha       : -1.62598   ( -3.33397   1.506 )
beta        : -9.37005    ( 9.37166   19.3717 )
Epeak [keV] : 45.2855      ( -24.5019 -45.2679 )
Norm@50keV   : 2.20986E-03    ( -0.000903473   0.00204588 )
------------------------------------------------------------
#Fit statistic : Chi-Squared =          65.64 using 59 PHA bins.
# Reduced chi-squared =          1.193 for     55 degrees of freedom
# Null hypothesis probability =   1.542698e-01

Photon flux (15-150 keV)    in 184.4 sec:  (    ) ph/cm2/s
Energy fluence (15-150 keV)             : 2.28237e-06 ( 0  0 ) ergs/cm2
Single BB

Spectral model blackbody:
------------------------------------------------------------
Parameters  : value    Lower 90%  Upper 90%
kT [keV]    : 9.52478  (-2.26069  3.13808)
R^2/D10^2   : 0.114175  (-0.0749317   0.210629)
(R is the radius in km and D10 is the distance to the source in units of 10 kpc)
------------------------------------------------------------
#Fit statistic : Chi-Squared =          73.55 using 59 PHA bins.
# Reduced chi-squared =          1.290 for     57 degrees of freedom
# Null hypothesis probability =   6.917061e-02

Energy  Fluence     90% Error
[keV]   [erg/cm2]   [erg/cm2]
15- 25  3.819e-07   1.396e-07
25- 50  8.848e-07   3.128e-07
50-150  4.004e-07   2.079e-07
15-150  1.667e-06   4.972e-07
Thermal bremsstrahlung (OTTB)

Spectral model: thermal bremsstrahlung
------------------------------------------------------------
Parameters  : value         Lower 90%    Upper 90%
kT [keV]    : 69.6298       (-30.4189      80.4963)
Norm        : 1.01743       (-0.286946     0.384734)
------------------------------------------------------------
#Fit statistic : Chi-Squared =          65.75 using 59 PHA bins.
# Reduced chi-squared =          1.153 for     57 degrees of freedom
# Null hypothesis probability =   1.998074e-01

Energy  Fluence     90% Error
[keV]   [erg/cm2]   [erg/cm2]
15- 25  4.811e-07   1.220e-07
25- 50  7.643e-07   2.015e-07
50-150  9.778e-07   6.663e-07
15-150  2.223e-06   8.009e-07
Double BB

Spectral model: bbodyrad<1> + bbodyrad<2>
------------------------------------------------------------
Parameters  : value         Lower 90%    Upper 90%
kT1 [keV]   : 5.47758        (-1.95995      2.44886)
R1^2/D10^2  : 0.710970        (-0.529168      3.66214)
kT2 [keV]   : 20.3609        (-7.4714      21.257)
R2^2/D10^2  : 4.62321E-03    (-0.00423704   0.027116)
------------------------------------------------------------
#Fit statistic : Chi-Squared =          64.41 using 59 PHA bins.
# Reduced chi-squared =          1.171 for     55 degrees of freedom
# Null hypothesis probability =   1.804960e-01

Energy  Fluence     90% Error
[keV]   [erg/cm2]   [erg/cm2]
15- 25  5.207e-07   2.970e-07
25- 50  7.090e-07   3.566e-07
50-150  1.073e-06   7.083e-07
15-150  2.303e-06   1.270e-06
Peak spectrum fit
Power-law model

Time interval is from    3.580 sec. to    4.580 sec.

Spectral model in power-law:
------------------------------------------------------------
Parameters  : value       lower 90%   higher 90%
Photon index: 2.15755     ( -0.477675   0.597257 )
Norm@50keV  : 1.32371E-02    ( -0.00482045   0.00434636 )
------------------------------------------------------------
#Fit statistic : Chi-Squared =          57.32 using 59 PHA bins.
# Reduced chi-squared =          1.006 for     57 degrees of freedom
# Null hypothesis probability =   4.631886e-01

Photon flux (15-150 keV)    in 1 sec: 2.14370 ( -0.623837  0.625198 ) ph/cm2/s
Energy fluence (15-150 keV)             : 1.23764e-07 ( -3.82588e-08  3.83027e-08 ) ergs/cm2
Cutoff power-law model

Time interval is from    3.580 sec. to    4.580 sec.
Spectral model in the cutoff power-law:
------------------------------------------------------------
Parameters  : value       lower 90%   higher 90%
Photon index: 1.93459     ( -1.61238   0.284147 )
Epeak [keV] : 17.3497      (   )
Norm@50keV  : 1.68212E-02    (     )
------------------------------------------------------------
#Fit statistic : Chi-Squared =          57.40 using 59 PHA bins.
# Reduced chi-squared =          1.025 for     56 degrees of freedom
# Null hypothesis probability =   4.231893e-01

Photon flux (15-150 keV)    in 1 sec: 2.14525 ( -0.62683  0.62162 ) ph/cm2/s
Energy fluence (15-150 keV)             : 1.23634e-07 ( -3.80547e-08  3.8448e-08 ) ergs/cm2
Band function
Time interval is from    3.580 sec. to    4.580 sec.

Spectral model in the Band function:
------------------------------------------------------------
Parameters  : value       lower 90%   higher 90%
alpha       : -2.72506   ( 2.72506   2.72506 )
beta        : -2.15755    ( -0.597258   0.477724 )
Epeak [keV] : 34.4895      ( -34.4895 -34.4895 )
Norm@50keV   : 1.79911    ( -0.655165   0.590745 )
------------------------------------------------------------
#Fit statistic : Chi-Squared =          57.32 using 59 PHA bins.
# Reduced chi-squared =          1.042 for     55 degrees of freedom
# Null hypothesis probability =   3.891276e-01

Photon flux (15-150 keV)    in 1 sec: 2.14344 (    ) ph/cm2/s
Energy fluence (15-150 keV)             : 0 ( 0  0 ) ergs/cm2
Single BB

Spectral model blackbody:
------------------------------------------------------------
Parameters  : value    Lower 90%  Upper 90%
kT [keV]    : 14.8501  (-14.8902  5.78075)
R^2/D10^2   : 0.210811  (-0.207738   4.03275)
(R is the radius in km and D10 is the distance to the source in units of 10 kpc)
------------------------------------------------------------
#Fit statistic : Chi-Squared =          64.77 using 59 PHA bins.
# Reduced chi-squared =          1.136 for     57 degrees of freedom
# Null hypothesis probability =   2.239805e-01

Energy  Fluence     90% Error
[keV]   [erg/cm2]   [erg/cm2]
15- 25  9.749e-09   6.056e-09
25- 50  3.838e-08   2.358e-08
50-150  5.734e-08   3.729e-08
15-150  1.055e-07   6.425e-08
Thermal bremsstrahlung (OTTB)

Spectral model: thermal bremsstrahlung
------------------------------------------------------------
Parameters  : value         Lower 90%    Upper 90%
kT [keV]    : 71.4506       (-37.8198      120.175)
Norm        : 10.2253       (-3.92308     6.36303)
------------------------------------------------------------
#Fit statistic : Chi-Squared =          58.11 using 59 PHA bins.
# Reduced chi-squared =          1.019 for     57 degrees of freedom
# Null hypothesis probability =   4.343374e-01

Energy  Fluence     90% Error
[keV]   [erg/cm2]   [erg/cm2]
15- 25  2.629e-08   1.100e-08
25- 50  4.206e-08   1.784e-08
50-150  5.484e-08   4.182e-08
15-150  1.232e-07   6.155e-08
Double BB
Spectral model: bbodyrad<1> + bbodyrad<2>
------------------------------------------------------------
Parameters  : value         Lower 90%    Upper 90%
kT1 [keV]   : 3.71344        (-2.97196      2.70516)
R1^2/D10^2  : 47.0145        (-43.4682      -47.0098)
kT2 [keV]   : 19.4042        (-5.8584      11.0639)
R2^2/D10^2  : 6.34346E-02    (-0.0535312   0.203642)
------------------------------------------------------------
#Fit statistic : Chi-Squared =          55.39 using 59 PHA bins.
# Reduced chi-squared =          1.007 for     55 degrees of freedom
# Null hypothesis probability =   4.599334e-01

Energy  Fluence     90% Error
[keV]   [erg/cm2]   [erg/cm2]
15- 25  3.414e-08   2.005e-08
25- 50  3.130e-08   1.698e-08
50-150  6.323e-08   3.973e-08
15-150  1.287e-07   6.895e-08
Pre-slew spectrum (Pre-slew PHA with pre-slew DRM)
Power-law model

Spectral model in power-law:
------------------------------------------------------------
Parameters  : value       lower 90%   higher 90%
Photon index: 1.97743     ( -0.334637   0.368532 )
Norm@50keV  : 1.38686E-03    ( -0.000334658   0.000321157 )
------------------------------------------------------------
#Fit statistic : Chi-Squared =          65.96 using 59 PHA bins.
# Reduced chi-squared =          1.157 for     57 degrees of freedom
# Null hypothesis probability =   1.946693e-01

Photon flux (15-150 keV)    in 184.4 sec: 0.205899 ( -0.0385919  0.0386001 ) ph/cm2/s
Energy fluence (15-150 keV)             : 2.35584e-06 ( -5.24955e-07  5.42997e-07 ) ergs/cm2
Cutoff power-law model

Spectral model in the cutoff power-law:
------------------------------------------------------------
Parameters  : value       lower 90%   higher 90%
Photon index: 1.57671     ( -1.51886   0.578131 )
Epeak [keV] : 44.6048      (   )
Norm@50keV  : 2.36452E-03    (     )
------------------------------------------------------------
#Fit statistic : Chi-Squared =          65.64 using 59 PHA bins.
# Reduced chi-squared =          1.172 for     56 degrees of freedom
# Null hypothesis probability =   1.774432e-01

Photon flux (15-150 keV)    in 184.4 sec: 0.203404 ( -0.039197  0.038993 ) ph/cm2/s
Energy fluence (15-150 keV)             : 2.26937e-06 ( -5.6705e-07  5.96073e-07 ) ergs/cm2
Band function

Spectral model in the Band function:
------------------------------------------------------------
Parameters  : value       lower 90%   higher 90%
alpha       : -1.62598   ( -3.33397   1.506 )
beta        : -9.37005    ( 9.37166   19.3717 )
Epeak [keV] : 45.2855      ( -24.5019 -45.2679 )
Norm@50keV   : 2.20986E-03    ( -0.000903473   0.00210412 )
------------------------------------------------------------
#Fit statistic : Chi-Squared =          65.64 using 59 PHA bins.
# Reduced chi-squared =          1.193 for     55 degrees of freedom
# Null hypothesis probability =   1.542698e-01

Photon flux (15-150 keV)    in 184.4 sec:  (    ) ph/cm2/s
Energy fluence (15-150 keV)             : 2.28237e-06 ( 0  0 ) ergs/cm2
S(25-50 keV) vs. S(50-100 keV) plot
S(25-50 keV)  = 7.04e-07
S(50-100 keV) = 7.16e-07
T90 vs. Hardness ratio plot

T90                                   = 180.383999973536 sec.
Hardness ratio (energy fluence ratio) = 1.01705
Color vs. Color plot

Count Ratio  (25-50 keV) / (15-25 keV) = 0.823377
Count Ratio (50-100 keV) / (15-25 keV) = 0.612795
Mask shadow pattern (with DETECTION mask)

IMX = 2.828634467430531E-01, IMY = -7.931505063363159E-01
TIME vs. PHA plot around the trigger time
Blue+Cyan dotted lines: Time interval of the scaled map
From 0.000000 to 4.096000
TIME vs. DetID plot around the trigger time
Blue+Cyan dotted lines: Time interval of the scaled map
From 0.000000 to 4.096000
100 us light curve (15-350 keV)

Blue+Cyan dotted lines: Time interval of the scaled map
From 0.000000 to 4.096000
Spacecraft aspect plot

Bright source in the pre-burst/pre-slew/post-slew images
Pre-burst image of 15-350 keV band
Time interval of the image:
-239.480000 -169.224000

# RAcent  DECcent POSerr Theta    Phi  PeakCts   SNR AngSep     Name
#  [deg]    [deg]    ['] [deg]  [deg]                   [']
198.9603  69.2268    3.1  40.7 -169.6   0.4185   3.7 ------	UNKNOWN
Pre-slew background subtracted image of 15-350 keV band
Time interval of the image:
-169.224000 15.192000

# RAcent  DECcent POSerr Theta    Phi  PeakCts   SNR AngSep     Name
#  [deg]    [deg]    ['] [deg]  [deg]                   [']
161.6889  77.4084    2.4  36.7  170.4   1.6098   4.8 ------	UNKNOWN
211.6453  60.2853    2.3  46.2 -156.7   2.1240   5.0 ------	UNKNOWN
Post-slew image of 15-350 keV band
Time interval of the image:
268.220600 962.600000

# RAcent  DECcent POSerr Theta    Phi  PeakCts   SNR AngSep     Name
#  [deg]    [deg]    ['] [deg]  [deg]                   [']
244.9833 -15.6443    0.5  39.8  -58.4  21.0980  23.8    0.3	Sco X-1
255.9957 -37.8275    0.6  21.7  -91.5   8.2787  18.6    1.1	4U 1700-377
256.4188 -36.4162    2.5  21.6  -87.6   2.0016   4.6    0.9	GX 349+2
263.0282 -24.7555    1.4  20.9  -51.3   3.3462   8.2    1.2	GX 1+4
264.7316 -44.5949   13.5  16.2 -115.4   0.3363   0.9    8.7	4U 1735-44
268.3656  -1.4139    3.6  37.7  -14.6   1.5572   3.2    2.3	SW J1753.5-0127
270.2597 -25.1041    2.0  15.9  -37.8   2.2713   5.8    2.0	GX 5-1
270.3194 -25.7445    3.4  15.4  -39.2   1.3985   3.6    0.9	GRS 1758-258
273.9056 -14.0769    2.2  23.9  -12.7   2.3002   5.2    6.3	GX 17+2
275.8394 -30.3338    2.7   8.7  -37.2   1.6145   4.3    4.9	H1820-303
284.9763 -24.9566    4.5  11.6   17.9   0.8764   2.5    3.9	HT1900.1-2455
288.7977  10.9436    1.1  47.7   17.6   9.4618  10.2    0.1	GRS 1915+105
263.0085 -33.8937    3.9  16.8  -76.8   1.1410   2.9    3.7	GX 354-0
277.3501 -23.7841    2.4  13.7  -13.3   1.7654   4.7 ------	UNKNOWN
258.2543 -56.3114    2.8  26.0 -137.3   1.5038   4.2 ------	UNKNOWN
243.6111 -55.5795    3.5  32.8 -127.9   1.7573   3.3 ------	UNKNOWN
199.9838 -68.7698    3.4  54.0 -143.3   7.9195   3.4 ------	UNKNOWN
225.5920 -47.5739    2.9  43.2 -113.3   6.2595   3.9 ------	UNKNOWN
241.7320  -8.0072    3.0  47.3  -53.1   6.2065   3.9 ------	UNKNOWN
Plot creation:
Fri Dec 18 20:53:17 EST 2015