Special notes of this burst
Image
Pre-slew 15.0-350.0 keV image (Event data)
#   RAcent    DECcent   POSerr    Theta     Phi              Peak Cts       SNR   Name
  270.8761   -82.2402   0.0418    35.1733  -156.5944         0.4270291      4.590 TRIG_00235645

Foreground time interval of the image:
  0.000  64.000 (delta_t =  64.000 [sec])
Background time interval of the image:
Lightcurves
Notes:
- 1) The mask-weighted light curves are using the flight position.
- 2) Multiple plots of different time binning/intervals are shown to cover all scenarios of short/long GRBs, rate/image triggers, and real/false positives.
- 3) For all the mask-weighted lightcurves, the y-axis units are counts/sec/det where a det is 0.4 x 0.4 = 0.16 sq cm.
- 4) The verticle lines correspond to following: green dotted lines are T50 interval, black dotted lines are T90 interval, blue solid line(s) is a spacecraft slew start time, and orange solid line(s) is a spacecraft slew end time.
- 5) Time of each bin is in the middle of the bin.
1 s binning
From T0-310 s to T0+310 s
From T100_start - 20 s to T100_end + 30 s
Full time interval
64 ms binning
Full time interval
From T100_start to T100_end
From T0-5 sec to T0+5 sec
16 ms binning
From T100_start-5 s to T100_start+5 s
Blue+Cyan dotted lines: Time interval of the scaled map
From 0.000000 to 64.000000
8 ms binning
From T100_start-3 s to T100_start+3 s
Blue+Cyan dotted lines: Time interval of the scaled map
From 0.000000 to 64.000000
2 ms binning
From T100_start-1 s to T100_start+1 s

Blue+Cyan dotted lines: Time interval of the scaled map
From 0.000000 to 64.000000
SN=5 or 10 sec. binning (whichever binning is satisfied first)
SN=5 or 10 sec. binning (T < 200 sec)
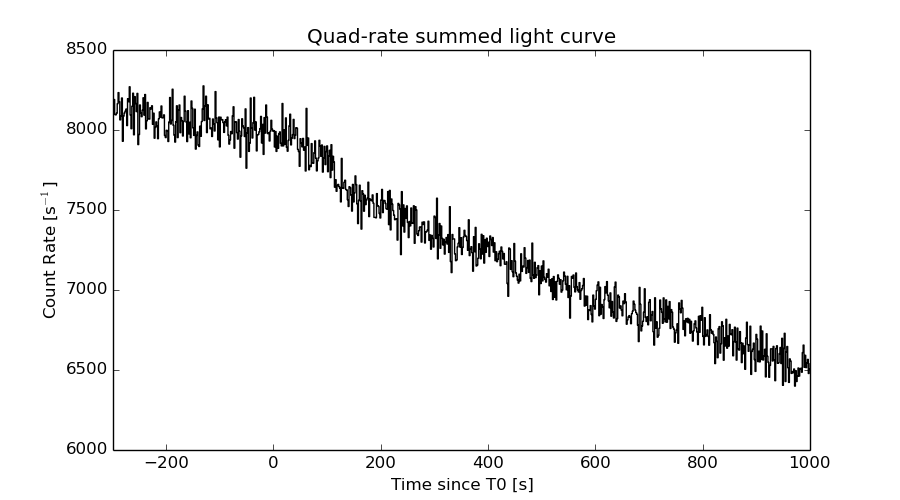
Quad-rate summed light curves (from T0-300s to T0+1000s)
Spectral Evolution

Spectra
Notes:
- 1) The fitting includes the systematic errors.
- 2) When the burst includes telescope slew time periods, the fitting uses an average response file made from multiple 5-s response files through out the slew time plus single time preiod for the non-slew times, and weighted by the total counts in the corresponding time period using addrmf. An average response file is needed becuase a spectral fit using the pre-slew DRM will introduce some errors in both a spectral shape and a normalization if the PHA file contains a lot of the slew/post-slew time interval.
- 3) For fits to more complicated models (e.g. a power-law over a cutoff power-law), the BAT team has decided to require a chi-square improvement of more than 6 for each extra dof.
Time averaged spectrum fit using the average DRM
Power-law model
Time interval is from    0.000 sec. to   64.000 sec.

Spectral model in power-law:
------------------------------------------------------------
Parameters  : value       lower 90%   higher 90%
Photon index: 1.88318     ( -0.447071   0.487721 )
Norm@50keV  : 4.90585E-04    ( -0.000163138   0.000159576 )
------------------------------------------------------------
#Fit statistic : Chi-Squared =          68.26 using 59 PHA bins.
# Reduced chi-squared =          1.198 for     57 degrees of freedom
# Null hypothesis probability =   1.459750e-01

Photon flux (15-150 keV)    in 64 sec: 6.99117E-02 ( -0.0198275  0.0198667 ) ph/cm2/s
Energy fluence (15-150 keV)             : 2.88502e-07 ( -9.20838e-08  9.67706e-08 ) ergs/cm2
Cutoff power-law model
Time interval is from    0.000 sec. to   64.000 sec.
Spectral model in the cutoff power-law:
------------------------------------------------------------
Parameters  : value       lower 90%   higher 90%
Photon index: -0.140931     ( 0.159712   2.0675 )
Epeak [keV] : 40.9758      (   )
Norm@50keV  : 8.11827E-03    (     )
------------------------------------------------------------
#Fit statistic : Chi-Squared =          65.40 using 59 PHA bins.
# Reduced chi-squared =          1.168 for     56 degrees of freedom
# Null hypothesis probability =   1.827731e-01

Photon flux (15-150 keV)    in 64 sec: 6.69542E-02 ( -0.0221959  0.0198116 ) ph/cm2/s
Energy fluence (15-150 keV)             : 2.40477e-07 ( -1.11547e-07  1.06403e-07 ) ergs/cm2
Band function

Time interval is from    0.000 sec. to   64.000 sec.

Spectral model in the Band function:
------------------------------------------------------------
Parameters  : value       lower 90%   higher 90%
alpha       : 5.00000   ( -5.08467   -5 )
beta        : -2.79779    ( -2.49162   0.868509 )
Epeak [keV] : 30.1140      ( -7.3562 6.44257 )
Norm@50keV   : 27.2941    ( -7.17738   128.422 )
------------------------------------------------------------
#Fit statistic : Chi-Squared =          62.57 using 59 PHA bins.
# Reduced chi-squared =          1.138 for     55 degrees of freedom
# Null hypothesis probability =   2.254532e-01

Photon flux (15-150 keV)    in 64 sec: 6.78280E-02 ( 6.93217  -0.0202959 ) ph/cm2/s
Energy fluence (15-150 keV)             : 2.41593e-07 ( 0  0 ) ergs/cm2
Single BB
Spectral model blackbody:
------------------------------------------------------------
Parameters  : value    Lower 90%  Upper 90%
kT [keV]    : 9.37527  (-2.38063  3.73967)
R^2/D10^2   : 4.48003E-02  (-0.0325411   0.094349)
(R is the radius in km and D10 is the distance to the source in units of 10 kpc)
------------------------------------------------------------
#Fit statistic : Chi-Squared =          65.90 using 59 PHA bins.
# Reduced chi-squared =          1.156 for     57 degrees of freedom
# Null hypothesis probability =   1.961088e-01

Energy  Fluence     90% Error
[keV]   [erg/cm2]   [erg/cm2]
15- 25  5.004e-08   3.108e-08
25- 50  1.132e-07   6.392e-08
50-150  4.888e-08   3.416e-08
15-150  2.122e-07   1.216e-07
Thermal bremsstrahlung (OTTB)
Spectral model: thermal bremsstrahlung
------------------------------------------------------------
Parameters  : value         Lower 90%    Upper 90%
kT [keV]    : 70.3497       (-36.4195      -70.3638)
Norm        : 0.353165       (-0.124162     0.190693)
------------------------------------------------------------
#Fit statistic : Chi-Squared =          66.53 using 59 PHA bins.
# Reduced chi-squared =          1.167 for     57 degrees of freedom
# Null hypothesis probability =   1.818059e-01

Energy  Fluence     90% Error
[keV]   [erg/cm2]   [erg/cm2]
15- 25  5.802e-08   3.468e-08
25- 50  9.244e-08   5.453e-08
50-150  1.192e-07   9.849e-08
15-150  2.696e-07   1.820e-07
Double BB
Spectral model: bbodyrad<1> + bbodyrad<2>
------------------------------------------------------------
Parameters  : value         Lower 90%    Upper 90%
kT1 [keV]   : 7.05456        (-7.0732      4.24927)
R1^2/D10^2  : 9.69363E-02        (-0.0918911      -0.0918911)
kT2 [keV]   : 19.5232        (-20.311      -20.311)
R2^2/D10^2  : 1.43539E-03    (-0.00108177   0.0863116)
------------------------------------------------------------
#Fit statistic : Chi-Squared =          64.12 using 59 PHA bins.
# Reduced chi-squared =          1.166 for     55 degrees of freedom
# Null hypothesis probability =   1.872328e-01

Energy  Fluence     90% Error
[keV]   [erg/cm2]   [erg/cm2]
15- 25  5.681e-08   3.408e-08
25- 50  1.029e-07   5.869e-08
50-150  1.059e-07   7.648e-08
15-150  2.656e-07   1.509e-07
Pre-slew spectrum (Pre-slew PHA with pre-slew DRM)
Power-law model
Spectral model in power-law:
------------------------------------------------------------
Parameters  : value       lower 90%   higher 90%
Photon index: 1.88318     ( -0.447071   0.487721 )
Norm@50keV  : 4.90585E-04    ( -0.000163138   0.000159576 )
------------------------------------------------------------
#Fit statistic : Chi-Squared =          68.26 using 59 PHA bins.
# Reduced chi-squared =          1.198 for     57 degrees of freedom
# Null hypothesis probability =   1.459750e-01

Photon flux (15-150 keV)    in 64 sec: 6.99117E-02 ( -0.0198275  0.0198667 ) ph/cm2/s
Energy fluence (15-150 keV)             : 2.88502e-07 ( -9.20838e-08  9.67706e-08 ) ergs/cm2
Cutoff power-law model
Spectral model in the cutoff power-law:
------------------------------------------------------------
Parameters  : value       lower 90%   higher 90%
Photon index: -0.140931     ( 0.159712   2.0675 )
Epeak [keV] : 40.9758      (   )
Norm@50keV  : 8.11827E-03    (     )
------------------------------------------------------------
#Fit statistic : Chi-Squared =          65.40 using 59 PHA bins.
# Reduced chi-squared =          1.168 for     56 degrees of freedom
# Null hypothesis probability =   1.827731e-01

Photon flux (15-150 keV)    in 64 sec: 6.69542E-02 ( -0.0221927  0.0198115 ) ph/cm2/s
Energy fluence (15-150 keV)             : 2.40477e-07 ( -1.11547e-07  1.06403e-07 ) ergs/cm2
Band function
Spectral model in the Band function:
------------------------------------------------------------
Parameters  : value       lower 90%   higher 90%
alpha       : 5.00000   ( -5.08467   -5 )
beta        : -2.79779    ( -2.49162   0.868509 )
Epeak [keV] : 30.1140      ( -7.3562 6.44257 )
Norm@50keV   : 27.2941    ( -7.17738   128.422 )
------------------------------------------------------------
#Fit statistic : Chi-Squared =          62.57 using 59 PHA bins.
# Reduced chi-squared =          1.138 for     55 degrees of freedom
# Null hypothesis probability =   2.254532e-01

Photon flux (15-150 keV)    in 64 sec: 6.78280E-02 ( 6.93217  -0.0202959 ) ph/cm2/s
Energy fluence (15-150 keV)             : 2.41593e-07 ( 0  0 ) ergs/cm2
S(25-50 keV) vs. S(50-100 keV) plot
S(25-50 keV)  = 8.37e-08
S(50-100 keV) = 9.07e-08
T90 vs. Hardness ratio plot
T90                                   = 64 sec.
Hardness ratio (energy fluence ratio) = 1.08363
Color vs. Color plot
Count Ratio  (25-50 keV) / (15-25 keV) = 1.77382
Count Ratio (50-100 keV) / (15-25 keV) = 0.583288
Mask shadow pattern
IMX = -6.467363073076796E-01, IMY = 2.799426606878527E-01
TIME vs. PHA plot around the trigger time
Blue+Cyan dotted lines: Time interval of the scaled map
From 0.000000 to 64.000000
TIME vs. DetID plot around the trigger time
Blue+Cyan dotted lines: Time interval of the scaled map
From 0.000000 to 64.000000
100 us light curve (15-350 keV)
Blue+Cyan dotted lines: Time interval of the scaled map
From 0.000000 to 64.000000
Spacecraft aspect plot
Bright source in the pre-burst/pre-slew/post-slew images
Pre-burst image of 15-350 keV band
Time interval of the image:
Pre-slew background subtracted image of 15-350 keV band
Time interval of the image:
0.000000 64.000000

# RAcent  DECcent POSerr Theta    Phi  PeakCts   SNR AngSep     Name
#  [deg]    [deg]    ['] [deg]  [deg]                   [']
255.9710 -37.8211    1.9  33.9  -72.4   0.9063   6.0    1.6	4U 1700-377
256.4749 -36.3916    4.8  34.4  -69.8   0.3593   2.4    2.7	GX 349+2
263.1358 -24.7329    2.8  37.8  -48.5   0.5508   4.1    7.0	GX 1+4
264.4988 -44.5610    0.0  25.1  -78.6   0.1310   1.4   12.4	4U 1735-44
268.3600  -1.3855    5.5  54.6  -24.6   0.5913   2.1    4.1	SW J1753.5-0127
270.3037 -24.9380  199.9  33.5  -40.1   0.0059   0.1    8.5	GX 5-1
270.2530 -25.7221    3.6  32.9  -41.1   0.3233   3.2    3.0	GRS 1758-258
274.0216 -14.0482    4.5  40.8  -25.5   0.3110   2.6    1.2	GX 17+2
276.0183 -30.3905    3.3  26.1  -39.0   0.3083   3.5    5.0	H1820-303
285.1734 -25.0519    8.8  26.3  -16.9   0.1118   1.3   10.9	HT1900.1-2455
262.9899 -33.8346   53.8  31.6  -60.2   0.0244   0.2    0.0	GX 354-0
 83.1030 -73.4723    2.5  55.5 -175.5   1.4336   4.6 ------	UNKNOWN
270.8740 -82.2401    2.5  35.2 -156.6   0.4273   4.6 ------	UNKNOWN
Post-slew image of 15-350 keV band
Time interval of the image:
131.300590 963.097200

# RAcent  DECcent POSerr Theta    Phi  PeakCts   SNR AngSep     Name
#  [deg]    [deg]    ['] [deg]  [deg]                   [']
135.4614 -40.5757   14.0  55.2 -168.4   1.2358   0.8    3.3	Vela X-1
170.3430 -60.6189    8.4  31.7 -142.1   0.6992   1.4    0.8	Cen X-3
186.7154 -62.6846    3.0  27.5 -128.1   1.8089   3.9    5.4	GX 301-2
255.9229 -37.8339    2.1  44.7  -45.7   5.9861   5.6    3.1	4U 1700-377
256.6354 -36.4625    7.8  46.0  -44.9   1.7557   1.5    9.9	GX 349+2
264.8617 -44.5510    5.0  37.7  -35.9   1.3767   2.3    7.9	4U 1735-44
270.2559 -25.0677  105.1  57.1  -29.6   0.2660   0.1    1.7	GX 5-1
270.4469 -25.7347    8.6  56.5  -29.4   2.9330   1.3    7.8	GRS 1758-258
275.7805 -30.3620    9.3  51.9  -23.5   1.2177   1.2    7.5	H1820-303
285.0039 -24.9281    8.3  57.5  -13.7   2.5547   1.4    1.8	HT1900.1-2455
263.1752 -33.8555   11.4  48.4  -37.5   1.1284   1.0    9.4	GX 354-0
119.7339 -41.3429    2.9  55.6  177.2   9.3284   4.0 ------	UNKNOWN
121.8926 -39.8578    4.4  56.9  179.3   8.4536   2.6 ------	UNKNOWN
129.3318 -39.0830    5.1  57.2 -173.8   5.2296   2.3 ------	UNKNOWN
270.5406 -53.9756    3.4  28.2  -29.3   1.2957   3.4 ------	UNKNOWN
137.2527 -36.5415    3.3  59.0 -166.2  11.8306   3.5 ------	UNKNOWN
159.8189 -37.8923    5.5  55.2 -145.2   6.6548   2.1 ------	UNKNOWN
Plot creation:
Sun May 31 11:39:25 EDT 2015