Click here for the BAT GCN circular template
Image
Pre-slew 15.0-350.0 keV image (Event data)
#   RAcent    DECcent   POSerr    Theta     Phi              Peak Cts       SNR   Name
  148.3921   -17.0292   0.0246     5.7895  -160.7003         0.5153315      7.779 TRIG_00236430

Foreground time interval of the image:
 -0.996  48.800 (delta_t =  49.796 [sec])
Background time interval of the image:
-239.768  -0.996 (delta_t = 238.772 [sec])
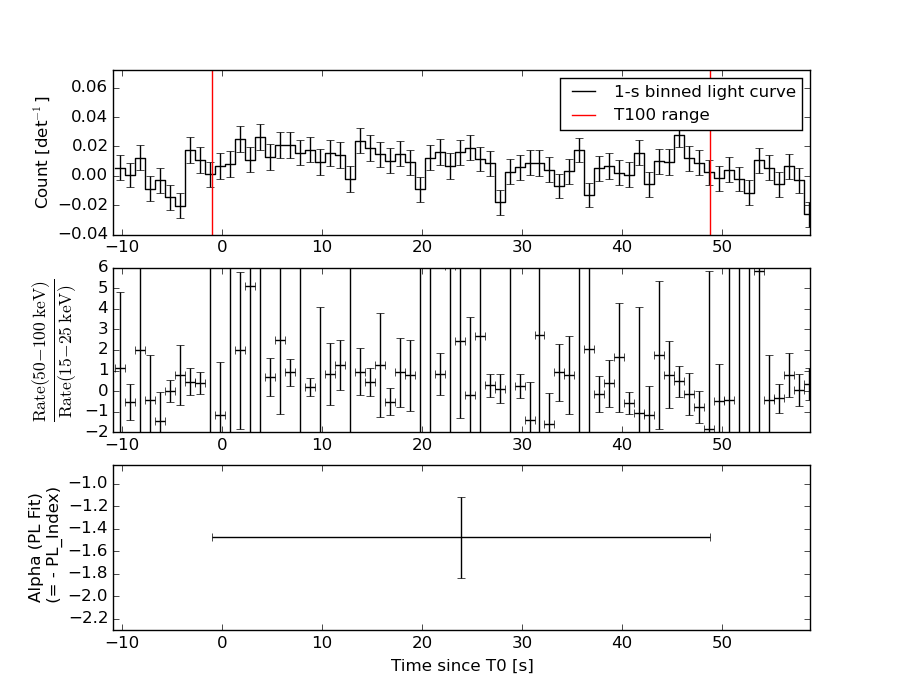
Lightcurves
Notes:
- 1) The mask-weighted light curves are using the flight position.
- 2) Multiple plots of different time binning/intervals are shown to cover all scenarios of short/long GRBs, rate/image triggers, and real/false positives.
- 3) For all the mask-weighted lightcurves, the y-axis units are counts/sec/det where a det is 0.4 x 0.4 = 0.16 sq cm.
- 4) The verticle lines correspond to following: green dotted lines are T50 interval, black dotted lines are T90 interval, blue solid line(s) is a spacecraft slew start time, and orange solid line(s) is a spacecraft slew end time.
- 5) Time of each bin is in the middle of the bin.
1 s binning
From T0-310 s to T0+310 s

From T100_start - 20 s to T100_end + 30 s

Full time interval

64 ms binning
Full time interval
From T100_start to T100_end

From T0-5 sec to T0+5 sec
16 ms binning
From T100_start-5 s to T100_start+5 s
Blue+Cyan dotted lines: Time interval of the scaled map
From 0.000000 to 12.160000
8 ms binning
From T100_start-3 s to T100_start+3 s

Blue+Cyan dotted lines: Time interval of the scaled map
From 0.000000 to 12.160000
2 ms binning
From T100_start-1 s to T100_start+1 s
Blue+Cyan dotted lines: Time interval of the scaled map
From 0.000000 to 12.160000
SN=5 or 10 sec. binning (whichever binning is satisfied first)
SN=5 or 10 sec. binning (T < 200 sec)
Quad-rate summed light curves (from T0-300s to T0+1000s)

Spectral Evolution
Spectra
Notes:
- 1) The fitting includes the systematic errors.
- 2) When the burst includes telescope slew time periods, the fitting uses an average response file made from multiple 5-s response files through out the slew time plus single time preiod for the non-slew times, and weighted by the total counts in the corresponding time period using addrmf. An average response file is needed becuase a spectral fit using the pre-slew DRM will introduce some errors in both a spectral shape and a normalization if the PHA file contains a lot of the slew/post-slew time interval.
- 3) For fits to more complicated models (e.g. a power-law over a cutoff power-law), the BAT team has decided to require a chi-square improvement of more than 6 for each extra dof.
Time averaged spectrum fit using the average DRM
Power-law model

Time interval is from   -0.996 sec. to   48.800 sec.

Spectral model in power-law:
------------------------------------------------------------
Parameters  : value       lower 90%   higher 90%
Photon index: 1.47419     ( -0.361617   0.366171 )
Norm@50keV  : 5.82263E-04    ( -0.000127815   0.000124879 )
------------------------------------------------------------
#Fit statistic : Chi-Squared =          64.31 using 59 PHA bins.
# Reduced chi-squared =          1.128 for     57 degrees of freedom
# Null hypothesis probability =   2.359259e-01

Photon flux (15-150 keV)    in 49.8 sec: 7.21965E-02 ( -0.0146472  0.0146528 ) ph/cm2/s
Energy fluence (15-150 keV)             : 2.76278e-07 ( -6.64038e-08  6.87668e-08 ) ergs/cm2
Cutoff power-law model

Time interval is from   -0.996 sec. to   48.800 sec.
Spectral model in the cutoff power-law:
------------------------------------------------------------
Parameters  : value       lower 90%   higher 90%
Photon index: 1.47654     ( -0.456523   0.365004 )
Epeak [keV] : 9999.35      ( -9999.36 -9999.36 )
Norm@50keV  : 5.82766E-04    ( -0.000128212   0.00329089 )
------------------------------------------------------------
#Fit statistic : Chi-Squared =          64.31 using 59 PHA bins.
# Reduced chi-squared =          1.148 for     56 degrees of freedom
# Null hypothesis probability =   2.083753e-01

Photon flux (15-150 keV)    in 49.8 sec: 7.21918E-02 ( -0.0148838  0.0146317 ) ph/cm2/s
Energy fluence (15-150 keV)             : 2.75168e-07 ( -7.81935e-08  6.89511e-08 ) ergs/cm2
Band function

Time interval is from   -0.996 sec. to   48.800 sec.

Spectral model in the Band function:
------------------------------------------------------------
Parameters  : value       lower 90%   higher 90%
alpha       : 5.00000   ( -5.78941   -5 )
beta        : -1.92686    ( -0.840259   0.545342 )
Epeak [keV] : 30.1115      ( -9.52813 5.90231 )
Norm@50keV   : 22.3954    ( -4.44014   189.342 )
------------------------------------------------------------
#Fit statistic : Chi-Squared =          61.13 using 59 PHA bins.
# Reduced chi-squared =          1.111 for     55 degrees of freedom
# Null hypothesis probability =   2.652341e-01

Photon flux (15-150 keV)    in 49.8 sec:  (    ) ph/cm2/s
Energy fluence (15-150 keV)             : 0 ( 0  0 ) ergs/cm2
Single BB

Spectral model blackbody:
------------------------------------------------------------
Parameters  : value    Lower 90%  Upper 90%
kT [keV]    : 11.1897  (-3.02951  5.54723)
R^2/D10^2   : 2.23535E-02  (-0.01663   0.0477437)
(R is the radius in km and D10 is the distance to the source in units of 10 kpc)
------------------------------------------------------------
#Fit statistic : Chi-Squared =          71.94 using 59 PHA bins.
# Reduced chi-squared =          1.262 for     57 degrees of freedom
# Null hypothesis probability =   8.781227e-02

Energy  Fluence     90% Error
[keV]   [erg/cm2]   [erg/cm2]
15- 25  2.922e-08   1.287e-08
25- 50  8.444e-08   3.260e-08
50-150  6.050e-08   3.253e-08
15-150  1.742e-07   6.569e-08
Thermal bremsstrahlung (OTTB)

Spectral model: thermal bremsstrahlung
------------------------------------------------------------
Parameters  : value         Lower 90%    Upper 90%
kT [keV]    : 199.363       (-117.369      -199.363)
Norm        : 0.294615       (-0.0596811     0.0597171)
------------------------------------------------------------
#Fit statistic : Chi-Squared =          64.50 using 59 PHA bins.
# Reduced chi-squared =          1.132 for     57 degrees of freedom
# Null hypothesis probability =   2.308961e-01

Energy  Fluence     90% Error
[keV]   [erg/cm2]   [erg/cm2]
15- 25  3.653e-08   2.153e-08
25- 50  7.028e-08   4.096e-08
50-150  1.541e-07   8.944e-08
15-150  2.609e-07   1.510e-07
Double BB

Spectral model: bbodyrad<1> + bbodyrad<2>
------------------------------------------------------------
Parameters  : value         Lower 90%    Upper 90%
kT1 [keV]   : 7.32998        (-1.95622      2.81369)
R1^2/D10^2  : 8.35936E-02        (-0.0565957      0.158918)
kT2 [keV]   : 45.6510        (-24.957      -45.8023)
R2^2/D10^2  : 1.79673E-04    (-0.00016354   0.00171174)
------------------------------------------------------------
#Fit statistic : Chi-Squared =          60.76 using 59 PHA bins.
# Reduced chi-squared =          1.105 for     55 degrees of freedom
# Null hypothesis probability =   2.761975e-01

Energy  Fluence     90% Error
[keV]   [erg/cm2]   [erg/cm2]
15- 25  3.978e-08   2.301e-08
25- 50  7.164e-08   3.976e-08
50-150  1.828e-07   1.026e-07
15-150  2.942e-07   1.568e-07
Peak spectrum fit
Power-law model

Time interval is from   14.664 sec. to   15.664 sec.

Spectral model in power-law:
------------------------------------------------------------
Parameters  : value       lower 90%   higher 90%
Photon index: 1.92103     ( -0.691134   0.911588 )
Norm@50keV  : 1.69320E-03    ( -0.000952082   0.000899818 )
------------------------------------------------------------
#Fit statistic : Chi-Squared =          52.05 using 59 PHA bins.
# Reduced chi-squared =         0.9131 for     57 degrees of freedom
# Null hypothesis probability =   6.609221e-01

Photon flux (15-150 keV)    in 1 sec: 0.245196 ( -0.102797  0.102972 ) ph/cm2/s
Energy fluence (15-150 keV)             : 1.55746e-08 ( -7.83731e-09  8.73011e-09 ) ergs/cm2
Cutoff power-law model

Time interval is from   14.664 sec. to   15.664 sec.
Spectral model in the cutoff power-law:
------------------------------------------------------------
Parameters  : value       lower 90%   higher 90%
Photon index: -1.67856     ( 1.75798   3.90504 )
Epeak [keV] : 42.9712      ( -43.0043 -43.0043 )
Norm@50keV  : 0.184056    ( -0.23924   8840.65 )
------------------------------------------------------------
#Fit statistic : Chi-Squared =          50.02 using 59 PHA bins.
# Reduced chi-squared =         0.8931 for     56 degrees of freedom
# Null hypothesis probability =   6.996356e-01

Photon flux (15-150 keV)    in 1 sec: 0.223952 ( -0.115095  0.104714 ) ph/cm2/s
Energy fluence (15-150 keV)             : 1.32596e-08 ( -5.6339e-09  7.5008e-09 ) ergs/cm2
Band function

Time interval is from   14.664 sec. to   15.664 sec.

Spectral model in the Band function:
------------------------------------------------------------
Parameters  : value       lower 90%   higher 90%
alpha       : 2.83492   ( -8.36078   -3.05125 )
beta        : -9.99674    ( 9.99674   19.9934 )
Epeak [keV] : 43.2712      ( -18.6123 29.8145 )
Norm@50keV   : 0.738290    ( -0.73829   6.01601 )
------------------------------------------------------------
#Fit statistic : Chi-Squared =          49.98 using 59 PHA bins.
# Reduced chi-squared =         0.9087 for     55 degrees of freedom
# Null hypothesis probability =   6.664456e-01

Photon flux (15-150 keV)    in 1 sec:  (    ) ph/cm2/s
Energy fluence (15-150 keV)             : 0 ( 0  0 ) ergs/cm2
Single BB

Spectral model blackbody:
------------------------------------------------------------
Parameters  : value    Lower 90%  Upper 90%
kT [keV]    : 11.0502  (-3.29253  4.5307)
R^2/D10^2   : 9.07624E-02  (-0.0907625   0.233822)
(R is the radius in km and D10 is the distance to the source in units of 10 kpc)
------------------------------------------------------------
#Fit statistic : Chi-Squared =          49.92 using 59 PHA bins.
# Reduced chi-squared =         0.8757 for     57 degrees of freedom
# Null hypothesis probability =   7.356484e-01

Energy  Fluence     90% Error
[keV]   [erg/cm2]   [erg/cm2]
15- 25  2.318e-09   1.502e-09
25- 50  6.592e-09   4.083e-09
50-150  4.563e-09   3.442e-09
15-150  1.347e-08   8.760e-09
Thermal bremsstrahlung (OTTB)

Spectral model: thermal bremsstrahlung
------------------------------------------------------------
Parameters  : value         Lower 90%    Upper 90%
kT [keV]    : 66.5738       (-66.7366      -66.7366)
Norm        : 1.26261       (-0.589927     1.10845)
------------------------------------------------------------
#Fit statistic : Chi-Squared =          51.35 using 59 PHA bins.
# Reduced chi-squared =         0.9009 for     57 degrees of freedom
# Null hypothesis probability =   6.859552e-01

Energy  Fluence     90% Error
[keV]   [erg/cm2]   [erg/cm2]
15- 25  3.221e-09   2.121e-09
25- 50  5.054e-09   3.294e-09
50-150  6.249e-09   5.890e-09
15-150  1.452e-08   1.061e-08
Double BB

Spectral model: bbodyrad<1> + bbodyrad<2>
------------------------------------------------------------
Parameters  : value         Lower 90%    Upper 90%
kT1 [keV]   : 1.67569        (-1.68591      13.7229)
R1^2/D10^2  : 372.929        (-367.564      -367.564)
kT2 [keV]   : 11.6689        (-3.57349      -11.6717)
R2^2/D10^2  : 7.01399E-02    (-0.0701238   0.199931)
------------------------------------------------------------
#Fit statistic : Chi-Squared =          49.20 using 59 PHA bins.
# Reduced chi-squared =         0.8946 for     55 degrees of freedom
# Null hypothesis probability =   6.946588e-01

Energy  Fluence     90% Error
[keV]   [erg/cm2]   [erg/cm2]
15- 25  2.653e-09   1.424e-09
25- 50  6.138e-09   3.809e-09
50-150  4.924e-09   3.775e-09
15-150  1.372e-08   8.935e-09
Pre-slew spectrum (Pre-slew PHA with pre-slew DRM)
Power-law model

Spectral model in power-law:
------------------------------------------------------------
Parameters  : value       lower 90%   higher 90%
Photon index: 1.47419     ( -0.361617   0.366171 )
Norm@50keV  : 5.82263E-04    ( -0.000127815   0.000124879 )
------------------------------------------------------------
#Fit statistic : Chi-Squared =          64.31 using 59 PHA bins.
# Reduced chi-squared =          1.128 for     57 degrees of freedom
# Null hypothesis probability =   2.359259e-01

Photon flux (15-150 keV)    in 49.8 sec: 7.21965E-02 ( -0.0146472  0.0146528 ) ph/cm2/s
Energy fluence (15-150 keV)             : 2.76278e-07 ( -6.64038e-08  6.87668e-08 ) ergs/cm2
Cutoff power-law model

Spectral model in the cutoff power-law:
------------------------------------------------------------
Parameters  : value       lower 90%   higher 90%
Photon index: 1.47654     ( -0.456523   0.365004 )
Epeak [keV] : 9999.35      ( -9999.36 -9999.36 )
Norm@50keV  : 5.82766E-04    ( -0.000128212   0.00329089 )
------------------------------------------------------------
#Fit statistic : Chi-Squared =          64.31 using 59 PHA bins.
# Reduced chi-squared =          1.148 for     56 degrees of freedom
# Null hypothesis probability =   2.083753e-01

Photon flux (15-150 keV)    in 49.8 sec: 7.21918E-02 ( -0.0148838  0.0146317 ) ph/cm2/s
Energy fluence (15-150 keV)             : 2.75168e-07 ( -7.81935e-08  6.89511e-08 ) ergs/cm2
Band function

Spectral model in the Band function:
------------------------------------------------------------
Parameters  : value       lower 90%   higher 90%
alpha       : 5.00000   ( -13.5656   -5 )
beta        : -1.92686    ( -0.840259   0.545342 )
Epeak [keV] : 30.1115      ( -9.52813 5.90231 )
Norm@50keV   : 22.3954    ( -4.44014   189.342 )
------------------------------------------------------------
#Fit statistic : Chi-Squared =          61.13 using 59 PHA bins.
# Reduced chi-squared =          1.111 for     55 degrees of freedom
# Null hypothesis probability =   2.652341e-01

Photon flux (15-150 keV)    in 49.8 sec:  (    ) ph/cm2/s
Energy fluence (15-150 keV)             : 0 ( 0  0 ) ergs/cm2
S(25-50 keV) vs. S(50-100 keV) plot
S(25-50 keV)  = 6.75e-08
S(50-100 keV) = 9.71e-08
T90 vs. Hardness ratio plot

T90                                   = 45.5440000295639 sec.
Hardness ratio (energy fluence ratio) = 1.43852
Color vs. Color plot
Count Ratio  (25-50 keV) / (15-25 keV) = 1.78595
Count Ratio (50-100 keV) / (15-25 keV) = 1.26697
Mask shadow pattern

IMX = -9.569325277133812E-02, IMY = 3.351070581421199E-02
TIME vs. PHA plot around the trigger time

Blue+Cyan dotted lines: Time interval of the scaled map
From 0.000000 to 12.160000
TIME vs. DetID plot around the trigger time

Blue+Cyan dotted lines: Time interval of the scaled map
From 0.000000 to 12.160000
100 us light curve (15-350 keV)

Blue+Cyan dotted lines: Time interval of the scaled map
From 0.000000 to 12.160000
Spacecraft aspect plot

Bright source in the pre-burst/pre-slew/post-slew images
Pre-burst image of 15-350 keV band
Time interval of the image:
-239.768000 -0.996000

# RAcent  DECcent POSerr Theta    Phi  PeakCts   SNR AngSep     Name
#  [deg]    [deg]    ['] [deg]  [deg]                   [']
135.5310 -40.6054   12.7  20.4    8.2   0.1486   0.9    3.0	Vela X-1
170.1748 -60.6498    2.4  42.5  -31.0   1.3818   4.8    4.4	Cen X-3
186.4800 -62.9650    4.3  49.5  -36.4  -1.5553  -2.7   12.6	GX 301-2
122.6817   1.5330    2.6  32.1  120.9   1.2905   4.5 ------	UNKNOWN
154.1886  14.1064    2.4  37.1 -178.5   1.1148   4.8 ------	UNKNOWN
188.2839 -10.2390    2.6  42.9 -111.9   3.4095   4.5 ------	UNKNOWN
Pre-slew background subtracted image of 15-350 keV band
Time interval of the image:
-0.996000 48.800000

# RAcent  DECcent POSerr Theta    Phi  PeakCts   SNR AngSep     Name
#  [deg]    [deg]    ['] [deg]  [deg]                   [']
135.3142 -40.6575    4.6  20.5    8.6  -0.1751  -2.5   11.5	Vela X-1
170.0698 -60.5919    7.9  42.4  -31.0  -0.1692  -1.5    7.5	Cen X-3
186.6114 -62.8285   52.4  49.5  -36.6  -0.0477  -0.2    3.7	GX 301-2
 94.2713 -41.6725    2.7  46.7   39.6   1.0421   4.2 ------	UNKNOWN
148.3921 -17.0291    1.5   5.8 -160.7   0.5151   7.8 ------	UNKNOWN
Post-slew image of 15-350 keV band
Time interval of the image:
89.132600 275.732590

# RAcent  DECcent POSerr Theta    Phi  PeakCts   SNR AngSep     Name
#  [deg]    [deg]    ['] [deg]  [deg]                   [']
135.6863 -40.6372    7.1  26.0   13.7   0.2381   1.6    8.7	Vela X-1
170.1882 -60.6652    7.4  46.3  -23.3   0.4049   1.5    4.5	Cen X-3
186.4228 -62.7890    3.3  52.7  -29.4   1.5615   3.5    6.5	GX 301-2
121.3267   8.0997    2.7  36.8  122.4   1.3352   4.2 ------	UNKNOWN
106.3617 -37.8778    3.2  42.2   43.2   1.4037   3.6 ------	UNKNOWN
168.2571 -54.9632    2.5  40.8  -26.0   0.9528   4.7 ------	UNKNOWN
194.1406 -43.5874    2.5  46.7  -54.1   3.0341   4.7 ------	UNKNOWN
Plot creation:
Sun May 31 11:33:50 EDT 2015