Click here for the BAT GCN circular template
Image
Pre-slew 15.0-350.0 keV image (Event data)
#   RAcent    DECcent   POSerr    Theta     Phi              Peak Cts       SNR   Name
  332.0882   -74.5734   0.0082    38.1198   -34.5089         0.4478653     23.349 TRIG_00241840

Foreground time interval of the image:
  0.000   0.852 (delta_t =   0.852 [sec])
Background time interval of the image:
-239.428   0.000 (delta_t = 239.428 [sec])
Lightcurves
Notes:
- 1) The mask-weighted light curves are using the flight position.
- 2) Multiple plots of different time binning/intervals are shown to cover all scenarios of short/long GRBs, rate/image triggers, and real/false positives.
- 3) For all the mask-weighted lightcurves, the y-axis units are counts/sec/det where a det is 0.4 x 0.4 = 0.16 sq cm.
- 4) The verticle lines correspond to following: green dotted lines are T50 interval, black dotted lines are T90 interval, blue solid line(s) is a spacecraft slew start time, and orange solid line(s) is a spacecraft slew end time.
- 5) Time of each bin is in the middle of the bin.
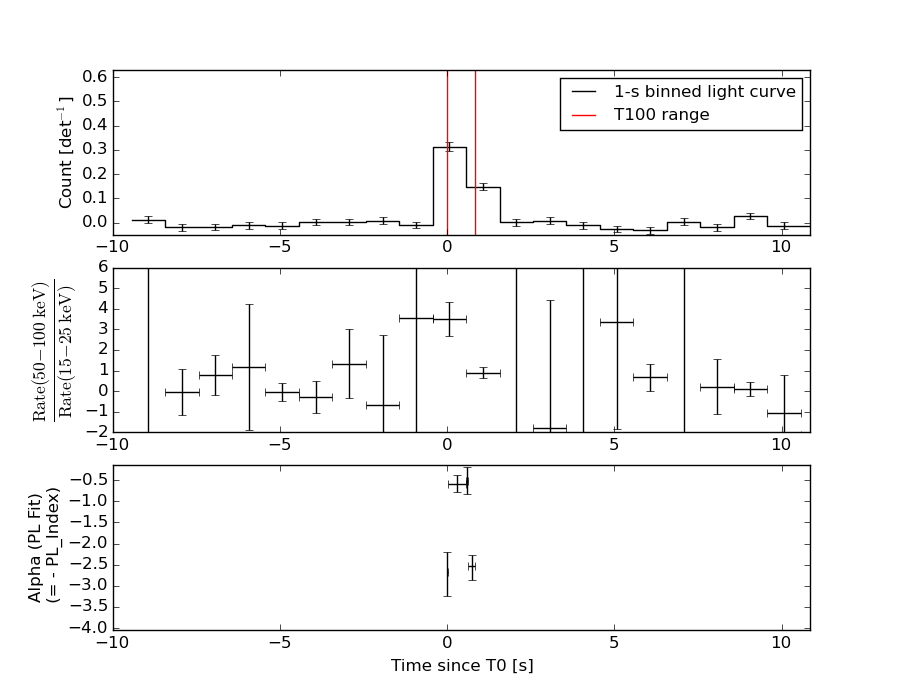
1 s binning
From T0-310 s to T0+310 s
From T100_start - 20 s to T100_end + 30 s
Full time interval
64 ms binning
Full time interval
From T100_start to T100_end
From T0-5 sec to T0+5 sec
16 ms binning
From T100_start-5 s to T100_start+5 s
Blue+Cyan dotted lines: Time interval of the scaled map
From 0.000000 to 0.064000
8 ms binning
From T100_start-3 s to T100_start+3 s
Blue+Cyan dotted lines: Time interval of the scaled map
From 0.000000 to 0.064000
2 ms binning
From T100_start-1 s to T100_start+1 s
Blue+Cyan dotted lines: Time interval of the scaled map
From 0.000000 to 0.064000
SN=5 or 10 sec. binning (whichever binning is satisfied first)
SN=5 or 10 sec. binning (T < 200 sec)
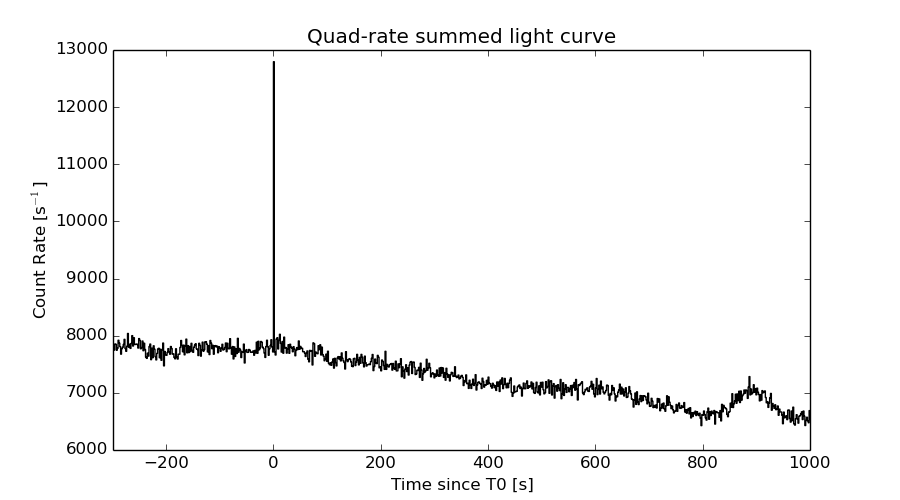
Quad-rate summed light curves (from T0-300s to T0+1000s)
Spectral Evolution
Spectra
Notes:
- 1) The fitting includes the systematic errors.
- 2) When the burst includes telescope slew time periods, the fitting uses an average response file made from multiple 5-s response files through out the slew time plus single time preiod for the non-slew times, and weighted by the total counts in the corresponding time period using addrmf. An average response file is needed becuase a spectral fit using the pre-slew DRM will introduce some errors in both a spectral shape and a normalization if the PHA file contains a lot of the slew/post-slew time interval.
- 3) For fits to more complicated models (e.g. a power-law over a cutoff power-law), the BAT team has decided to require a chi-square improvement of more than 6 for each extra dof.
Time averaged spectrum fit using the average DRM
Power-law model

Time interval is from    0.000 sec. to    0.852 sec.

Spectral model in power-law:
------------------------------------------------------------
Parameters  : value       lower 90%   higher 90%
Photon index: 0.795758     ( -0.144523   0.140615 )
Norm@50keV  : 3.41811E-02    ( -0.0027168   0.00268913 )
------------------------------------------------------------
#Fit statistic : Chi-Squared =          50.99 using 59 PHA bins.
# Reduced chi-squared =         0.8946 for     57 degrees of freedom
# Null hypothesis probability =   6.986248e-01

Photon flux (15-150 keV)    in 0.852 sec: 3.92910 ( -0.303482  0.30455 ) ph/cm2/s
Energy fluence (15-150 keV)             : 3.40929e-07 ( -2.767e-08  2.78299e-08 ) ergs/cm2
Cutoff power-law model

Time interval is from    0.000 sec. to    0.852 sec.
Spectral model in the cutoff power-law:
------------------------------------------------------------
Parameters  : value       lower 90%   higher 90%
Photon index: 0.788236     ( -0.33257   0.214933 )
Epeak [keV] : 9999.14      (   )
Norm@50keV  : 3.44243E-02    ( -0.00268549   0.0132697 )
------------------------------------------------------------
#Fit statistic : Chi-Squared =          51.03 using 59 PHA bins.
# Reduced chi-squared =         0.9112 for     56 degrees of freedom
# Null hypothesis probability =   6.630449e-01

Photon flux (15-150 keV)    in 0.852 sec: 3.93087 ( -0.30598  0.30155 ) ph/cm2/s
Energy fluence (15-150 keV)             : 3.40377e-07 ( -2.7097e-08  2.81714e-08 ) ergs/cm2
Band function

Time interval is from    0.000 sec. to    0.852 sec.

Spectral model in the Band function:
------------------------------------------------------------
Parameters  : value       lower 90%   higher 90%
alpha       : -0.848189   ( 0.848189   0.848189 )
beta        : -0.795757    ( -0.140525   0.144781 )
Epeak [keV] : 14.7538      ( -14.7538 -14.7538 )
Norm@50keV   : 5.01565E-02    ( -0.018608   0 )
------------------------------------------------------------
#Fit statistic : Chi-Squared =          50.99 using 59 PHA bins.
# Reduced chi-squared =         0.9272 for     55 degrees of freedom
# Null hypothesis probability =   6.283769e-01

Photon flux (15-150 keV)    in 0.852 sec:  (    ) ph/cm2/s
Energy fluence (15-150 keV)             : 0 ( 0  0 ) ergs/cm2
Single BB
Spectral model blackbody:
------------------------------------------------------------
Parameters  : value    Lower 90%  Upper 90%
kT [keV]    : 27.8332  (-3.15753  3.81974)
R^2/D10^2   : 7.21829E-02  (-0.0221811   0.0304141)
(R is the radius in km and D10 is the distance to the source in units of 10 kpc)
------------------------------------------------------------
#Fit statistic : Chi-Squared =          83.88 using 59 PHA bins.
# Reduced chi-squared =          1.472 for     57 degrees of freedom
# Null hypothesis probability =   1.177296e-02

Energy  Fluence     90% Error
[keV]   [erg/cm2]   [erg/cm2]
15- 25  7.796e-09   1.242e-09
25- 50  4.656e-08   5.998e-09
50-150  2.614e-07   3.037e-08
15-150  3.157e-07   3.229e-08
Thermal bremsstrahlung (OTTB)
Spectral model: thermal bremsstrahlung
------------------------------------------------------------
Parameters  : value         Lower 90%    Upper 90%
kT [keV]    : 199.363       (      )
Norm        : 15.4816       (     )
------------------------------------------------------------
#Fit statistic : Chi-Squared =         129.51 using 59 PHA bins.
# Reduced chi-squared =         2.2722 for     57 degrees of freedom
# Null hypothesis probability =   1.447153e-07

Energy  Fluence     90% Error
[keV]   [erg/cm2]   [erg/cm2]
15- 25  3.285e-08   3.591e-09
25- 50  6.318e-08   1.102e-08
50-150  1.386e-07   5.353e-08
15-150  2.346e-07   7.728e-08
Double BB
Spectral model: bbodyrad<1> + bbodyrad<2>
------------------------------------------------------------
Parameters  : value         Lower 90%    Upper 90%
kT1 [keV]   : 8.06847        (-2.55091      3.24658)
R1^2/D10^2  : 1.60061        (-1.01645      4.43599)
kT2 [keV]   : 43.1616        (-9.49898      22.9156)
R2^2/D10^2  : 1.90009E-02    (-0.012527   0.0115421)
------------------------------------------------------------
#Fit statistic : Chi-Squared =          50.76 using 59 PHA bins.
# Reduced chi-squared =         0.9230 for     55 degrees of freedom
# Null hypothesis probability =   6.371355e-01

Energy  Fluence     90% Error
[keV]   [erg/cm2]   [erg/cm2]
15- 25  1.984e-08   9.591e-09
25- 50  5.435e-08   1.969e-08
50-150  2.761e-07   1.011e-07
15-150  3.503e-07   1.133e-07
Peak spectrum fit
Power-law model

Time interval is from   -0.074 sec. to    0.926 sec.

Spectral model in power-law:
------------------------------------------------------------
Parameters  : value       lower 90%   higher 90%
Photon index: 0.832446     ( -0.14335   0.139562 )
Norm@50keV  : 3.07791E-02    ( -0.00240658   0.00238361 )
------------------------------------------------------------
#Fit statistic : Chi-Squared =          53.93 using 59 PHA bins.
# Reduced chi-squared =         0.9461 for     57 degrees of freedom
# Null hypothesis probability =   5.911627e-01

Photon flux (15-150 keV)    in 1 sec: 3.53426 ( -0.270983  0.272045 ) ph/cm2/s
Energy fluence (15-150 keV)             : 3.54868e-07 ( -2.84159e-08  2.85806e-08 ) ergs/cm2
Cutoff power-law model
Time interval is from   -0.074 sec. to    0.926 sec.
Spectral model in the cutoff power-law:
------------------------------------------------------------
Parameters  : value       lower 90%   higher 90%
Photon index: 0.825201     ( -0.302724   0.213933 )
Epeak [keV] : 9999.16      (   )
Norm@50keV  : 3.09909E-02    ( -0.00237578   0.01059 )
------------------------------------------------------------
#Fit statistic : Chi-Squared =          53.97 using 59 PHA bins.
# Reduced chi-squared =         0.9637 for     56 degrees of freedom
# Null hypothesis probability =   5.521925e-01

Photon flux (15-150 keV)    in 1 sec: 3.53375 ( -0.27187  0.27101 ) ph/cm2/s
Energy fluence (15-150 keV)             : 3.54084e-07 ( -2.7677e-08  2.9234e-08 ) ergs/cm2
Band function

Time interval is from   -0.074 sec. to    0.926 sec.

Spectral model in the Band function:
------------------------------------------------------------
Parameters  : value       lower 90%   higher 90%
alpha       : -0.790713   ( 0.790741   0.790741 )
beta        : -0.832446    ( -0.13951   0.143504 )
Epeak [keV] : 18.1571      ( -18.1556 -18.1556 )
Norm@50keV   : 4.26908E-02    ( -0.0116544   0 )
------------------------------------------------------------
#Fit statistic : Chi-Squared =          53.93 using 59 PHA bins.
# Reduced chi-squared =         0.9805 for     55 degrees of freedom
# Null hypothesis probability =   5.157199e-01

Photon flux (15-150 keV)    in 1 sec:  (    ) ph/cm2/s
Energy fluence (15-150 keV)             : 0 ( 0  0 ) ergs/cm2
Single BB
Spectral model blackbody:
------------------------------------------------------------
Parameters  : value    Lower 90%  Upper 90%
kT [keV]    : 27.3629  (-3.08515  3.71451)
R^2/D10^2   : 6.73097E-02  (-0.0206879   0.0284663)
(R is the radius in km and D10 is the distance to the source in units of 10 kpc)
------------------------------------------------------------
#Fit statistic : Chi-Squared =          90.30 using 59 PHA bins.
# Reduced chi-squared =          1.584 for     57 degrees of freedom
# Null hypothesis probability =   3.267304e-03

Energy  Fluence     90% Error
[keV]   [erg/cm2]   [erg/cm2]
15- 25  8.328e-09   1.367e-09
25- 50  4.936e-08   6.555e-09
50-150  2.690e-07   3.250e-08
15-150  3.267e-07   3.445e-08
Thermal bremsstrahlung (OTTB)
Spectral model: thermal bremsstrahlung
------------------------------------------------------------
Parameters  : value         Lower 90%    Upper 90%
kT [keV]    : 199.363       (      )
Norm        : 14.1234       (     )
------------------------------------------------------------
#Fit statistic : Chi-Squared =         127.48 using 59 PHA bins.
# Reduced chi-squared =         2.2364 for     57 degrees of freedom
# Null hypothesis probability =   2.618581e-07

Energy  Fluence     90% Error
[keV]   [erg/cm2]   [erg/cm2]
15- 25  3.517e-08   3.655e-09
25- 50  6.765e-08   1.170e-08
50-150  1.484e-07   5.212e-08
15-150  2.512e-07   9.524e-08
Double BB
Spectral model: bbodyrad<1> + bbodyrad<2>
------------------------------------------------------------
Parameters  : value         Lower 90%    Upper 90%
kT1 [keV]   : 7.87770        (-2.27911      2.93543)
R1^2/D10^2  : 1.64783        (-1.03208      3.28913)
kT2 [keV]   : 42.8867        (-9.22009      21.0044)
R2^2/D10^2  : 1.70468E-02    (-0.0108518   0.0169085)
------------------------------------------------------------
#Fit statistic : Chi-Squared =          53.18 using 59 PHA bins.
# Reduced chi-squared =         0.9669 for     55 degrees of freedom
# Null hypothesis probability =   5.445693e-01

Energy  Fluence     90% Error
[keV]   [erg/cm2]   [erg/cm2]
15- 25  2.212e-08   9.562e-09
25- 50  5.789e-08   1.790e-08
50-150  2.856e-07   1.038e-07
15-150  3.656e-07   9.875e-08
Pre-slew spectrum (Pre-slew PHA with pre-slew DRM)
Power-law model

Spectral model in power-law:
------------------------------------------------------------
Parameters  : value       lower 90%   higher 90%
Photon index: 0.795758     ( -0.144523   0.140615 )
Norm@50keV  : 3.41811E-02    ( -0.0027168   0.00268913 )
------------------------------------------------------------
#Fit statistic : Chi-Squared =          50.99 using 59 PHA bins.
# Reduced chi-squared =         0.8946 for     57 degrees of freedom
# Null hypothesis probability =   6.986248e-01

Photon flux (15-150 keV)    in 0.852 sec: 3.92910 ( -0.303482  0.30455 ) ph/cm2/s
Energy fluence (15-150 keV)             : 3.40929e-07 ( -2.767e-08  2.78299e-08 ) ergs/cm2
Cutoff power-law model
Spectral model in the cutoff power-law:
------------------------------------------------------------
Parameters  : value       lower 90%   higher 90%
Photon index: 0.788236     ( -0.33257   0.214933 )
Epeak [keV] : 9999.14      (   )
Norm@50keV  : 3.44243E-02    ( -0.00268549   0.0132697 )
------------------------------------------------------------
#Fit statistic : Chi-Squared =          51.03 using 59 PHA bins.
# Reduced chi-squared =         0.9112 for     56 degrees of freedom
# Null hypothesis probability =   6.630449e-01

Photon flux (15-150 keV)    in 0.852 sec: 3.93087 ( -0.30598  0.30155 ) ph/cm2/s
Energy fluence (15-150 keV)             : 3.40377e-07 ( -2.7097e-08  2.81714e-08 ) ergs/cm2
Band function

Spectral model in the Band function:
------------------------------------------------------------
Parameters  : value       lower 90%   higher 90%
alpha       : -0.848189   ( 0.848189   0.848189 )
beta        : -0.795757    ( -0.140525   0.144781 )
Epeak [keV] : 14.7538      ( -14.7538 -14.7538 )
Norm@50keV   : 5.01565E-02    ( -0.0192846   0 )
------------------------------------------------------------
#Fit statistic : Chi-Squared =          50.99 using 59 PHA bins.
# Reduced chi-squared =         0.9272 for     55 degrees of freedom
# Null hypothesis probability =   6.283769e-01

Photon flux (15-150 keV)    in 0.852 sec:  (    ) ph/cm2/s
Energy fluence (15-150 keV)             : 0 ( 0  0 ) ergs/cm2
S(25-50 keV) vs. S(50-100 keV) plot
S(25-50 keV)  = 5.48e-08
S(50-100 keV) = 1.26e-07
T90 vs. Hardness ratio plot
T90                                   = 0.776000022888184 sec.
Hardness ratio (energy fluence ratio) = 2.29927
Color vs. Color plot
Count Ratio  (25-50 keV) / (15-25 keV) = 1.81465
Count Ratio (50-100 keV) / (15-25 keV) = 2.48591
Mask shadow pattern
IMX = 6.465881737374078E-01, IMY = 4.445348528654993E-01
TIME vs. PHA plot around the trigger time
Blue+Cyan dotted lines: Time interval of the scaled map
From 0.000000 to 0.064000
TIME vs. DetID plot around the trigger time
Blue+Cyan dotted lines: Time interval of the scaled map
From 0.000000 to 0.064000
100 us light curve (15-350 keV)
Blue+Cyan dotted lines: Time interval of the scaled map
From 0.000000 to 0.064000
Spacecraft aspect plot

Bright source in the pre-burst/pre-slew/post-slew images
Pre-burst image of 15-350 keV band
Time interval of the image:
-239.428000 0.000000

# RAcent  DECcent POSerr Theta    Phi  PeakCts   SNR AngSep     Name
#  [deg]    [deg]    ['] [deg]  [deg]                   [']
135.5316 -40.5570    1.1  32.3 -169.2   1.8874  10.4    0.2	Vela X-1
170.2901 -60.6358    2.2  33.7 -114.1   1.6266   5.3    1.1	Cen X-3
186.6361 -62.7757    0.8  38.4 -103.0   9.0139  14.4    0.7	GX 301-2
 63.9656 -39.0122    3.5  30.1   70.5   0.8590   3.3 ------	UNKNOWN
124.0228 -15.5841    2.7  51.0  160.8   2.5039   4.3 ------	UNKNOWN
128.7407 -15.2960    2.9  52.6  166.2   2.7706   4.0 ------	UNKNOWN
145.2088 -15.5872    3.0  58.3 -175.7   4.3765   3.9 ------	UNKNOWN
153.3743 -18.4823    3.7  59.1 -166.0   3.8609   3.1 ------	UNKNOWN
Pre-slew background subtracted image of 15-350 keV band
Time interval of the image:
0.000000 0.852000

# RAcent  DECcent POSerr Theta    Phi  PeakCts   SNR AngSep     Name
#  [deg]    [deg]    ['] [deg]  [deg]                   [']
135.5795 -40.5808    3.6  32.3 -169.1   0.0459   3.2    2.8	Vela X-1
170.3100 -60.5191    6.7  33.8 -114.2  -0.0406  -1.7    6.2	Cen X-3
186.6645 -62.6365    5.2  38.5 -103.2  -0.0886  -2.2    8.0	GX 301-2
332.0882 -74.5734    0.5  38.1  -34.5   0.4478  23.4 ------	UNKNOWN
Post-slew image of 15-350 keV band
Time interval of the image:
65.272610 731.772590

# RAcent  DECcent POSerr Theta    Phi  PeakCts   SNR AngSep     Name
#  [deg]    [deg]    ['] [deg]  [deg]                   [']
170.2266 -60.6007    2.2  44.3 -166.6   3.0927   5.2    2.9	Cen X-3
186.6535 -62.7718    0.4  40.8 -155.8  17.7574  25.5    0.1	GX 301-2
 59.0871 -56.5690    3.1  35.7  110.2   3.1384   3.7 ------	UNKNOWN
 14.3065 -41.8278    4.4  37.9   55.5   2.3048   2.6 ------	UNKNOWN
351.3826 -31.5232    2.9  44.1   24.6   3.2574   4.0 ------	UNKNOWN
341.9726 -35.0396    2.8  39.8   13.5   2.2235   4.2 ------	UNKNOWN
338.4603 -35.4507    2.8  39.3    9.0   2.1655   4.2 ------	UNKNOWN
153.4392 -58.4657    2.5  46.9 -178.3   2.9112   4.6 ------	UNKNOWN
277.1551 -58.1842    2.6  25.9  -80.5   2.0880   4.4 ------	UNKNOWN
194.4511 -46.9262    5.2  55.2 -145.2   4.9440   2.2 ------	UNKNOWN
Plot creation:
Sun May 31 11:19:31 EDT 2015