Special notes of this burst
Image
Pre-slew 15.0-350.0 keV image (Event data)
#   RAcent    DECcent   POSerr    Theta     Phi              Peak Cts       SNR   Name
  144.5226    15.6178   0.0215    37.5834   140.3810         1.6839807      8.909 TRIG_00243690

Foreground time interval of the image:
 -0.004  89.392 (delta_t =  89.396 [sec])
Background time interval of the image:
-135.675  -0.004 (delta_t = 135.671 [sec])
Lightcurves
Notes:
- 1) The mask-weighted light curves are using the flight position.
- 2) Multiple plots of different time binning/intervals are shown to cover all scenarios of short/long GRBs, rate/image triggers, and real/false positives.
- 3) For all the mask-weighted lightcurves, the y-axis units are counts/sec/det where a det is 0.4 x 0.4 = 0.16 sq cm.
- 4) The verticle lines correspond to following: green dotted lines are T50 interval, black dotted lines are T90 interval, blue solid line(s) is a spacecraft slew start time, and orange solid line(s) is a spacecraft slew end time.
- 5) Time of each bin is in the middle of the bin.
1 s binning
From T0-310 s to T0+310 s
From T100_start - 20 s to T100_end + 30 s

Full time interval

64 ms binning
Full time interval

From T100_start to T100_end

From T0-5 sec to T0+5 sec
16 ms binning
From T100_start-5 s to T100_start+5 s
Blue+Cyan dotted lines: Time interval of the scaled map
From 0.000000 to 0.032000
8 ms binning
From T100_start-3 s to T100_start+3 s
Blue+Cyan dotted lines: Time interval of the scaled map
From 0.000000 to 0.032000
2 ms binning
From T100_start-1 s to T100_start+1 s

Blue+Cyan dotted lines: Time interval of the scaled map
From 0.000000 to 0.032000
SN=5 or 10 sec. binning (whichever binning is satisfied first)
SN=5 or 10 sec. binning (T < 200 sec)

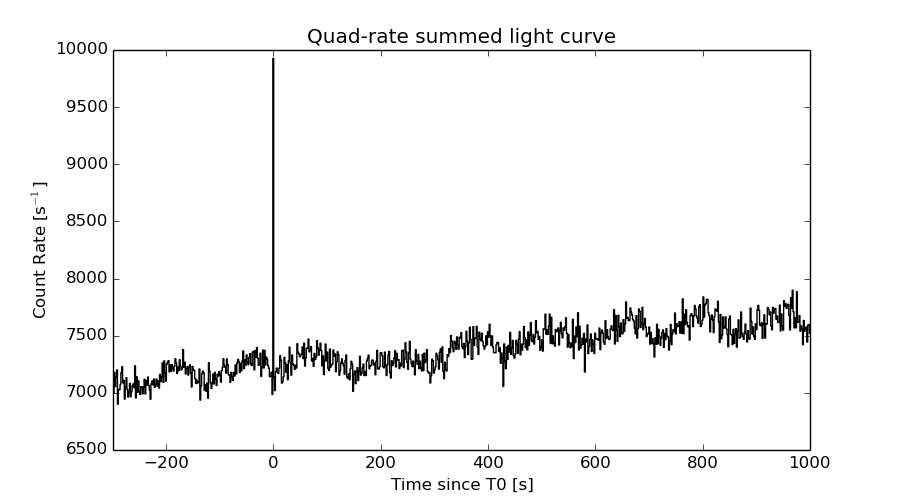
Quad-rate summed light curves (from T0-300s to T0+1000s)
Spectral Evolution

Spectra
Notes:
- 1) The fitting includes the systematic errors.
- 2) When the burst includes telescope slew time periods, the fitting uses an average response file made from multiple 5-s response files through out the slew time plus single time preiod for the non-slew times, and weighted by the total counts in the corresponding time period using addrmf. An average response file is needed becuase a spectral fit using the pre-slew DRM will introduce some errors in both a spectral shape and a normalization if the PHA file contains a lot of the slew/post-slew time interval.
- 3) For fits to more complicated models (e.g. a power-law over a cutoff power-law), the BAT team has decided to require a chi-square improvement of more than 6 for each extra dof.
Time averaged spectrum fit using the average DRM
Power-law model

Time interval is from   -0.004 sec. to   89.392 sec.

Spectral model in power-law:
------------------------------------------------------------
Parameters  : value       lower 90%   higher 90%
Photon index: 1.54703     ( -0.27099   0.274337 )
Norm@50keV  : 1.29511E-03    ( -0.000193833   0.000191599 )
------------------------------------------------------------
#Fit statistic : Chi-Squared =          65.39 using 59 PHA bins.
# Reduced chi-squared =          1.147 for     57 degrees of freedom
# Null hypothesis probability =   2.085161e-01

Photon flux (15-150 keV)    in 89.4 sec: 0.163812 ( -0.0244633  0.0245678 ) ph/cm2/s
Energy fluence (15-150 keV)             : 1.09045e-06 ( -1.76205e-07  1.7798e-07 ) ergs/cm2
Cutoff power-law model
Time interval is from   -0.004 sec. to   89.392 sec.
Spectral model in the cutoff power-law:
------------------------------------------------------------
Parameters  : value       lower 90%   higher 90%
Photon index: 1.55947     ( -0.284723   0.264937 )
Epeak [keV] : 9999.36      ( -9999.36 -9999.36 )
Norm@50keV  : 1.28945E-03    ( -0.000191519   0.00104192 )
------------------------------------------------------------
#Fit statistic : Chi-Squared =          65.40 using 59 PHA bins.
# Reduced chi-squared =          1.168 for     56 degrees of freedom
# Null hypothesis probability =   1.825970e-01

Photon flux (15-150 keV)    in 89.4 sec: 0.164524 ( -0.02528  0.023938 ) ph/cm2/s
Energy fluence (15-150 keV)             : 1.0888e-06 ( -1.74375e-07  1.76029e-07 ) ergs/cm2
Band function

Time interval is from   -0.004 sec. to   89.392 sec.

Spectral model in the Band function:
------------------------------------------------------------
Parameters  : value       lower 90%   higher 90%
alpha       : -1.34420   ( 1.3442   1.3442 )
beta        : -1.54700    ( -0.273675   0.271668 )
Epeak [keV] : 8.32733      ( -8.3282 -8.3282 )
Norm@50keV   : 2.89478E-03    ( -0.00178652   0.199169 )
------------------------------------------------------------
#Fit statistic : Chi-Squared =          65.39 using 59 PHA bins.
# Reduced chi-squared =          1.189 for     55 degrees of freedom
# Null hypothesis probability =   1.594787e-01

Photon flux (15-150 keV)    in 89.4 sec:  (    ) ph/cm2/s
Energy fluence (15-150 keV)             : 0 ( 0  0 ) ergs/cm2
Single BB
Spectral model blackbody:
------------------------------------------------------------
Parameters  : value    Lower 90%  Upper 90%
kT [keV]    : 15.7216  (-3.73584  5.06979)
R^2/D10^2   : 1.47371E-02  (-0.0144913   0.0235548)
(R is the radius in km and D10 is the distance to the source in units of 10 kpc)
------------------------------------------------------------
#Fit statistic : Chi-Squared =          88.36 using 59 PHA bins.
# Reduced chi-squared =          1.550 for     57 degrees of freedom
# Null hypothesis probability =   4.878222e-03

Energy  Fluence     90% Error
[keV]   [erg/cm2]   [erg/cm2]
15- 25  6.759e-08   2.116e-08
25- 50  2.801e-07   8.261e-08
50-150  4.806e-07   1.552e-07
15-150  8.283e-07   1.981e-07
Thermal bremsstrahlung (OTTB)
Spectral model: thermal bremsstrahlung
------------------------------------------------------------
Parameters  : value         Lower 90%    Upper 90%
kT [keV]    : 199.363       (-89.1663      -199.363)
Norm        : 0.664013       (-0.096167     0.0961941)
------------------------------------------------------------
#Fit statistic : Chi-Squared =          66.88 using 59 PHA bins.
# Reduced chi-squared =          1.173 for     57 degrees of freedom
# Null hypothesis probability =   1.741179e-01

Energy  Fluence     90% Error
[keV]   [erg/cm2]   [erg/cm2]
15- 25  1.478e-07   8.457e-08
25- 50  2.844e-07   1.582e-07
50-150  6.236e-07   3.492e-07
15-150  1.056e-06   5.941e-07
Double BB
Spectral model: bbodyrad<1> + bbodyrad<2>
------------------------------------------------------------
Parameters  : value         Lower 90%    Upper 90%
kT1 [keV]   : 6.17515        (-2.06813      2.47046)
R1^2/D10^2  : 0.323182        (-0.230571      0.746866)
kT2 [keV]   : 33.1890        (-10.8391      33.3849)
R2^2/D10^2  : 1.02688E-03    (-0.000863475   0.0027554)
------------------------------------------------------------
#Fit statistic : Chi-Squared =          64.21 using 59 PHA bins.
# Reduced chi-squared =          1.167 for     55 degrees of freedom
# Null hypothesis probability =   1.850663e-01

Energy  Fluence     90% Error
[keV]   [erg/cm2]   [erg/cm2]
15- 25  1.672e-07   9.624e-08
25- 50  2.569e-07   1.215e-07
50-150  7.236e-07   3.960e-07
15-150  1.148e-06   5.495e-07
Peak spectrum fit
Power-law model

Time interval is from   -0.230 sec. to    0.770 sec.

Spectral model in power-law:
------------------------------------------------------------
Parameters  : value       lower 90%   higher 90%
Photon index: 0.756516     ( -0.185773   0.177088 )
Norm@50keV  : 2.43909E-02    ( -0.00266678   0.00262067 )
------------------------------------------------------------
#Fit statistic : Chi-Squared =          49.29 using 59 PHA bins.
# Reduced chi-squared =         0.8647 for     57 degrees of freedom
# Null hypothesis probability =   7.563158e-01

Photon flux (15-150 keV)    in 1 sec: 2.80877 ( -0.292999  0.294046 ) ph/cm2/s
Energy fluence (15-150 keV)             : 2.90371e-07 ( -3.00725e-08  3.01418e-08 ) ergs/cm2
Cutoff power-law model

Time interval is from   -0.230 sec. to    0.770 sec.
Spectral model in the cutoff power-law:
------------------------------------------------------------
Parameters  : value       lower 90%   higher 90%
Photon index: 0.478133     ( -0.833967   0.358612 )
Epeak [keV] : 346.189      ( -346.187 -346.187 )
Norm@50keV  : 3.15564E-02    ( -0.0093266   0.0337221 )
------------------------------------------------------------
#Fit statistic : Chi-Squared =          48.86 using 59 PHA bins.
# Reduced chi-squared =         0.8724 for     56 degrees of freedom
# Null hypothesis probability =   7.396927e-01

Photon flux (15-150 keV)    in 1 sec: 2.78152 ( -0.30084  0.30164 ) ph/cm2/s
Energy fluence (15-150 keV)             : 2.88784e-07 ( -3.0911e-08  3.0673e-08 ) ergs/cm2
Band function
Time interval is from   -0.230 sec. to    0.770 sec.

Spectral model in the Band function:
------------------------------------------------------------
Parameters  : value       lower 90%   higher 90%
alpha       : -0.851729   ( 0.851729   0.851729 )
beta        : -0.756516    ( -0.177091   0.186001 )
Epeak [keV] : 18.9043      ( -18.9043 -18.9043 )
Norm@50keV   : 3.28703E-02    ( -0.0110163   0 )
------------------------------------------------------------
#Fit statistic : Chi-Squared =          49.29 using 59 PHA bins.
# Reduced chi-squared =         0.8961 for     55 degrees of freedom
# Null hypothesis probability =   6.916494e-01

Photon flux (15-150 keV)    in 1 sec:  (    ) ph/cm2/s
Energy fluence (15-150 keV)             : 0 ( 0  0 ) ergs/cm2
Single BB

Spectral model blackbody:
------------------------------------------------------------
Parameters  : value    Lower 90%  Upper 90%
kT [keV]    : 27.4738  (-3.65562  4.70543)
R^2/D10^2   : 5.48646E-02  (-0.0202795   0.0294108)
(R is the radius in km and D10 is the distance to the source in units of 10 kpc)
------------------------------------------------------------
#Fit statistic : Chi-Squared =          58.81 using 59 PHA bins.
# Reduced chi-squared =          1.032 for     57 degrees of freedom
# Null hypothesis probability =   4.090226e-01

Energy  Fluence     90% Error
[keV]   [erg/cm2]   [erg/cm2]
15- 25  6.828e-09   1.453e-09
25- 50  4.054e-08   7.225e-09
50-150  2.225e-07   3.370e-08
15-150  2.699e-07   3.730e-08
Thermal bremsstrahlung (OTTB)
Spectral model: thermal bremsstrahlung
------------------------------------------------------------
Parameters  : value         Lower 90%    Upper 90%
kT [keV]    : 200.000       (      )
Norm        : 11.1770       (-1.22417     1.22409)
------------------------------------------------------------
#Fit statistic : Chi-Squared =         103.55 using 59 PHA bins.
# Reduced chi-squared =         1.8167 for     57 degrees of freedom
# Null hypothesis probability =   1.604736e-04

Energy  Fluence     90% Error
[keV]   [erg/cm2]   [erg/cm2]
15- 25  2.784e-08   1.547e-08
25- 50  5.355e-08   2.932e-08
50-150  1.174e-07   6.550e-08
15-150  1.988e-07   1.097e-07
Double BB
Spectral model: bbodyrad<1> + bbodyrad<2>
------------------------------------------------------------
Parameters  : value         Lower 90%    Upper 90%
kT1 [keV]   : 10.0639        (-6.95312      9.27344)
R1^2/D10^2  : 0.472592        (-0.360111      37.6524)
kT2 [keV]   : 40.6443        (-12.8695      -40.772)
R2^2/D10^2  : 1.54867E-02    (-0.0140949   0.0260416)
------------------------------------------------------------
#Fit statistic : Chi-Squared =          49.51 using 59 PHA bins.
# Reduced chi-squared =         0.9002 for     55 degrees of freedom
# Null hypothesis probability =   6.836488e-01

Energy  Fluence     90% Error
[keV]   [erg/cm2]   [erg/cm2]
15- 25  1.303e-08   7.250e-09
25- 50  4.687e-08   2.417e-08
50-150  2.310e-07   1.218e-07
15-150  2.909e-07   1.493e-07
Pre-slew spectrum (Pre-slew PHA with pre-slew DRM)
Power-law model
Spectral model in power-law:
------------------------------------------------------------
Parameters  : value       lower 90%   higher 90%
Photon index: 1.54703     ( -0.27099   0.274337 )
Norm@50keV  : 1.29511E-03    ( -0.000193833   0.000191599 )
------------------------------------------------------------
#Fit statistic : Chi-Squared =          65.39 using 59 PHA bins.
# Reduced chi-squared =          1.147 for     57 degrees of freedom
# Null hypothesis probability =   2.085161e-01

Photon flux (15-150 keV)    in 89.4 sec: 0.163812 ( -0.0244633  0.0245678 ) ph/cm2/s
Energy fluence (15-150 keV)             : 1.09045e-06 ( -1.76205e-07  1.7798e-07 ) ergs/cm2
Cutoff power-law model

Spectral model in the cutoff power-law:
------------------------------------------------------------
Parameters  : value       lower 90%   higher 90%
Photon index: 1.55947     ( -0.284723   0.264937 )
Epeak [keV] : 9999.36      ( -9999.36 -9999.36 )
Norm@50keV  : 1.28945E-03    ( -0.000191519   0.00104192 )
------------------------------------------------------------
#Fit statistic : Chi-Squared =          65.40 using 59 PHA bins.
# Reduced chi-squared =          1.168 for     56 degrees of freedom
# Null hypothesis probability =   1.825970e-01

Photon flux (15-150 keV)    in 89.4 sec: 0.164524 ( -0.02528  0.023938 ) ph/cm2/s
Energy fluence (15-150 keV)             : 1.0888e-06 ( -1.74375e-07  1.76029e-07 ) ergs/cm2
Band function

Spectral model in the Band function:
------------------------------------------------------------
Parameters  : value       lower 90%   higher 90%
alpha       : -1.34420   ( 1.3442   1.3442 )
beta        : -1.54700    ( -0.273675   0.271668 )
Epeak [keV] : 8.32733      ( -8.3282 -8.3282 )
Norm@50keV   : 2.89478E-03    ( -0.00178652   0.199169 )
------------------------------------------------------------
#Fit statistic : Chi-Squared =          65.39 using 59 PHA bins.
# Reduced chi-squared =          1.189 for     55 degrees of freedom
# Null hypothesis probability =   1.594787e-01

Photon flux (15-150 keV)    in 89.4 sec:  (    ) ph/cm2/s
Energy fluence (15-150 keV)             : 0 ( 0  0 ) ergs/cm2
S(25-50 keV) vs. S(50-100 keV) plot
S(25-50 keV)  = 2.76e-07
S(50-100 keV) = 3.78e-07
T90 vs. Hardness ratio plot
T90                                   = 85.2320000231266 sec.
Hardness ratio (energy fluence ratio) = 1.36957
Color vs. Color plot
Count Ratio  (25-50 keV) / (15-25 keV) = 1.15189
Count Ratio (50-100 keV) / (15-25 keV) = 0.885021
Mask shadow pattern

IMX = -5.928568268590017E-01, IMY = -4.907847498504737E-01
TIME vs. PHA plot around the trigger time
Blue+Cyan dotted lines: Time interval of the scaled map
From 0.000000 to 0.032000
TIME vs. DetID plot around the trigger time
Blue+Cyan dotted lines: Time interval of the scaled map
From 0.000000 to 0.032000
100 us light curve (15-350 keV)
Blue+Cyan dotted lines: Time interval of the scaled map
From 0.000000 to 0.032000
Spacecraft aspect plot
Bright source in the pre-burst/pre-slew/post-slew images
Pre-burst image of 15-350 keV band
Time interval of the image:
-135.675400 -0.004000

# RAcent  DECcent POSerr Theta    Phi  PeakCts   SNR AngSep     Name
#  [deg]    [deg]    ['] [deg]  [deg]                   [']
135.5297 -40.5511    1.0  20.3  -17.1   1.2199  12.0    0.2	Vela X-1
170.4799 -60.7674    0.0  42.6  -56.6   0.6876   1.8    9.9	Cen X-3
Pre-slew background subtracted image of 15-350 keV band
Time interval of the image:
-0.004000 89.392000

# RAcent  DECcent POSerr Theta    Phi  PeakCts   SNR AngSep     Name
#  [deg]    [deg]    ['] [deg]  [deg]                   [']
135.5556 -40.3707    5.4  20.1  -17.0  -0.2055  -2.2   11.1	Vela X-1
169.9086 -60.7053    5.7  42.4  -56.3   0.5537   2.0   12.9	Cen X-3
144.5226  15.6177    1.3  37.6  140.4   1.6824   8.9 ------	UNKNOWN
Post-slew image of 15-350 keV band
Time interval of the image:
Plot creation:
Sun May 31 11:15:51 EDT 2015