Special notes of this burst
Image
Pre-slew 15.0-350.0 keV image (Event data)
#   RAcent    DECcent   POSerr    Theta     Phi              Peak Cts       SNR   Name
  149.2468   -35.2219   0.0445    17.1608     5.5683         0.0817638      4.292 TRIG_00251863

Foreground time interval of the image:
  0.000   4.096 (delta_t =   4.096 [sec])
Background time interval of the image:
-239.456 -19.456 (delta_t = 220.000 [sec])
Lightcurves
Notes:
- 1) The mask-weighted light curves are using the flight position.
- 2) Multiple plots of different time binning/intervals are shown to cover all scenarios of short/long GRBs, rate/image triggers, and real/false positives.
- 3) For all the mask-weighted lightcurves, the y-axis units are counts/sec/det where a det is 0.4 x 0.4 = 0.16 sq cm.
- 4) The verticle lines correspond to following: green dotted lines are T50 interval, black dotted lines are T90 interval, blue solid line(s) is a spacecraft slew start time, and orange solid line(s) is a spacecraft slew end time.
- 5) Time of each bin is in the middle of the bin.
1 s binning
From T0-310 s to T0+310 s
From T100_start - 20 s to T100_end + 30 s

Full time interval
64 ms binning
Full time interval
From T100_start to T100_end

From T0-5 sec to T0+5 sec
16 ms binning
From T100_start-5 s to T100_start+5 s
Blue+Cyan dotted lines: Time interval of the scaled map
From 0.000000 to 4.096000
8 ms binning
From T100_start-3 s to T100_start+3 s
Blue+Cyan dotted lines: Time interval of the scaled map
From 0.000000 to 4.096000
2 ms binning
From T100_start-1 s to T100_start+1 s
Blue+Cyan dotted lines: Time interval of the scaled map
From 0.000000 to 4.096000
SN=5 or 10 sec. binning (whichever binning is satisfied first)
SN=5 or 10 sec. binning (T < 200 sec)
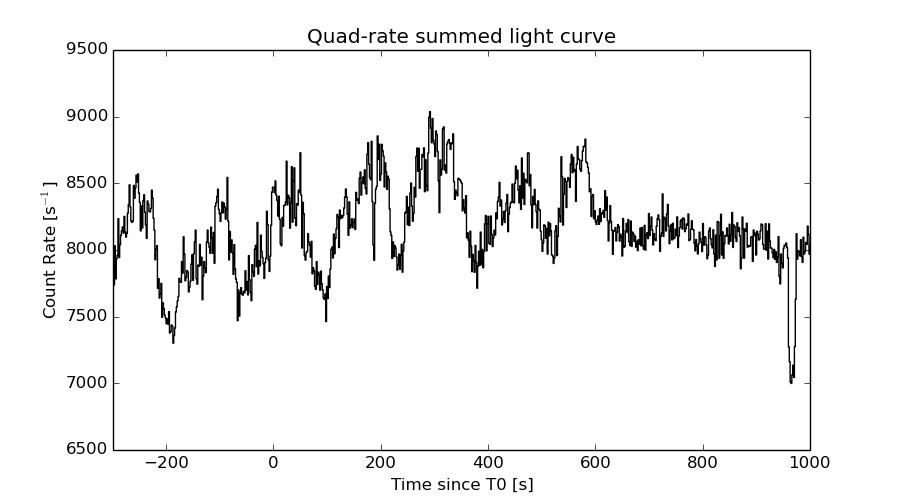
Quad-rate summed light curves (from T0-300s to T0+1000s)
Spectral Evolution

Spectra
Notes:
- 1) The fitting includes the systematic errors.
- 2) When the burst includes telescope slew time periods, the fitting uses an average response file made from multiple 5-s response files through out the slew time plus single time preiod for the non-slew times, and weighted by the total counts in the corresponding time period using addrmf. An average response file is needed becuase a spectral fit using the pre-slew DRM will introduce some errors in both a spectral shape and a normalization if the PHA file contains a lot of the slew/post-slew time interval.
- 3) For fits to more complicated models (e.g. a power-law over a cutoff power-law), the BAT team has decided to require a chi-square improvement of more than 6 for each extra dof.
Time averaged spectrum fit using the average DRM
Power-law model
Time interval is from    0.000 sec. to    4.096 sec.

Spectral model in power-law:
------------------------------------------------------------
Parameters  : value       lower 90%   higher 90%
Photon index: 2.60735     ( -0.51394   0.655933 )
Norm@50keV  : 1.01917E-03    ( -0.000481522   0.000506339 )
------------------------------------------------------------
#Fit statistic : Chi-Squared =          73.73 using 59 PHA bins.
# Reduced chi-squared =          1.294 for     57 degrees of freedom
# Null hypothesis probability =   6.723593e-02

Photon flux (15-150 keV)    in 4.096 sec: 0.214132 ( -0.0588661  0.0590872 ) ph/cm2/s
Energy fluence (15-150 keV)             : 4.30649e-08 ( -1.4638e-08  1.61941e-08 ) ergs/cm2
Cutoff power-law model

Time interval is from    0.000 sec. to    4.096 sec.
Spectral model in the cutoff power-law:
------------------------------------------------------------
Parameters  : value       lower 90%   higher 90%
Photon index: -0.889363     ( -7.81538   2.91018 )
Epeak [keV] : 24.6200      (   )
Norm@50keV  : 0.285980    (     )
------------------------------------------------------------
#Fit statistic : Chi-Squared =          70.60 using 59 PHA bins.
# Reduced chi-squared =          1.261 for     56 degrees of freedom
# Null hypothesis probability =   9.068666e-02

Photon flux (15-150 keV)    in 4.096 sec: 0.211982 ( -0.055931  0.056336 ) ph/cm2/s
Energy fluence (15-150 keV)             : 3.60479e-08 ( -1.0458e-08  1.31188e-08 ) ergs/cm2
Band function

Time interval is from    0.000 sec. to    4.096 sec.

Spectral model in the Band function:
------------------------------------------------------------
Parameters  : value       lower 90%   higher 90%
alpha       : 2.07783   ( -3.03402   -0.816022 )
beta        : -6.12590    ( 8.68084   18.6734 )
Epeak [keV] : 25.3384      ( -8.54658 7.62608 )
Norm@50keV   : 2.06008    ( -2.05985   147.778 )
------------------------------------------------------------
#Fit statistic : Chi-Squared =          70.42 using 59 PHA bins.
# Reduced chi-squared =          1.280 for     55 degrees of freedom
# Null hypothesis probability =   7.870315e-02

Photon flux (15-150 keV)    in 4.096 sec:  (    ) ph/cm2/s
Energy fluence (15-150 keV)             : 3.72195e-08 ( 0  0 ) ergs/cm2
Single BB
Spectral model blackbody:
------------------------------------------------------------
Parameters  : value    Lower 90%  Upper 90%
kT [keV]    : 6.48008  (-1.4129  1.72142)
R^2/D10^2   : 0.614555  (-0.390264   1.11696)
(R is the radius in km and D10 is the distance to the source in units of 10 kpc)
------------------------------------------------------------
#Fit statistic : Chi-Squared =          70.50 using 59 PHA bins.
# Reduced chi-squared =          1.237 for     57 degrees of freedom
# Null hypothesis probability =   1.079741e-01

Energy  Fluence     90% Error
[keV]   [erg/cm2]   [erg/cm2]
15- 25  1.556e-08   8.033e-09
25- 50  1.826e-08   1.137e-08
50-150  2.270e-09   1.834e-09
15-150  3.610e-08   2.187e-08
Thermal bremsstrahlung (OTTB)
Spectral model: thermal bremsstrahlung
------------------------------------------------------------
Parameters  : value         Lower 90%    Upper 90%
kT [keV]    : 25.2925       (-10.6289      21.9437)
Norm        : 2.08198       (-0.900857     1.77198)
------------------------------------------------------------
#Fit statistic : Chi-Squared =          71.79 using 59 PHA bins.
# Reduced chi-squared =          1.259 for     57 degrees of freedom
# Null hypothesis probability =   8.978022e-02

Energy  Fluence     90% Error
[keV]   [erg/cm2]   [erg/cm2]
15- 25  1.574e-08   7.620e-09
25- 50  1.625e-08   8.200e-09
50-150  7.028e-09   5.919e-09
15-150  3.901e-08   1.868e-08
Double BB

Spectral model: bbodyrad<1> + bbodyrad<2>
------------------------------------------------------------
Parameters  : value         Lower 90%    Upper 90%
kT1 [keV]   : 6.49547        (-6.48733      183.645)
R1^2/D10^2  : 0.463143        (-0.463313      -0.463313)
kT2 [keV]   : 6.43818        (-6.47556      -6.47556)
R2^2/D10^2  : 0.150922    (-0.151186   -0.151186)
------------------------------------------------------------
#Fit statistic : Chi-Squared =          70.50 using 59 PHA bins.
# Reduced chi-squared =          1.282 for     55 degrees of freedom
# Null hypothesis probability =   7.780140e-02

Energy  Fluence     90% Error
[keV]   [erg/cm2]   [erg/cm2]
15- 25  1.556e-08   1.006e-01
25- 50  1.827e-08   9.857e-01
50-150  2.274e-09   2.208e+01
15-150  3.610e-08   2.212e+01
Pre-slew spectrum (Pre-slew PHA with pre-slew DRM)
Power-law model

Spectral model in power-law:
------------------------------------------------------------
Parameters  : value       lower 90%   higher 90%
Photon index: 2.60735     ( -0.51394   0.655933 )
Norm@50keV  : 1.01917E-03    ( -0.000481522   0.000506339 )
------------------------------------------------------------
#Fit statistic : Chi-Squared =          73.73 using 59 PHA bins.
# Reduced chi-squared =          1.294 for     57 degrees of freedom
# Null hypothesis probability =   6.723593e-02

Photon flux (15-150 keV)    in 4.096 sec: 0.214132 ( -0.0588661  0.0590872 ) ph/cm2/s
Energy fluence (15-150 keV)             : 4.30649e-08 ( -1.4638e-08  1.61941e-08 ) ergs/cm2
Cutoff power-law model
Spectral model in the cutoff power-law:
------------------------------------------------------------
Parameters  : value       lower 90%   higher 90%
Photon index: -0.889363     ( -7.81538   2.91018 )
Epeak [keV] : 24.6200      (   )
Norm@50keV  : 0.285980    (     )
------------------------------------------------------------
#Fit statistic : Chi-Squared =          70.60 using 59 PHA bins.
# Reduced chi-squared =          1.261 for     56 degrees of freedom
# Null hypothesis probability =   9.068666e-02

Photon flux (15-150 keV)    in 4.096 sec: 0.211982 ( -0.055931  0.056336 ) ph/cm2/s
Energy fluence (15-150 keV)             : 3.60479e-08 ( -1.0458e-08  1.31188e-08 ) ergs/cm2
Band function
Spectral model in the Band function:
------------------------------------------------------------
Parameters  : value       lower 90%   higher 90%
alpha       : 2.07783   ( -3.03402   -0.816022 )
beta        : -6.12590    ( 8.68084   18.6734 )
Epeak [keV] : 25.3384      ( -8.54652 7.62608 )
Norm@50keV   : 2.06008    ( -2.05985   147.778 )
------------------------------------------------------------
#Fit statistic : Chi-Squared =          70.42 using 59 PHA bins.
# Reduced chi-squared =          1.280 for     55 degrees of freedom
# Null hypothesis probability =   7.870315e-02

Photon flux (15-150 keV)    in 4.096 sec:  (    ) ph/cm2/s
Energy fluence (15-150 keV)             : 3.72195e-08 ( 0  0 ) ergs/cm2
S(25-50 keV) vs. S(50-100 keV) plot
S(25-50 keV)  = 1.44e-08
S(50-100 keV) = 9.46e-09
T90 vs. Hardness ratio plot
T90                                   = 4.0959999859333 sec.
Hardness ratio (energy fluence ratio) = 0.656944
Color vs. Color plot
Count Ratio  (25-50 keV) / (15-25 keV) = 0.883397
Count Ratio (50-100 keV) / (15-25 keV) = 0.0400655
Mask shadow pattern
IMX = 3.073445483436223E-01, IMY = -2.996374789010648E-02
TIME vs. PHA plot around the trigger time
Blue+Cyan dotted lines: Time interval of the scaled map
From 0.000000 to 4.096000
TIME vs. DetID plot around the trigger time
Blue+Cyan dotted lines: Time interval of the scaled map
From 0.000000 to 4.096000
100 us light curve (15-350 keV)
Blue+Cyan dotted lines: Time interval of the scaled map
From 0.000000 to 4.096000
Spacecraft aspect plot
Bright source in the pre-burst/pre-slew/post-slew images
Pre-burst image of 15-350 keV band
Time interval of the image:
-239.456000 -19.456000

# RAcent  DECcent POSerr Theta    Phi  PeakCts   SNR AngSep     Name
#  [deg]    [deg]    ['] [deg]  [deg]                   [']
135.5333 -40.5594    0.1  28.7   14.9  15.8857  77.9    0.4	Vela X-1
170.3762 -60.6573    3.7  40.1  -34.4   1.0217   3.1    2.7	Cen X-3
186.8986 -62.8459    4.5  45.4  -43.4   1.4660   2.6    8.0	GX 301-2
139.2688  16.3255    2.5  42.8  122.5   3.5098   4.6 ------	UNKNOWN
190.6828  29.3098    3.0  58.3 -175.7   5.4174   3.8 ------	UNKNOWN
186.4443  17.5001    2.7  46.3 -171.5   1.4474   4.3 ------	UNKNOWN
118.3406 -69.0469    2.6  54.3   -9.7   2.6911   4.4 ------	UNKNOWN
Pre-slew background subtracted image of 15-350 keV band
Time interval of the image:
0.000000 4.096000

# RAcent  DECcent POSerr Theta    Phi  PeakCts   SNR AngSep     Name
#  [deg]    [deg]    ['] [deg]  [deg]                   [']
135.5372 -40.5749    1.2  28.7   14.9   0.2034   9.6    1.3	Vela X-1
169.9196 -60.7206    0.0  40.2  -34.0  -0.0668  -2.1   13.0	Cen X-3
186.8583 -62.6577   16.9  45.3  -43.6  -0.0329  -0.7    8.7	GX 301-2
135.2467  11.9269    2.2  41.3  114.1   0.4343   5.1 ------	UNKNOWN
120.9480 -54.0761    2.3  44.4    5.4   0.1689   4.9 ------	UNKNOWN
189.7887  23.0725    2.2  52.7 -172.2   0.2461   5.3 ------	UNKNOWN
166.8876 -45.1399    2.5  24.6  -37.9   0.0966   4.6 ------	UNKNOWN
193.0907 -49.1084    2.0  38.1  -61.7   0.2302   5.7 ------	UNKNOWN
Post-slew image of 15-350 keV band
Time interval of the image:
90.044600 542.244600

# RAcent  DECcent POSerr Theta    Phi  PeakCts   SNR AngSep     Name
#  [deg]    [deg]    ['] [deg]  [deg]                   [']
135.5300 -40.5516    0.1  12.1   25.0  24.7312  83.0    0.2	Vela X-1
170.3380 -60.6027    3.4  28.8  -55.8   1.5734   3.4    1.4	Cen X-3
186.6714 -62.7618   69.9  36.0  -62.6   0.1094   0.2    0.6	GX 301-2
177.8005  14.8309    3.2  56.9  179.2   6.5762   3.6 ------	UNKNOWN
 53.3959 -81.1324    3.4  56.2  -23.7   5.0524   3.4 ------	UNKNOWN
Plot creation:
Sun May 31 11:12:25 EDT 2015