Special notes of this burst
Image
Pre-slew 15.0-350.0 keV image (Event data)
#   RAcent    DECcent   POSerr    Theta     Phi              Peak Cts       SNR   Name
  358.2374    46.5158   0.0119    28.0611  -136.1159         2.4645439     16.081 TRIG_00252588

Foreground time interval of the image:
-98.760  37.141 (delta_t = 135.901 [sec])
Background time interval of the image:
-239.760 -98.760 (delta_t = 141.000 [sec])
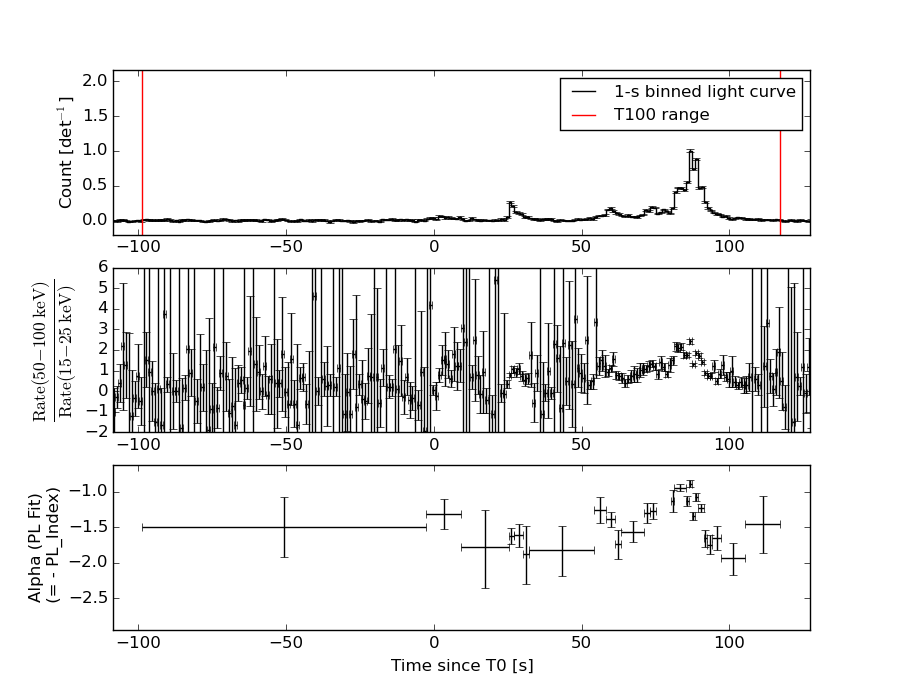
Lightcurves
Notes:
- 1) The mask-weighted light curves are using the flight position.
- 2) Multiple plots of different time binning/intervals are shown to cover all scenarios of short/long GRBs, rate/image triggers, and real/false positives.
- 3) For all the mask-weighted lightcurves, the y-axis units are counts/sec/det where a det is 0.4 x 0.4 = 0.16 sq cm.
- 4) The verticle lines correspond to following: green dotted lines are T50 interval, black dotted lines are T90 interval, blue solid line(s) is a spacecraft slew start time, and orange solid line(s) is a spacecraft slew end time.
- 5) Time of each bin is in the middle of the bin.
1 s binning
From T0-310 s to T0+310 s
From T100_start - 20 s to T100_end + 30 s

Full time interval
64 ms binning
Full time interval

From T100_start to T100_end
From T0-5 sec to T0+5 sec
16 ms binning
From T100_start-5 s to T100_start+5 s

Blue+Cyan dotted lines: Time interval of the scaled map
From 0.000000 to 4.096000
8 ms binning
From T100_start-3 s to T100_start+3 s
Blue+Cyan dotted lines: Time interval of the scaled map
From 0.000000 to 4.096000
2 ms binning
From T100_start-1 s to T100_start+1 s

Blue+Cyan dotted lines: Time interval of the scaled map
From 0.000000 to 4.096000
SN=5 or 10 sec. binning (whichever binning is satisfied first)
SN=5 or 10 sec. binning (T < 200 sec)
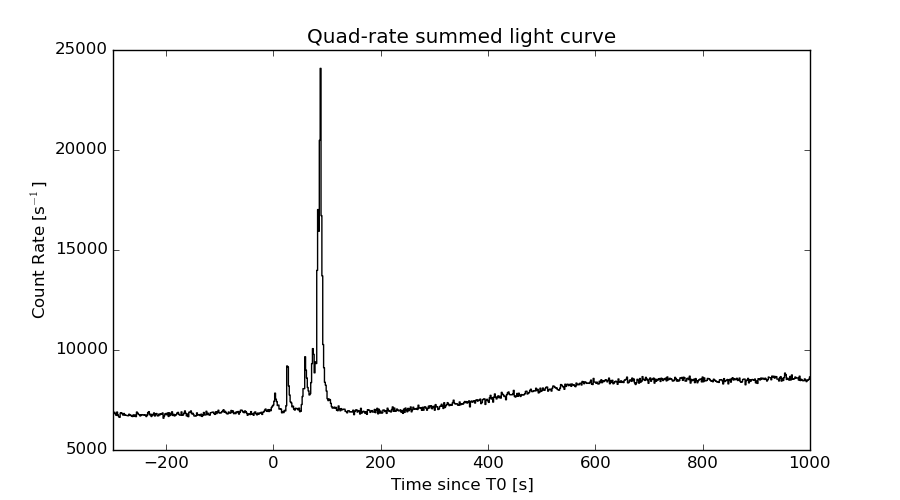
Quad-rate summed light curves (from T0-300s to T0+1000s)
Spectral Evolution
Spectra
Notes:
- 1) The fitting includes the systematic errors.
- 2) When the burst includes telescope slew time periods, the fitting uses an average response file made from multiple 5-s response files through out the slew time plus single time preiod for the non-slew times, and weighted by the total counts in the corresponding time period using addrmf. An average response file is needed becuase a spectral fit using the pre-slew DRM will introduce some errors in both a spectral shape and a normalization if the PHA file contains a lot of the slew/post-slew time interval.
- 3) For fits to more complicated models (e.g. a power-law over a cutoff power-law), the BAT team has decided to require a chi-square improvement of more than 6 for each extra dof.
Time averaged spectrum fit using the average DRM
Power-law model
Time interval is from  -98.760 sec. to  117.240 sec.

Spectral model in power-law:
------------------------------------------------------------
Parameters  : value       lower 90%   higher 90%
Photon index: 1.33102     ( -0.0429588   0.0428468 )
Norm@50keV  : 4.01615E-03    ( -8.8938e-05   8.8881e-05 )
------------------------------------------------------------
#Fit statistic : Chi-Squared =          50.38 using 59 PHA bins.
# Reduced chi-squared =         0.8838 for     57 degrees of freedom
# Null hypothesis probability =   7.199914e-01

Photon flux (15-150 keV)    in 216 sec: 0.481983 ( -0.0118886  0.0119416 ) ph/cm2/s
Energy fluence (15-150 keV)             : 8.50932e-06 ( -1.96135e-07  1.96448e-07 ) ergs/cm2
Cutoff power-law model
Time interval is from  -98.760 sec. to  117.240 sec.
Spectral model in the cutoff power-law:
------------------------------------------------------------
Parameters  : value       lower 90%   higher 90%
Photon index: 1.27606     ( -0.164086   0.0579131 )
Epeak [keV] : 707.619      ( -999.999 -999.999 )
Norm@50keV  : 4.24441E-03    ( -0.000405913   0.000693029 )
------------------------------------------------------------
#Fit statistic : Chi-Squared =          50.49 using 59 PHA bins.
# Reduced chi-squared =         0.9015 for     56 degrees of freedom
# Null hypothesis probability =   6.828220e-01

Photon flux (15-150 keV)    in 216 sec: 0.479143 0.481549 (    ) ph/cm2/s
Energy fluence (15-150 keV)             : 8.48375e-06 ( -2.03731e-07  2.22934e-07 ) ergs/cm2
Band function

Time interval is from  -98.760 sec. to  117.240 sec.

Spectral model in the Band function:
------------------------------------------------------------
Parameters  : value       lower 90%   higher 90%
alpha       : 0.143292   ( 0.590331   0.590331 )
beta        : -1.34514    ( 1.34307   0.0475033 )
Epeak [keV] : 37.2111      ( -37.1942 129.913 )
Norm@50keV   : 4.77396E-02    ( -0.0480207   237.752 )
------------------------------------------------------------
#Fit statistic : Chi-Squared =          48.98 using 59 PHA bins.
# Reduced chi-squared =         0.8905 for     55 degrees of freedom
# Null hypothesis probability =   7.028564e-01

Photon flux (15-150 keV)    in 216 sec:  (    ) ph/cm2/s
Energy fluence (15-150 keV)             : 0 ( 0  0 ) ergs/cm2
Single BB
Spectral model blackbody:
------------------------------------------------------------
Parameters  : value    Lower 90%  Upper 90%
kT [keV]    : 19.1574  (  )
R^2/D10^2   : 2.36829E-02  (   )
(R is the radius in km and D10 is the distance to the source in units of 10 kpc)
------------------------------------------------------------
#Fit statistic : Chi-Squared =         468.12 using 59 PHA bins.
# Reduced chi-squared =         8.2126 for     57 degrees of freedom
# Null hypothesis probability =   6.327533e-66

Energy  Fluence     90% Error
[keV]   [erg/cm2]   [erg/cm2]
15- 25  3.679e-07   1.717e-08
25- 50  1.780e-06   6.037e-08
50-150  4.808e-06   1.825e-07
15-150  6.956e-06   1.901e-07
Thermal bremsstrahlung (OTTB)
Spectral model: thermal bremsstrahlung
------------------------------------------------------------
Parameters  : value         Lower 90%    Upper 90%
kT [keV]    : 199.363       (      )
Norm        : 2.04216       (     )
------------------------------------------------------------
#Fit statistic : Chi-Squared =         154.61 using 59 PHA bins.
# Reduced chi-squared =         2.7124 for     57 degrees of freedom
# Null hypothesis probability =   6.033581e-11

Energy  Fluence     90% Error
[keV]   [erg/cm2]   [erg/cm2]
15- 25  1.098e-06   2.700e-08
25- 50  2.113e-06   5.216e-08
50-150  4.634e-06   1.123e-07
15-150  7.845e-06   1.858e-07
Double BB

Spectral model: bbodyrad<1> + bbodyrad<2>
------------------------------------------------------------
Parameters  : value         Lower 90%    Upper 90%
kT1 [keV]   : 8.21402        (-0.716951      0.762553)
R1^2/D10^2  : 0.262442        (-0.0655563      0.0946589)
kT2 [keV]   : 33.4896        (-3.00605      3.93971)
R2^2/D10^2  : 3.09523E-03    (-0.00093296   0.00114699)
------------------------------------------------------------
#Fit statistic : Chi-Squared =          57.00 using 59 PHA bins.
# Reduced chi-squared =          1.036 for     55 degrees of freedom
# Null hypothesis probability =   4.004958e-01

Energy  Fluence     90% Error
[keV]   [erg/cm2]   [erg/cm2]
15- 25  8.142e-07   7.171e-08
25- 50  1.995e-06   9.515e-08
50-150  5.668e-06   3.586e-07
15-150  8.477e-06   4.612e-07
Peak spectrum fit
Power-law model

Time interval is from   86.240 sec. to   87.240 sec.

Spectral model in power-law:
------------------------------------------------------------
Parameters  : value       lower 90%   higher 90%
Photon index: 0.885543     ( -0.0512418   0.050904 )
Norm@50keV  : 6.58759E-02    ( -0.00196551   0.0019629 )
------------------------------------------------------------
#Fit statistic : Chi-Squared =          66.98 using 59 PHA bins.
# Reduced chi-squared =          1.175 for     57 degrees of freedom
# Null hypothesis probability =   1.718401e-01

Photon flux (15-150 keV)    in 1 sec: 7.56049 ( -0.225553  0.225624 ) ph/cm2/s
Energy fluence (15-150 keV)             : 7.4349e-07 ( -2.38954e-08  2.39383e-08 ) ergs/cm2
Cutoff power-law model

Time interval is from   86.240 sec. to   87.240 sec.
Spectral model in the cutoff power-law:
------------------------------------------------------------
Parameters  : value       lower 90%   higher 90%
Photon index: 0.486807     ( -0.217108   0.206964 )
Epeak [keV] : 225.828      ( -58.4934 169.317 )
Norm@50keV  : 9.78267E-02    ( -0.017713   0.0226399 )
------------------------------------------------------------
#Fit statistic : Chi-Squared =          55.71 using 59 PHA bins.
# Reduced chi-squared =         0.9948 for     56 degrees of freedom
# Null hypothesis probability =   4.858729e-01

Photon flux (15-150 keV)    in 1 sec: 7.45422 ( -0.23145  0.23158 ) ph/cm2/s
Energy fluence (15-150 keV)             : 7.33022e-07 ( -2.5081e-08  2.4951e-08 ) ergs/cm2
Band function

Time interval is from   86.240 sec. to   87.240 sec.

Spectral model in the Band function:
------------------------------------------------------------
Parameters  : value       lower 90%   higher 90%
alpha       : 4.99996   ( -5.45013e-06   -4.99996 )
beta        : -0.946810    ( -0.0579147   0.0574538 )
Epeak [keV] : 31.1162      ( -7.28789 3.48924 )
Norm@50keV   : 1145.20    ( -33.3237   4113.52 )
------------------------------------------------------------
#Fit statistic : Chi-Squared =          61.43 using 59 PHA bins.
# Reduced chi-squared =          1.117 for     55 degrees of freedom
# Null hypothesis probability =   2.565915e-01

Photon flux (15-150 keV)    in 1 sec:  (    ) ph/cm2/s
Energy fluence (15-150 keV)             : 0 ( 0  0 ) ergs/cm2
Single BB

Spectral model blackbody:
------------------------------------------------------------
Parameters  : value    Lower 90%  Upper 90%
kT [keV]    : 23.8289  (  )
R^2/D10^2   : 0.220259  (   )
(R is the radius in km and D10 is the distance to the source in units of 10 kpc)
------------------------------------------------------------
#Fit statistic : Chi-Squared =         192.22 using 59 PHA bins.
# Reduced chi-squared =         3.3724 for     57 degrees of freedom
# Null hypothesis probability =   1.481584e-16

Energy  Fluence     90% Error
[keV]   [erg/cm2]   [erg/cm2]
15- 25  2.227e-08   1.375e-09
25- 50  1.232e-07   5.300e-09
50-150  5.216e-07   2.380e-08
15-150  6.671e-07   2.355e-08
Thermal bremsstrahlung (OTTB)

Spectral model: thermal bremsstrahlung
------------------------------------------------------------
Parameters  : value         Lower 90%    Upper 90%
kT [keV]    : 199.363       (      )
Norm        : 29.6330       (     )
------------------------------------------------------------
#Fit statistic : Chi-Squared =         499.34 using 59 PHA bins.
# Reduced chi-squared =         8.7603 for     57 degrees of freedom
# Null hypothesis probability =   6.162861e-72

Energy  Fluence     90% Error
[keV]   [erg/cm2]   [erg/cm2]
15- 25  7.379e-08   2.455e-09
25- 50  1.419e-07   4.550e-09
50-150  3.113e-07   1.105e-08
15-150  5.270e-07   1.750e-08
Double BB
Spectral model: bbodyrad<1> + bbodyrad<2>
------------------------------------------------------------
Parameters  : value         Lower 90%    Upper 90%
kT1 [keV]   : 9.67918        (-1.38431      1.56127)
R1^2/D10^2  : 1.64840        (-0.526354      0.880011)
kT2 [keV]   : 37.4162        (-4.29815      6.57689)
R2^2/D10^2  : 4.76622E-02    (-0.018716   0.0228293)
------------------------------------------------------------
#Fit statistic : Chi-Squared =          52.11 using 59 PHA bins.
# Reduced chi-squared =         0.9475 for     55 degrees of freedom
# Null hypothesis probability =   5.856516e-01

Energy  Fluence     90% Error
[keV]   [erg/cm2]   [erg/cm2]
15- 25  4.011e-08   5.985e-09
25- 50  1.341e-07   1.170e-08
50-150  5.646e-07   5.390e-08
15-150  7.388e-07   8.100e-08
Pre-slew spectrum (Pre-slew PHA with pre-slew DRM)
Power-law model

Spectral model in power-law:
------------------------------------------------------------
Parameters  : value       lower 90%   higher 90%
Photon index: 1.57034     ( -0.14492   0.14634 )
Norm@50keV  : 1.20104E-03    ( -0.000100604   9.98041e-05 )
------------------------------------------------------------
#Fit statistic : Chi-Squared =          65.22 using 59 PHA bins.
# Reduced chi-squared =          1.144 for     57 degrees of freedom
# Null hypothesis probability =   2.126729e-01

Photon flux (15-150 keV)    in 135.9 sec: 0.152955 ( -0.0123741  0.0123929 ) ph/cm2/s
Energy fluence (15-150 keV)             : 1.53227e-06 ( -1.39355e-07  1.40678e-07 ) ergs/cm2
Cutoff power-law model
Spectral model in the cutoff power-law:
------------------------------------------------------------
Parameters  : value       lower 90%   higher 90%
Photon index: 1.57325     ( -0.149295   0.143973 )
Epeak [keV] : 9999.36      ( -9999.36 -9999.36 )
Norm@50keV  : 1.20137E-03    ( -0.000668533   0.000826351 )
------------------------------------------------------------
#Fit statistic : Chi-Squared =          65.23 using 59 PHA bins.
# Reduced chi-squared =          1.165 for     56 degrees of freedom
# Null hypothesis probability =   1.866675e-01

Photon flux (15-150 keV)    in 135.9 sec: 0.153005 ( -0.01212  0.012288 ) ph/cm2/s
Energy fluence (15-150 keV)             : 1.53129e-06 ( -7.2326e-08  1.39298e-07 ) ergs/cm2
Band function
Spectral model in the Band function:
------------------------------------------------------------
Parameters  : value       lower 90%   higher 90%
alpha       : -0.530363   ( 1.08615   6.08081 )
beta        : -1.60187    ( 1.59459   0.163494 )
Epeak [keV] : 35.9862      ( -36.4247 435.744 )
Norm@50keV   : 7.02824E-03    ( -0.00734324   164.238 )
------------------------------------------------------------
#Fit statistic : Chi-Squared =          64.93 using 59 PHA bins.
# Reduced chi-squared =          1.181 for     55 degrees of freedom
# Null hypothesis probability =   1.690160e-01

Photon flux (15-150 keV)    in 135.9 sec:  (    ) ph/cm2/s
Energy fluence (15-150 keV)             : 0 ( 0  0 ) ergs/cm2
S(25-50 keV) vs. S(50-100 keV) plot
S(25-50 keV)  = 1.93e-06
S(50-100 keV) = 3.06e-06
T90 vs. Hardness ratio plot

T90                                   = 100 sec.
Hardness ratio (energy fluence ratio) = 1.58549
Color vs. Color plot
Count Ratio  (25-50 keV) / (15-25 keV) = 1.44562
Count Ratio (50-100 keV) / (15-25 keV) = 1.22611
Mask shadow pattern
IMX = -3.842128353345811E-01, IMY = 3.695306085312690E-01
TIME vs. PHA plot around the trigger time
Blue+Cyan dotted lines: Time interval of the scaled map
From 0.000000 to 4.096000
TIME vs. DetID plot around the trigger time
Blue+Cyan dotted lines: Time interval of the scaled map
From 0.000000 to 4.096000
100 us light curve (15-350 keV)
Blue+Cyan dotted lines: Time interval of the scaled map
From 0.000000 to 4.096000
Spacecraft aspect plot

Bright source in the pre-burst/pre-slew/post-slew images
Pre-burst image of 15-350 keV band
Time interval of the image:
-239.760000 -98.760000

# RAcent  DECcent POSerr Theta    Phi  PeakCts   SNR AngSep     Name
#  [deg]    [deg]    ['] [deg]  [deg]                   [']
  1.8210  11.5445    2.2  57.0 -167.4   2.0990   5.2 ------	UNKNOWN
355.4036  26.3389    3.3  46.0 -152.5   0.6926   3.5 ------	UNKNOWN
253.9772  68.0956    3.0  48.4  -50.0   1.7795   3.9 ------	UNKNOWN
Pre-slew background subtracted image of 15-350 keV band
Time interval of the image:
-98.760000 37.140590

# RAcent  DECcent POSerr Theta    Phi  PeakCts   SNR AngSep     Name
#  [deg]    [deg]    ['] [deg]  [deg]                   [']
 13.6422  15.2657    2.2  49.8 -179.5   1.5380   5.2 ------	UNKNOWN
358.2374  46.5158    0.7  28.1 -136.1   2.4644  16.1 ------	UNKNOWN
351.0864  33.1836    2.3  42.0 -142.8   1.2329   5.0 ------	UNKNOWN
350.5586  20.1603    2.9  53.5 -151.1   1.9174   3.9 ------	UNKNOWN
Post-slew image of 15-350 keV band
Time interval of the image:
89.940590 482.303700
540.240000 962.293000

# RAcent  DECcent POSerr Theta    Phi  PeakCts   SNR AngSep     Name
#  [deg]    [deg]    ['] [deg]  [deg]                   [']
308.0810  41.1625   27.9  35.9  -62.0  -0.3053  -0.4   12.7	Cyg X-3
326.1993  38.2788    4.7  24.8  -79.9   1.3884   2.5    2.9	Cyg X-2
248.8050  75.8802    3.5  49.6    0.3   2.6925   3.3 ------	UNKNOWN
358.2439  46.4906    1.7   0.0 -177.1   2.5645   6.8 ------	UNKNOWN
343.0783  -5.7543    3.8  54.0 -143.3   7.8668   3.1 ------	UNKNOWN
Plot creation:
Wed Jun 24 01:05:06 EDT 2015