Click here for the BAT GCN circular template
Image
Pre-slew 15.0-350.0 keV image (Event data)
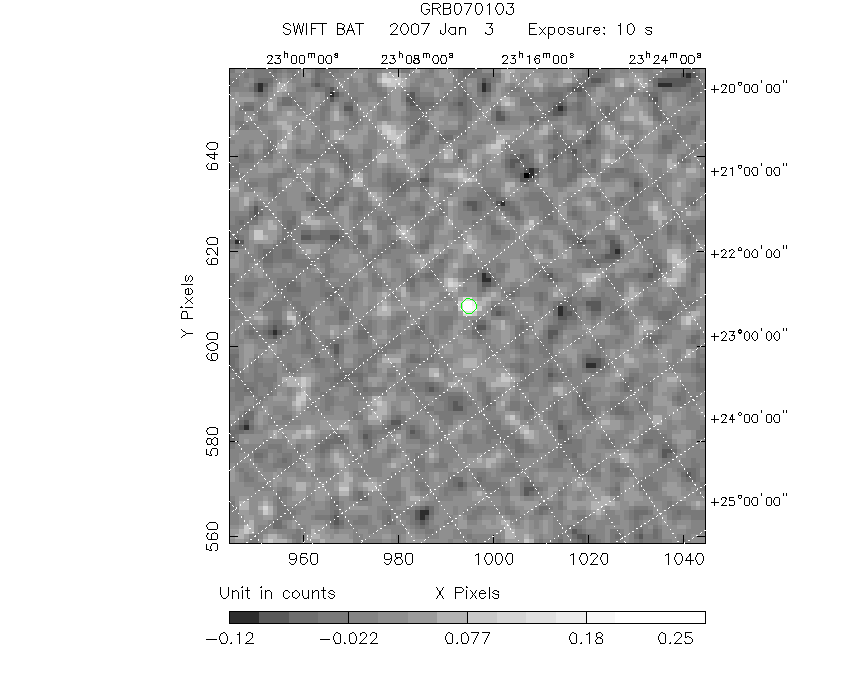
#   RAcent    DECcent   POSerr    Theta     Phi              Peak Cts       SNR   Name
  352.5685    26.8220   0.0209    20.1924  -131.1310         0.2913869      9.189 TRIG_00254532

Foreground time interval of the image:
 -0.104  10.013 (delta_t =  10.117 [sec])
Background time interval of the image:
-239.088  -0.104 (delta_t = 238.984 [sec])
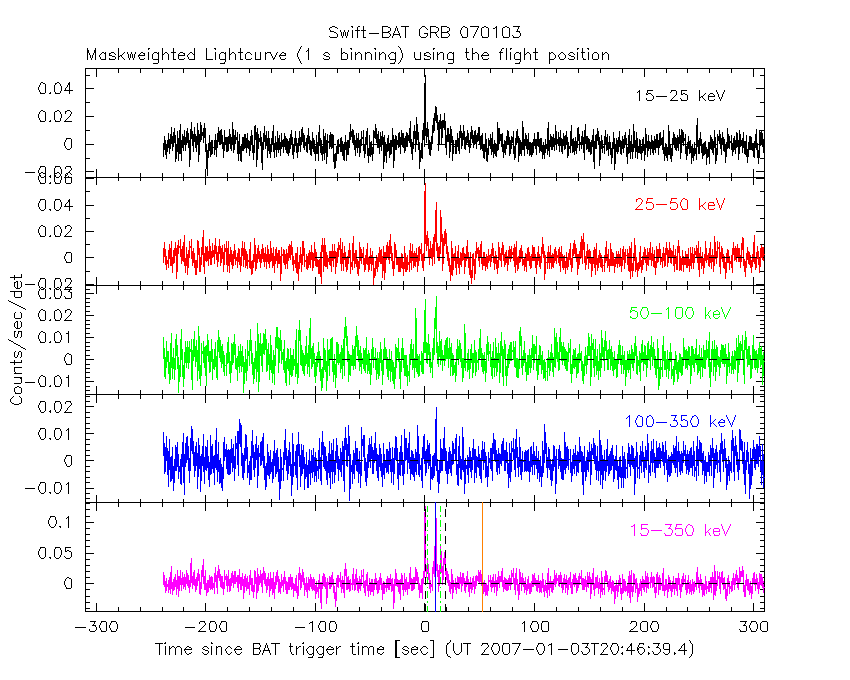
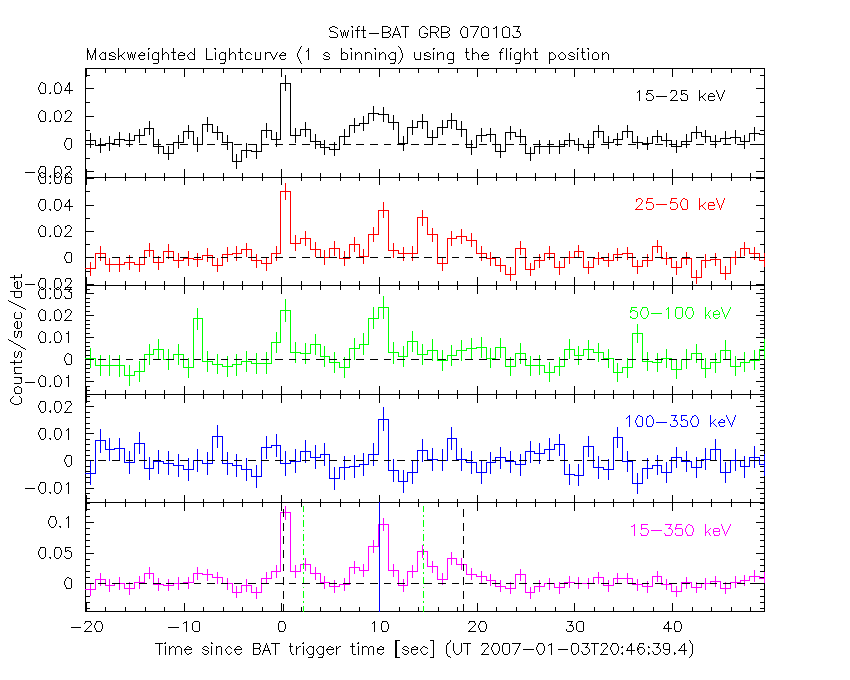
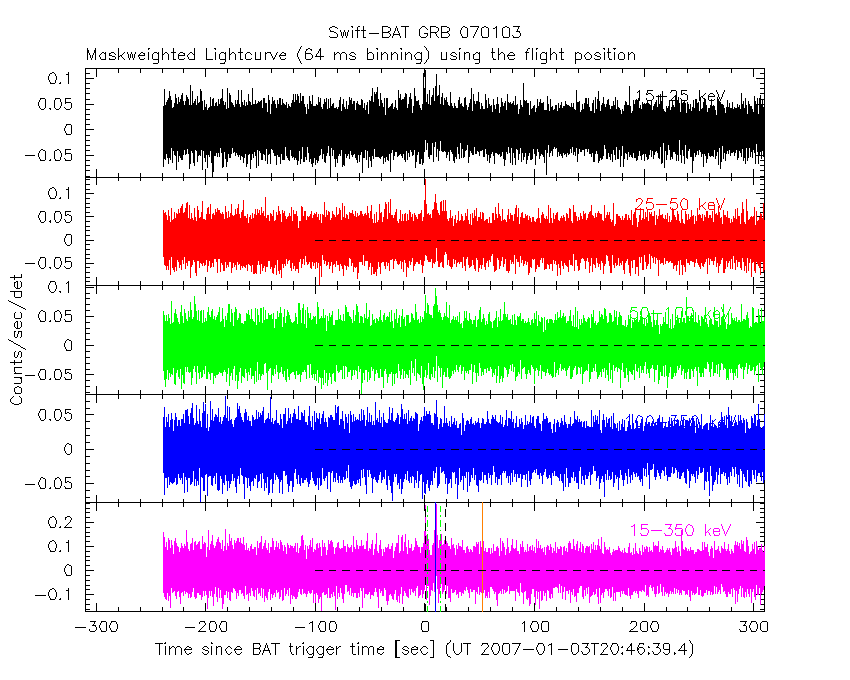
Lightcurves
Notes:
- 1) The mask-weighted light curves are using the flight position.
- 2) Multiple plots of different time binning/intervals are shown to cover all scenarios of short/long GRBs, rate/image triggers, and real/false positives.
- 3) For all the mask-weighted lightcurves, the y-axis units are counts/sec/det where a det is 0.4 x 0.4 = 0.16 sq cm.
- 4) The verticle lines correspond to following: green dotted lines are T50 interval, black dotted lines are T90 interval, blue solid line(s) is a spacecraft slew start time, and orange solid line(s) is a spacecraft slew end time.
- 5) Time of each bin is in the middle of the bin.
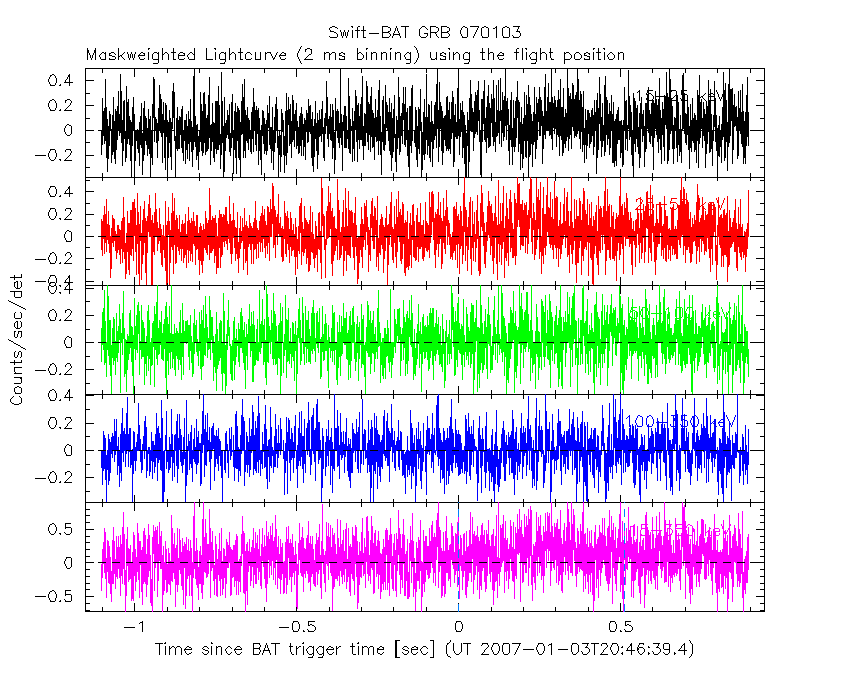
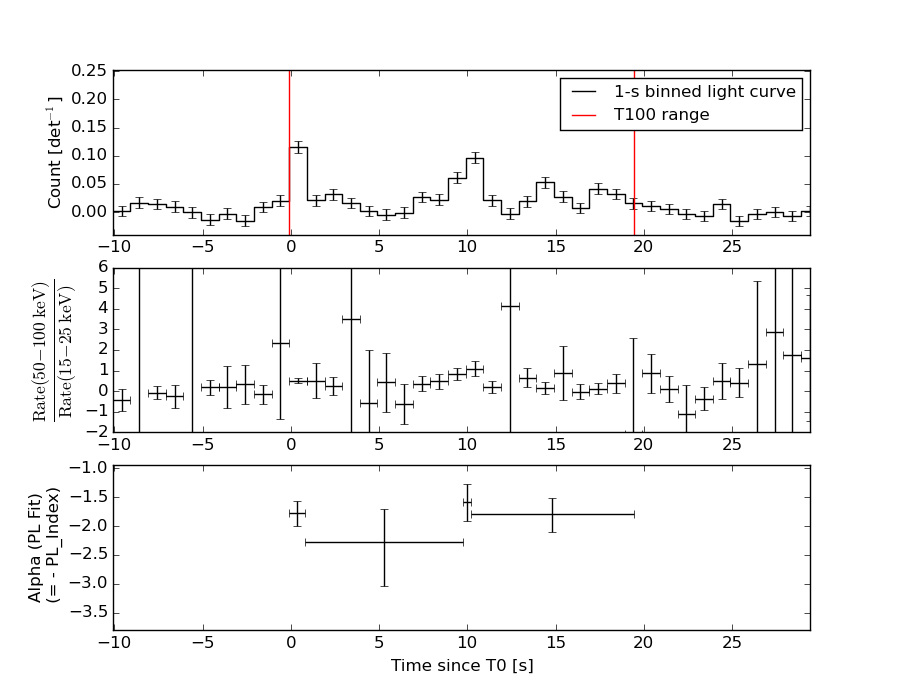
1 s binning
From T0-310 s to T0+310 s
From T100_start - 20 s to T100_end + 30 s
Full time interval

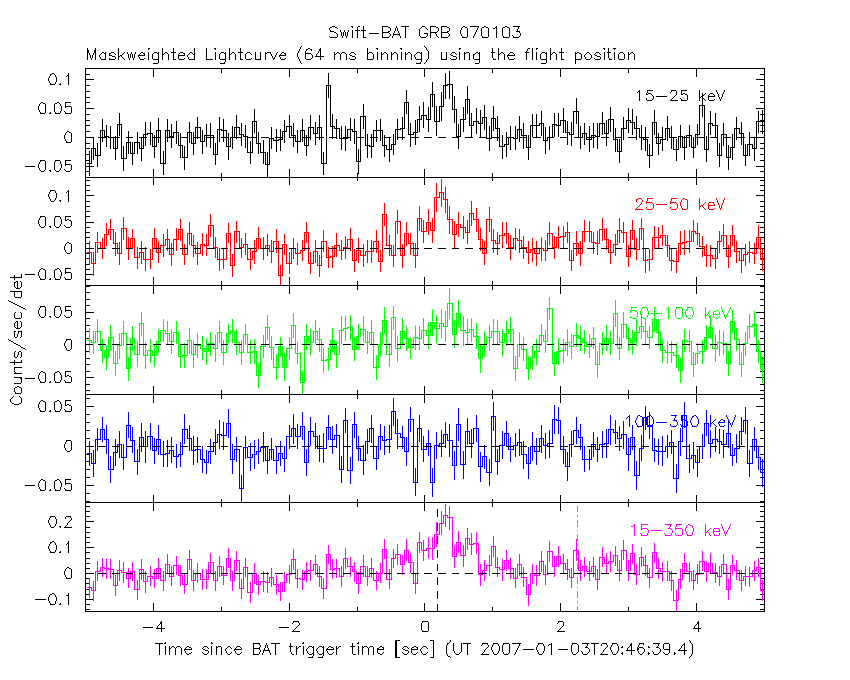
64 ms binning
Full time interval
From T100_start to T100_end
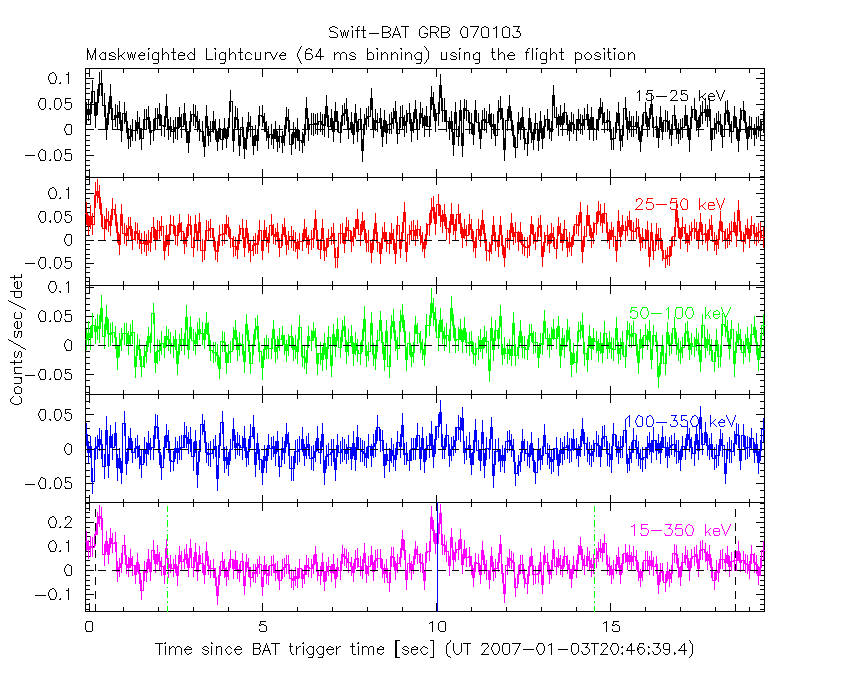
From T0-5 sec to T0+5 sec
16 ms binning
From T100_start-5 s to T100_start+5 s
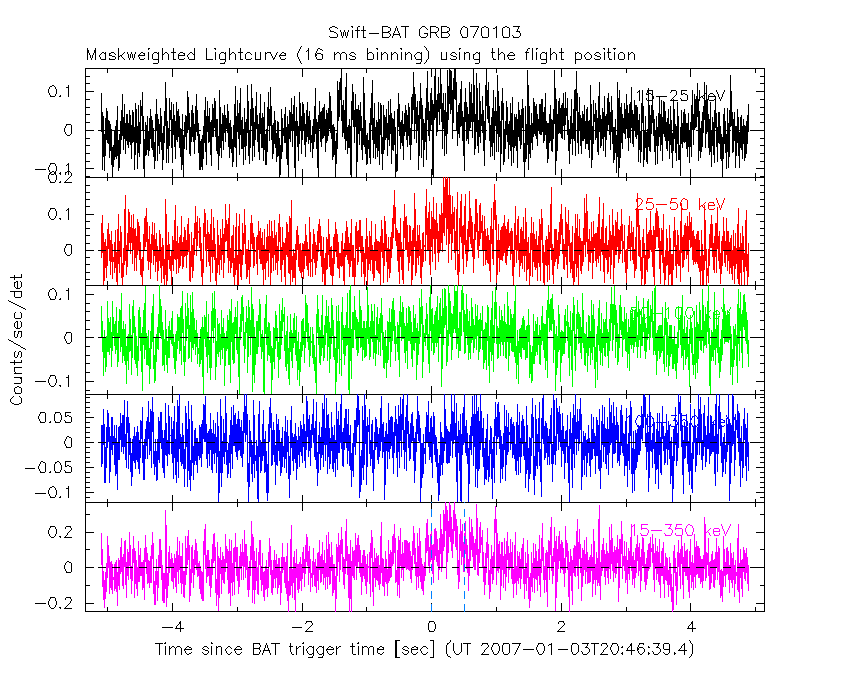
Blue+Cyan dotted lines: Time interval of the scaled map
From 0.000000 to 0.512000
8 ms binning
From T100_start-3 s to T100_start+3 s
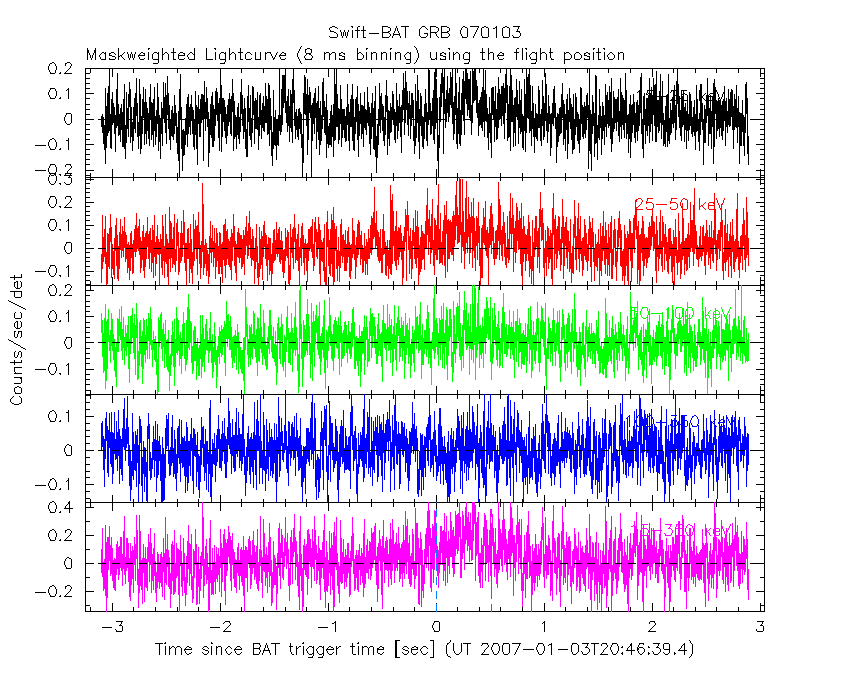
Blue+Cyan dotted lines: Time interval of the scaled map
From 0.000000 to 0.512000
2 ms binning
From T100_start-1 s to T100_start+1 s
Blue+Cyan dotted lines: Time interval of the scaled map
From 0.000000 to 0.512000
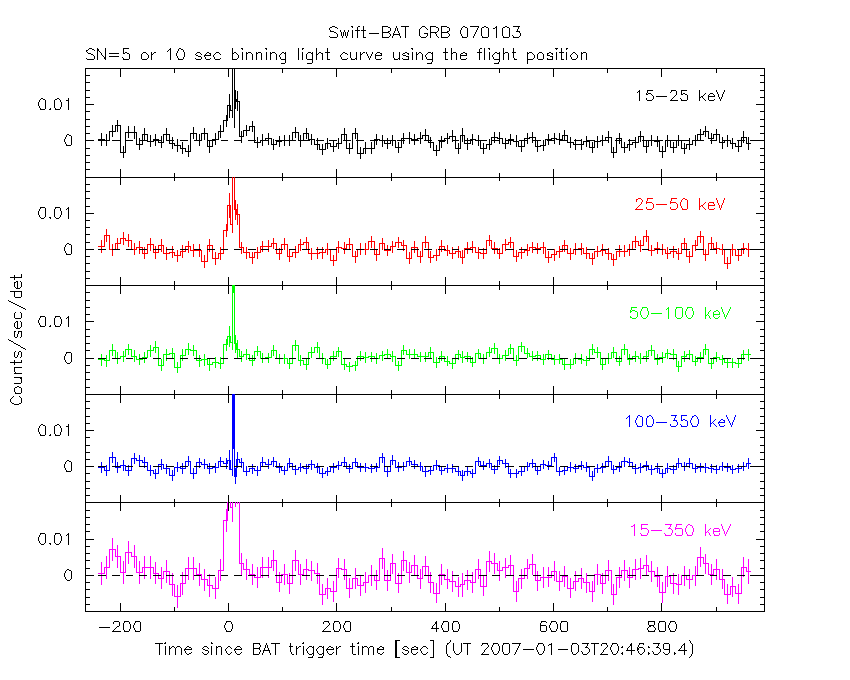
SN=5 or 10 sec. binning (whichever binning is satisfied first)
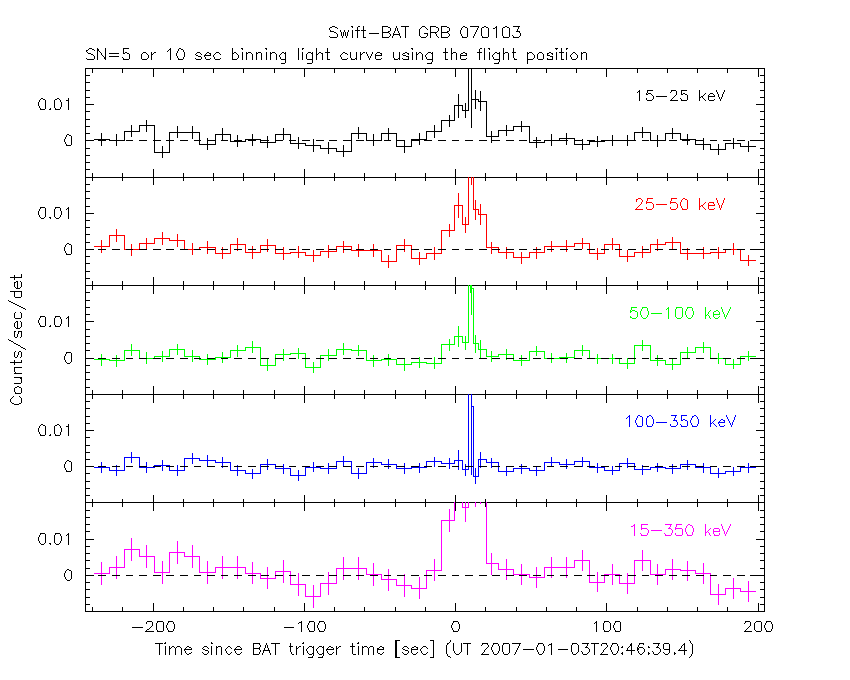
SN=5 or 10 sec. binning (T < 200 sec)
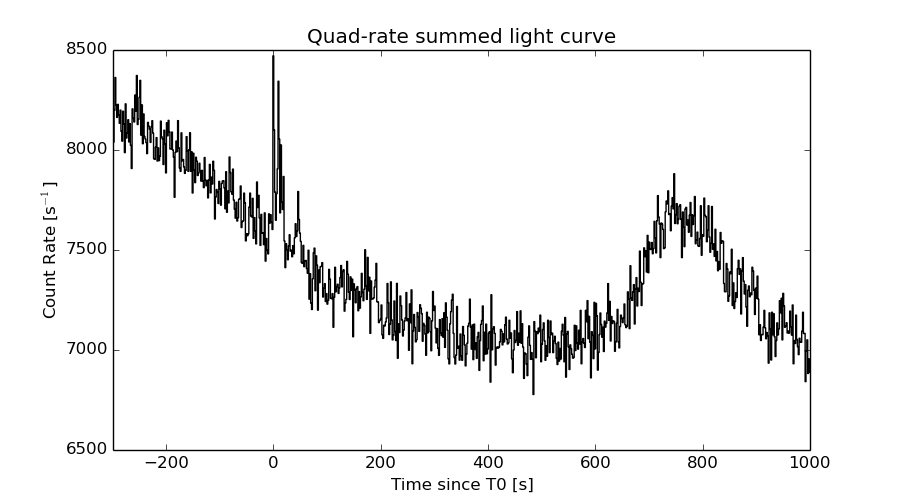
Quad-rate summed light curves (from T0-300s to T0+1000s)
Spectral Evolution
Spectra
Notes:
- 1) The fitting includes the systematic errors.
- 2) When the burst includes telescope slew time periods, the fitting uses an average response file made from multiple 5-s response files through out the slew time plus single time preiod for the non-slew times, and weighted by the total counts in the corresponding time period using addrmf. An average response file is needed becuase a spectral fit using the pre-slew DRM will introduce some errors in both a spectral shape and a normalization if the PHA file contains a lot of the slew/post-slew time interval.
- 3) For fits to more complicated models (e.g. a power-law over a cutoff power-law), the BAT team has decided to require a chi-square improvement of more than 6 for each extra dof.
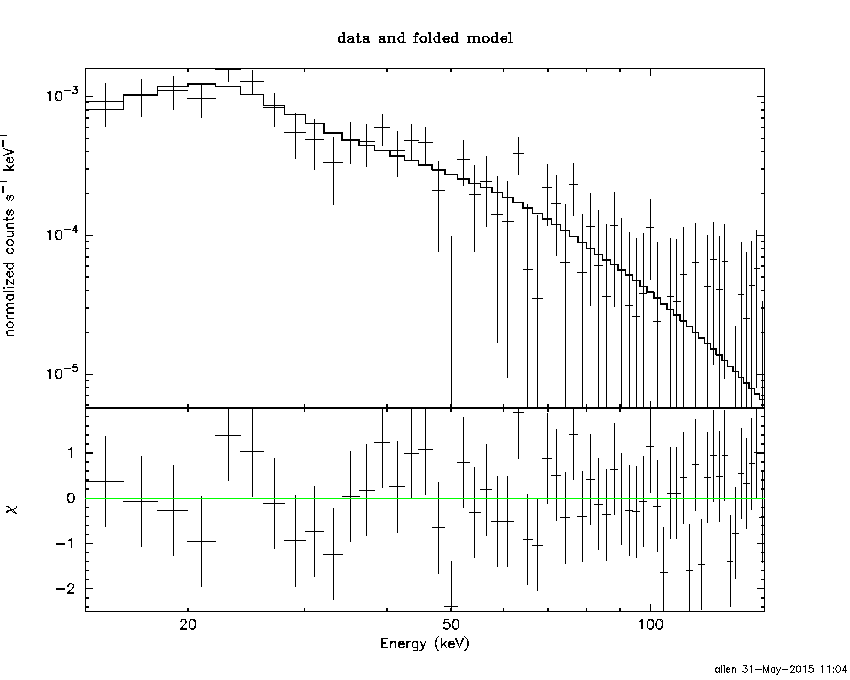
Time averaged spectrum fit using the average DRM
Power-law model

Time interval is from   -0.104 sec. to   19.420 sec.

Spectral model in power-law:
------------------------------------------------------------
Parameters  : value       lower 90%   higher 90%
Photon index: 1.89362     ( -0.19817   0.208411 )
Norm@50keV  : 1.83460E-03    ( -0.000255293   0.000249775 )
------------------------------------------------------------
#Fit statistic : Chi-Squared =          48.65 using 59 PHA bins.
# Reduced chi-squared =         0.8536 for     57 degrees of freedom
# Null hypothesis probability =   7.764166e-01

Photon flux (15-150 keV)    in 19.52 sec: 0.262574 ( -0.0287583  0.0287585 ) ph/cm2/s
Energy fluence (15-150 keV)             : 3.29224e-07 ( -4.44297e-08  4.561e-08 ) ergs/cm2
Cutoff power-law model

Time interval is from   -0.104 sec. to   19.420 sec.
Spectral model in the cutoff power-law:
------------------------------------------------------------
Parameters  : value       lower 90%   higher 90%
Photon index: 1.22264     ( -1.06656   0.824274 )
Epeak [keV] : 46.6328      ( -30.177 -46.6328 )
Norm@50keV  : 4.58651E-03    ( -0.00289626   0.0156073 )
------------------------------------------------------------
#Fit statistic : Chi-Squared =          46.83 using 59 PHA bins.
# Reduced chi-squared =         0.8362 for     56 degrees of freedom
# Null hypothesis probability =   8.037877e-01

Photon flux (15-150 keV)    in 19.52 sec: 0.256147 ( -0.029723  0.029794 ) ph/cm2/s
Energy fluence (15-150 keV)             : 3.0346e-07 ( -5.11971e-08  5.52767e-08 ) ergs/cm2
Band function
Time interval is from   -0.104 sec. to   19.420 sec.

Spectral model in the Band function:
------------------------------------------------------------
Parameters  : value       lower 90%   higher 90%
alpha       : 4.84171   ( -6.38736   -4.84171 )
beta        : -2.14678    ( -0.320175   0.271078 )
Epeak [keV] : 24.8320      ( -3.95494 3.48948 )
Norm@50keV   : 228.058    ( -24.7445   1273.67 )
------------------------------------------------------------
#Fit statistic : Chi-Squared =          44.45 using 59 PHA bins.
# Reduced chi-squared =         0.8082 for     55 degrees of freedom
# Null hypothesis probability =   8.446254e-01

Photon flux (15-150 keV)    in 19.52 sec:  (    ) ph/cm2/s
Energy fluence (15-150 keV)             : 3.14508e-07 ( -3.14372e-07  -4.52825e-08 ) ergs/cm2
Single BB

Spectral model blackbody:
------------------------------------------------------------
Parameters  : value    Lower 90%  Upper 90%
kT [keV]    : 9.71907  (-1.20917  1.41113)
R^2/D10^2   : 0.138059  (-0.0555766   0.0908583)
(R is the radius in km and D10 is the distance to the source in units of 10 kpc)
------------------------------------------------------------
#Fit statistic : Chi-Squared =          59.46 using 59 PHA bins.
# Reduced chi-squared =          1.043 for     57 degrees of freedom
# Null hypothesis probability =   3.861542e-01

Energy  Fluence     90% Error
[keV]   [erg/cm2]   [erg/cm2]
15- 25  5.131e-08   9.448e-09
25- 50  1.225e-07   1.607e-08
50-150  5.882e-08   1.801e-08
15-150  2.326e-07   3.225e-08
Thermal bremsstrahlung (OTTB)

Spectral model: thermal bremsstrahlung
------------------------------------------------------------
Parameters  : value         Lower 90%    Upper 90%
kT [keV]    : 74.6708       (-23.0317      42.1023)
Norm        : 1.26701       (-0.200883     0.251858)
------------------------------------------------------------
#Fit statistic : Chi-Squared =          46.80 using 59 PHA bins.
# Reduced chi-squared =         0.8210 for     57 degrees of freedom
# Null hypothesis probability =   8.304029e-01

Energy  Fluence     90% Error
[keV]   [erg/cm2]   [erg/cm2]
15- 25  6.385e-08   9.584e-09
25- 50  1.033e-07   1.240e-08
50-150  1.391e-07   6.461e-08
15-150  3.062e-07   5.729e-08
Double BB

Spectral model: bbodyrad<1> + bbodyrad<2>
------------------------------------------------------------
Parameters  : value         Lower 90%    Upper 90%
kT1 [keV]   : 6.53481        (-1.87422      1.93098)
R1^2/D10^2  : 0.457808        (-0.259449      0.943929)
kT2 [keV]   : 22.0654        (-8.01418      32.7363)
R2^2/D10^2  : 3.97024E-03    (-0.00375257   0.0215419)
------------------------------------------------------------
#Fit statistic : Chi-Squared =          45.29 using 59 PHA bins.
# Reduced chi-squared =         0.8235 for     55 degrees of freedom
# Null hypothesis probability =   8.217577e-01

Energy  Fluence     90% Error
[keV]   [erg/cm2]   [erg/cm2]
15- 25  6.373e-08   2.538e-08
25- 50  1.047e-07   4.433e-08
50-150  1.431e-07   8.071e-08
15-150  3.115e-07   1.450e-07
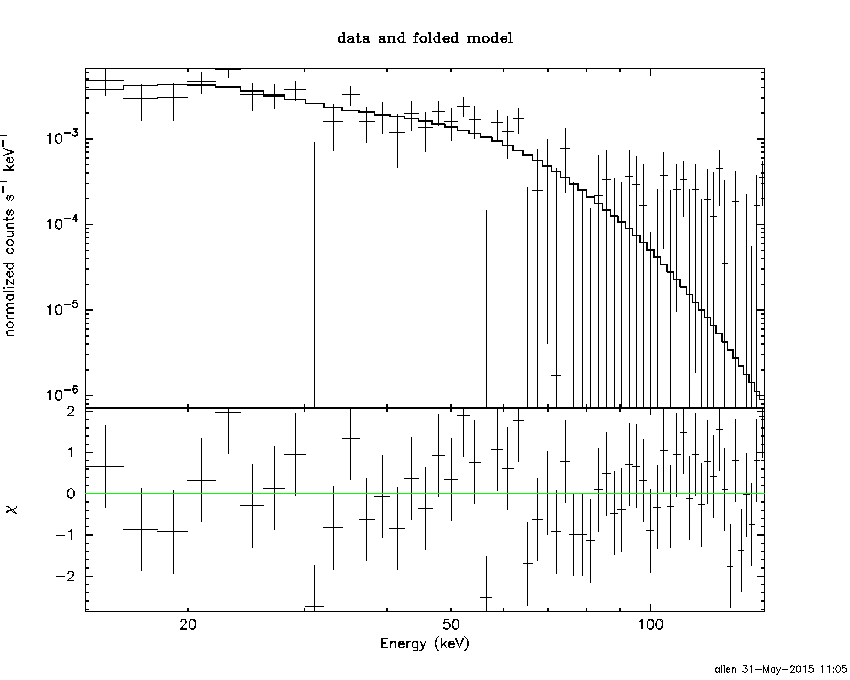
Peak spectrum fit
Power-law model

Time interval is from   -0.114 sec. to    0.886 sec.

Spectral model in power-law:
------------------------------------------------------------
Parameters  : value       lower 90%   higher 90%
Photon index: 1.87121     ( -0.22571   0.241359 )
Norm@50keV  : 7.39791E-03    ( -0.00122135   0.00119339 )
------------------------------------------------------------
#Fit statistic : Chi-Squared =          70.60 using 59 PHA bins.
# Reduced chi-squared =          1.239 for     57 degrees of freedom
# Null hypothesis probability =   1.063343e-01

Photon flux (15-150 keV)    in 1 sec: 1.04894 ( -0.138454  0.138454 ) ph/cm2/s
Energy fluence (15-150 keV)             : 6.8013e-08 ( -1.09532e-08  1.12728e-08 ) ergs/cm2
Cutoff power-law model

Time interval is from   -0.114 sec. to    0.886 sec.
Spectral model in the cutoff power-law:
------------------------------------------------------------
Parameters  : value       lower 90%   higher 90%
Photon index: 0.143270     ( -1.64879   1.27166 )
Epeak [keV] : 43.6631      ( -7.76174 16.5193 )
Norm@50keV  : 7.56864E-02    ( -0.0765797   0.626469 )
------------------------------------------------------------
#Fit statistic : Chi-Squared =          64.77 using 59 PHA bins.
# Reduced chi-squared =          1.157 for     56 degrees of freedom
# Null hypothesis probability =   1.973434e-01

Photon flux (15-150 keV)    in 1 sec: 0.996860 ( -0.140533  0.14196 ) ph/cm2/s
Energy fluence (15-150 keV)             : 5.84153e-08 ( -1.03252e-08  1.22419e-08 ) ergs/cm2
Band function

Time interval is from   -0.114 sec. to    0.886 sec.

Spectral model in the Band function:
------------------------------------------------------------
Parameters  : value       lower 90%   higher 90%
alpha       : -0.369154   ( -1.06671   0.304382 )
beta        : -3.15228    ( 3.38365   1.28044 )
Epeak [keV] : 43.9542      ( -12.7328 13.2197 )
Norm@50keV   : 5.62460E-02    ( -0.0507384   139.853 )
------------------------------------------------------------
#Fit statistic : Chi-Squared =          64.61 using 59 PHA bins.
# Reduced chi-squared =          1.175 for     55 degrees of freedom
# Null hypothesis probability =   1.759933e-01

Photon flux (15-150 keV)    in 1 sec:  (    ) ph/cm2/s
Energy fluence (15-150 keV)             : 5.99114e-08 ( 0  0 ) ergs/cm2
Single BB

Spectral model blackbody:
------------------------------------------------------------
Parameters  : value    Lower 90%  Upper 90%
kT [keV]    : 10.6798  (-1.34302  1.52808)
R^2/D10^2   : 0.408348  (-0.161669   0.264736)
(R is the radius in km and D10 is the distance to the source in units of 10 kpc)
------------------------------------------------------------
#Fit statistic : Chi-Squared =          67.50 using 59 PHA bins.
# Reduced chi-squared =          1.184 for     57 degrees of freedom
# Null hypothesis probability =   1.610729e-01

Energy  Fluence     90% Error
[keV]   [erg/cm2]   [erg/cm2]
15- 25  9.668e-09   1.976e-09
25- 50  2.630e-08   4.445e-09
50-150  1.656e-08   5.558e-09
15-150  5.253e-08   9.465e-09
Thermal bremsstrahlung (OTTB)

Spectral model: thermal bremsstrahlung
------------------------------------------------------------
Parameters  : value         Lower 90%    Upper 90%
kT [keV]    : 76.1445       (-25.6073      50.5812)
Norm        : 5.07730       (-0.903871     1.12235)
------------------------------------------------------------
#Fit statistic : Chi-Squared =          66.98 using 59 PHA bins.
# Reduced chi-squared =          1.175 for     57 degrees of freedom
# Null hypothesis probability =   1.718100e-01

Energy  Fluence     90% Error
[keV]   [erg/cm2]   [erg/cm2]
15- 25  1.313e-08   2.310e-09
25- 50  2.135e-08   3.485e-09
50-150  2.914e-08   1.638e-08
15-150  6.361e-08   1.737e-08
Double BB
Spectral model: bbodyrad<1> + bbodyrad<2>
------------------------------------------------------------
Parameters  : value         Lower 90%    Upper 90%
kT1 [keV]   : 4.13765        (-3.95791      -4.15263)
R1^2/D10^2  : 4.98625        (-4.75355      -4.96388)
kT2 [keV]   : 12.4815        (-2.3808      -12.4884)
R2^2/D10^2  : 0.198778    (-0.194056   0.0775024)
------------------------------------------------------------
#Fit statistic : Chi-Squared =          64.16 using 59 PHA bins.
# Reduced chi-squared =          1.166 for     55 degrees of freedom
# Null hypothesis probability =   1.863018e-01

Energy  Fluence     90% Error
[keV]   [erg/cm2]   [erg/cm2]
15- 25  1.189e-08   6.105e-09
25- 50  2.374e-08   1.264e-08
50-150  2.080e-08   1.205e-08
15-150  5.644e-08   2.998e-08
Pre-slew spectrum (Pre-slew PHA with pre-slew DRM)
Power-law model

Spectral model in power-law:
------------------------------------------------------------
Parameters  : value       lower 90%   higher 90%
Photon index: 1.94994     ( -0.281251   0.309194 )
Norm@50keV  : 1.77828E-03    ( -0.000365808   0.000352793 )
------------------------------------------------------------
#Fit statistic : Chi-Squared =          71.26 using 59 PHA bins.
# Reduced chi-squared =          1.250 for     57 degrees of freedom
# Null hypothesis probability =   9.688762e-02

Photon flux (15-150 keV)    in 10.12 sec: 0.260786 ( -0.0397194  0.0397206 ) ph/cm2/s
Energy fluence (15-150 keV)             : 1.65613e-07 ( -3.1773e-08  3.30267e-08 ) ergs/cm2
Cutoff power-law model

Spectral model in the cutoff power-law:
------------------------------------------------------------
Parameters  : value       lower 90%   higher 90%
Photon index: 1.43120     ( -1.2889   0.823915 )
Epeak [keV] : 46.1480      (   )
Norm@50keV  : 3.54482E-03    (     )
------------------------------------------------------------
#Fit statistic : Chi-Squared =          70.55 using 59 PHA bins.
# Reduced chi-squared =          1.260 for     56 degrees of freedom
# Null hypothesis probability =   9.125258e-02

Photon flux (15-150 keV)    in 10.12 sec: 0.256333 ( -0.040434  0.040588 ) ph/cm2/s
Energy fluence (15-150 keV)             : 1.5744e-07 ( -3.37229e-08  3.65929e-08 ) ergs/cm2
Band function

Spectral model in the Band function:
------------------------------------------------------------
Parameters  : value       lower 90%   higher 90%
alpha       : -1.43104   ( -1.72598   1.4421 )
beta        : -10.0000    ( 10   3.55271e-15 )
Epeak [keV] : 46.1254      ( -23.2734 -46.1254 )
Norm@50keV   : 3.54541E-03    ( -0.00194298   0.0163448 )
------------------------------------------------------------
#Fit statistic : Chi-Squared =          70.55 using 59 PHA bins.
# Reduced chi-squared =          1.283 for     55 degrees of freedom
# Null hypothesis probability =   7.712773e-02

Photon flux (15-150 keV)    in 10.12 sec: 0.257956 ( 6.74204  -0.042435 ) ph/cm2/s
Energy fluence (15-150 keV)             : 1.56435e-07 ( -1.56364e-07  -3.29244e-08 ) ergs/cm2
S(25-50 keV) vs. S(50-100 keV) plot
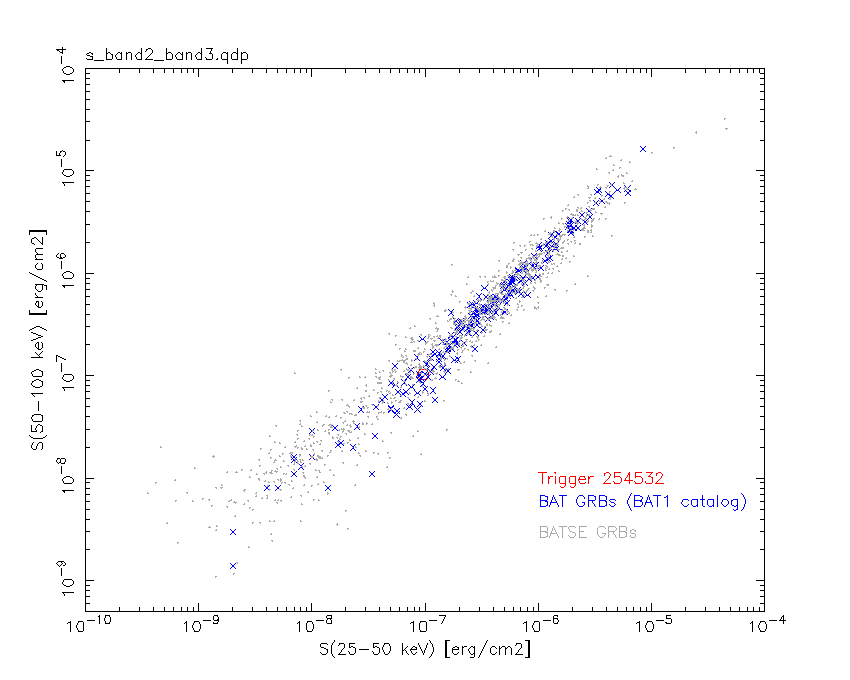
S(25-50 keV)  = 9.58e-08
S(50-100 keV) = 1.03e-07
T90 vs. Hardness ratio plot

T90                                   = 18.4079999923706 sec.
Hardness ratio (energy fluence ratio) = 1.07516
Color vs. Color plot
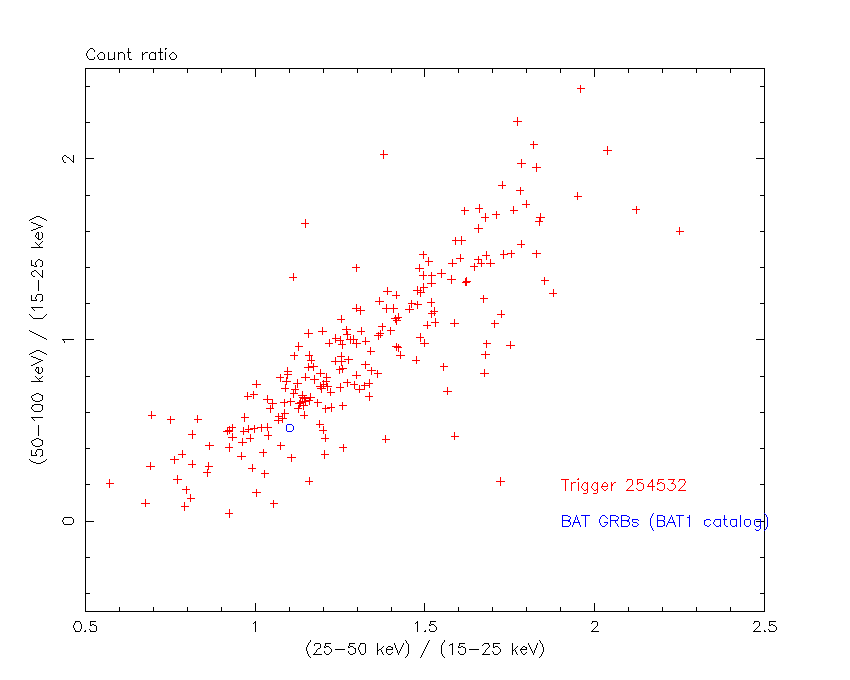
Count Ratio  (25-50 keV) / (15-25 keV) = 1.10195
Count Ratio (50-100 keV) / (15-25 keV) = 0.514163
Mask shadow pattern

IMX = -2.419172814421541E-01, IMY = 2.770127678884092E-01
TIME vs. PHA plot around the trigger time
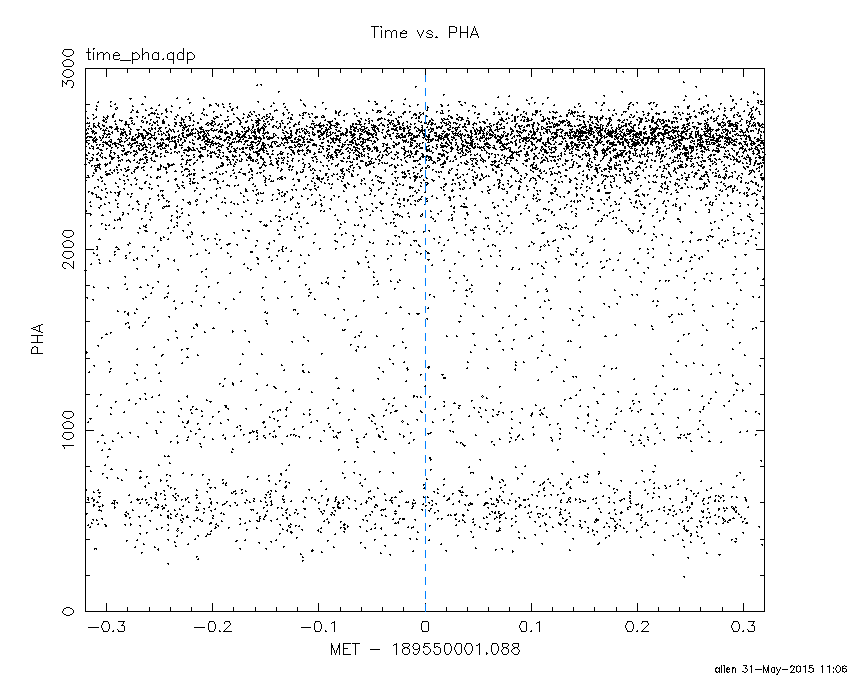
Blue+Cyan dotted lines: Time interval of the scaled map
From 0.000000 to 0.512000
TIME vs. DetID plot around the trigger time
Blue+Cyan dotted lines: Time interval of the scaled map
From 0.000000 to 0.512000
100 us light curve (15-350 keV)
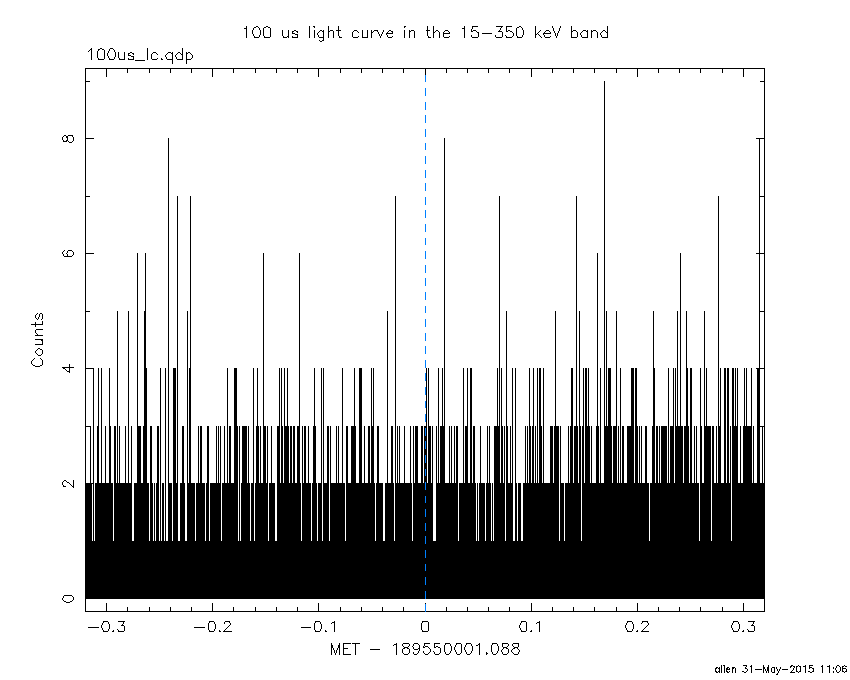
Blue+Cyan dotted lines: Time interval of the scaled map
From 0.000000 to 0.512000
Spacecraft aspect plot

Bright source in the pre-burst/pre-slew/post-slew images
Pre-burst image of 15-350 keV band
Time interval of the image:
-239.088000 -0.104000

# RAcent  DECcent POSerr Theta    Phi  PeakCts   SNR AngSep     Name
#  [deg]    [deg]    ['] [deg]  [deg]                   [']
299.5828  35.1855    0.6  44.7  -48.6   9.8475  19.0    1.0	Cyg X-1
308.1309  41.0245   12.9  35.9  -46.0   0.2495   0.9    4.4	Cyg X-3
326.1929  38.1861    4.8  24.9  -63.8   0.5606   2.4    8.2	Cyg X-2
 42.8401  50.4502    3.0  29.4   99.9   1.0168   3.9 ------	UNKNOWN
359.4037  70.2435    2.7  23.7   35.2   0.7956   4.3 ------	UNKNOWN
 15.4779   8.8733    2.5  40.4 -172.7   1.1605   4.6 ------	UNKNOWN
  7.2973  -0.5303    2.6  47.7 -158.1   1.6653   4.5  439.0	UNKNOWN
  8.6740  -5.4397    2.1  52.8 -158.9   2.8615   5.5 ------	UNKNOWN
308.0941  37.6669    1.8  37.5  -50.9   2.0160   6.3 ------	UNKNOWN
357.8252  -8.6962    2.8  55.2 -145.4   4.3965   4.2  537.7	UNKNOWN
Pre-slew background subtracted image of 15-350 keV band
Time interval of the image:
-0.104000 10.012590

# RAcent  DECcent POSerr Theta    Phi  PeakCts   SNR AngSep     Name
#  [deg]    [deg]    ['] [deg]  [deg]                   [']
299.7290  35.0551    9.6  44.6  -48.9  -0.1071  -1.2   11.1	Cyg X-1
308.0131  41.0517    6.2  36.0  -45.8   0.0876   1.9    7.4	Cyg X-3
326.3375  38.4093    5.1  24.7  -63.4  -0.0864  -2.3    9.4	Cyg X-2
352.5685  26.8220    1.3  20.2 -131.1   0.2914   9.2 ------	UNKNOWN
 11.6332   1.1824    2.2  46.8 -164.4   0.2881   5.1 ------	UNKNOWN
Post-slew image of 15-350 keV band
Time interval of the image:
52.412600 435.196900
435.912000 963.029600

# RAcent  DECcent POSerr Theta    Phi  PeakCts   SNR AngSep     Name
#  [deg]    [deg]    ['] [deg]  [deg]                   [']
299.5804  35.2042    0.4  45.6  -35.6  33.2921  31.3    0.5	Cyg X-1
308.0968  40.8624   15.1  39.0  -27.1  -0.5102  -0.8    5.4	Cyg X-3
326.0795  38.3210    2.2  24.9  -25.8   2.2329   5.3    4.3	Cyg X-2
 24.9585  32.8486    3.5  28.6  100.4   2.2291   3.3 ------	UNKNOWN
 18.4903 -25.7780    4.0  58.3 -177.3  10.0224   2.9 ------	UNKNOWN
308.0221  37.6736    1.6  38.8  -32.2   5.2767   7.2 ------	UNKNOWN
Plot creation:
Sun May 31 11:06:14 EDT 2015