Click here for the BAT GCN circular template
Image
Pre-slew 15.0-350.0 keV image (Event data)
#   RAcent    DECcent   POSerr    Theta     Phi              Peak Cts       SNR   Name
    0.9265   -52.9715   0.0076    20.9015   -11.1292         2.0499812     25.233 TRIG_00255445

Foreground time interval of the image:
 -2.744  40.637 (delta_t =  43.381 [sec])
Background time interval of the image:
-57.563  -2.744 (delta_t =  54.819 [sec])
Lightcurves
Notes:
- 1) The mask-weighted light curves are using the flight position.
- 2) Multiple plots of different time binning/intervals are shown to cover all scenarios of short/long GRBs, rate/image triggers, and real/false positives.
- 3) For all the mask-weighted lightcurves, the y-axis units are counts/sec/det where a det is 0.4 x 0.4 = 0.16 sq cm.
- 4) The verticle lines correspond to following: green dotted lines are T50 interval, black dotted lines are T90 interval, blue solid line(s) is a spacecraft slew start time, and orange solid line(s) is a spacecraft slew end time.
- 5) Time of each bin is in the middle of the bin.
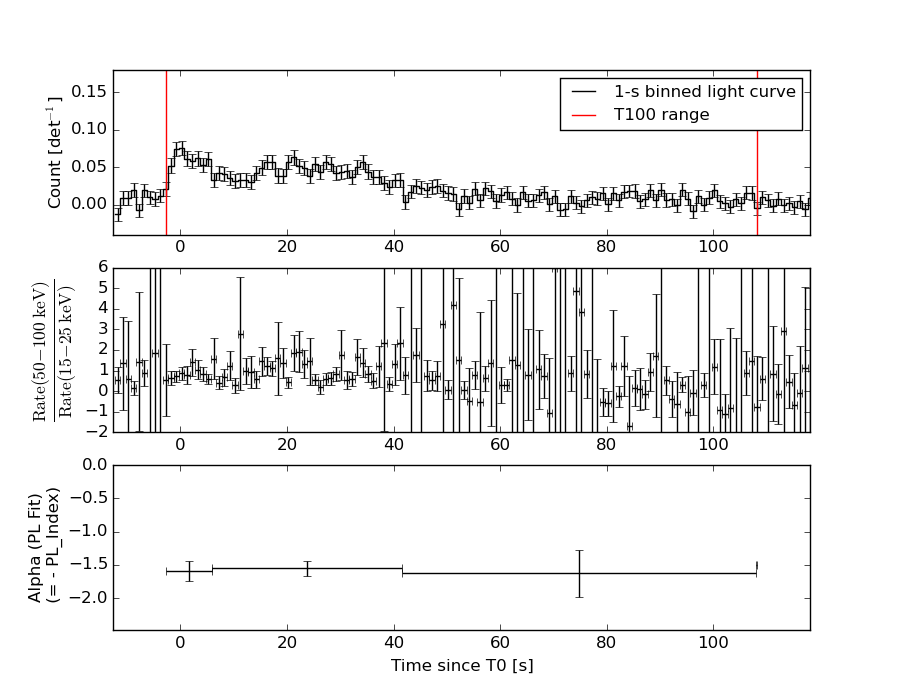
1 s binning
From T0-310 s to T0+310 s
From T100_start - 20 s to T100_end + 30 s

Full time interval
64 ms binning
Full time interval
From T100_start to T100_end

From T0-5 sec to T0+5 sec
16 ms binning
From T100_start-5 s to T100_start+5 s
Blue+Cyan dotted lines: Time interval of the scaled map
From 0.000000 to 3.072000
8 ms binning
From T100_start-3 s to T100_start+3 s
Blue+Cyan dotted lines: Time interval of the scaled map
From 0.000000 to 3.072000
2 ms binning
From T100_start-1 s to T100_start+1 s
Blue+Cyan dotted lines: Time interval of the scaled map
From 0.000000 to 3.072000
SN=5 or 10 sec. binning (whichever binning is satisfied first)
SN=5 or 10 sec. binning (T < 200 sec)
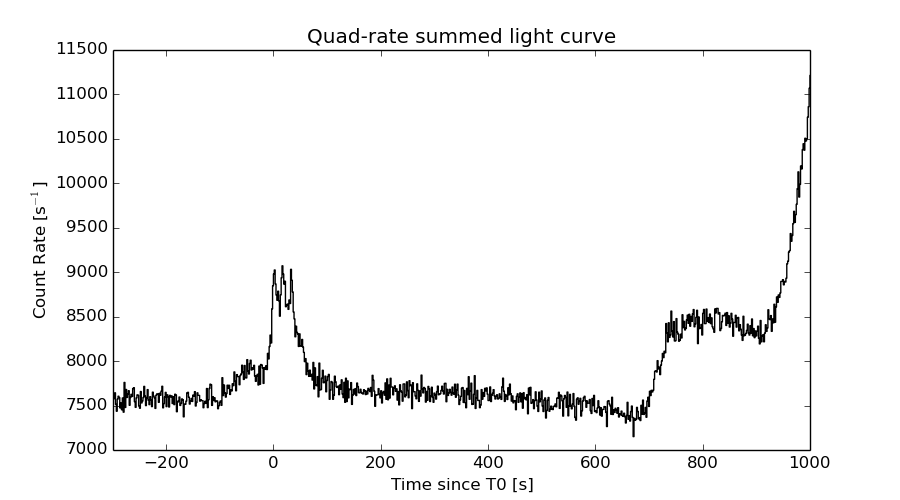
Quad-rate summed light curves (from T0-300s to T0+1000s)
Spectral Evolution
Spectra
Notes:
- 1) The fitting includes the systematic errors.
- 2) When the burst includes telescope slew time periods, the fitting uses an average response file made from multiple 5-s response files through out the slew time plus single time preiod for the non-slew times, and weighted by the total counts in the corresponding time period using addrmf. An average response file is needed becuase a spectral fit using the pre-slew DRM will introduce some errors in both a spectral shape and a normalization if the PHA file contains a lot of the slew/post-slew time interval.
- 3) For fits to more complicated models (e.g. a power-law over a cutoff power-law), the BAT team has decided to require a chi-square improvement of more than 6 for each extra dof.
Time averaged spectrum fit using the average DRM
Power-law model

Time interval is from   -2.744 sec. to  108.176 sec.

Spectral model in power-law:
------------------------------------------------------------
Parameters  : value       lower 90%   higher 90%
Photon index: 1.56663     ( -0.11284   0.113635 )
Norm@50keV  : 1.56081E-03    ( -9.54675e-05   9.49271e-05 )
------------------------------------------------------------
#Fit statistic : Chi-Squared =          36.86 using 59 PHA bins.
# Reduced chi-squared =         0.6466 for     57 degrees of freedom
# Null hypothesis probability =   9.823697e-01

Photon flux (15-150 keV)    in 110.9 sec: 0.198554 ( -0.0119193  0.0119584 ) ph/cm2/s
Energy fluence (15-150 keV)             : 1.62576e-06 ( -1.08748e-07  1.09641e-07 ) ergs/cm2
Cutoff power-law model

Time interval is from   -2.744 sec. to  108.176 sec.
Spectral model in the cutoff power-law:
------------------------------------------------------------
Parameters  : value       lower 90%   higher 90%
Photon index: 1.56928     ( -0.259665   0.11142 )
Epeak [keV] : 9999.31      ( -9999.36 -9999.36 )
Norm@50keV  : 1.55564E-03    ( -0.000713982   0.000555079 )
------------------------------------------------------------
#Fit statistic : Chi-Squared =          36.90 using 59 PHA bins.
# Reduced chi-squared =         0.6589 for     56 degrees of freedom
# Null hypothesis probability =   9.772045e-01

Photon flux (15-150 keV)    in 110.9 sec: 0.198467 ( -0.011897  0.011943 ) ph/cm2/s
Energy fluence (15-150 keV)             : 1.62551e-06 ( -5.47402e-08  1.06641e-07 ) ergs/cm2
Band function
Time interval is from   -2.744 sec. to  108.176 sec.

Spectral model in the Band function:
------------------------------------------------------------
Parameters  : value       lower 90%   higher 90%
alpha       : -1.28004   ( 1.28004   1.28004 )
beta        : -1.56662    ( -0.113695   0.112708 )
Epeak [keV] : 26.1539      ( -26.1557 -26.1557 )
Norm@50keV   : 3.25920E-03    ( -0.00129853   0.221779 )
------------------------------------------------------------
#Fit statistic : Chi-Squared =          36.86 using 59 PHA bins.
# Reduced chi-squared =         0.6702 for     55 degrees of freedom
# Null hypothesis probability =   9.714273e-01

Photon flux (15-150 keV)    in 110.9 sec:  (    ) ph/cm2/s
Energy fluence (15-150 keV)             : 0 ( 0  0 ) ergs/cm2
Single BB

Spectral model blackbody:
------------------------------------------------------------
Parameters  : value    Lower 90%  Upper 90%
kT [keV]    : 14.2911  (  )
R^2/D10^2   : 2.50911E-02  (   )
(R is the radius in km and D10 is the distance to the source in units of 10 kpc)
------------------------------------------------------------
#Fit statistic : Chi-Squared =         122.55 using 59 PHA bins.
# Reduced chi-squared =         2.1499 for     57 degrees of freedom
# Null hypothesis probability =   1.071480e-06

Energy  Fluence     90% Error
[keV]   [erg/cm2]   [erg/cm2]
15- 25  1.198e-07   1.383e-08
25- 50  4.546e-07   3.222e-08
50-150  6.177e-07   7.780e-08
15-150  1.192e-06   8.340e-08
Thermal bremsstrahlung (OTTB)
Spectral model: thermal bremsstrahlung
------------------------------------------------------------
Parameters  : value         Lower 90%    Upper 90%
kT [keV]    : 199.216       (-52.2401      -199.289)
Norm        : 0.800249       (-0.0460893     0.0473632)
------------------------------------------------------------
#Fit statistic : Chi-Squared =          40.15 using 59 PHA bins.
# Reduced chi-squared =         0.7045 for     57 degrees of freedom
# Null hypothesis probability =   9.557077e-01

Energy  Fluence     90% Error
[keV]   [erg/cm2]   [erg/cm2]
15- 25  2.210e-07   1.686e-08
25- 50  4.251e-07   4.031e-08
50-150  9.321e-07   2.209e-07
15-150  1.578e-06   2.734e-07
Double BB
Spectral model: bbodyrad<1> + bbodyrad<2>
------------------------------------------------------------
Parameters  : value         Lower 90%    Upper 90%
kT1 [keV]   : 6.49514        (-1.26802      1.4626)
R1^2/D10^2  : 0.291506        (-0.146114      0.363702)
kT2 [keV]   : 27.6891        (-5.40419      10.1015)
R2^2/D10^2  : 2.07510E-03    (-0.0013162   0.00239115)
------------------------------------------------------------
#Fit statistic : Chi-Squared =          41.64 using 59 PHA bins.
# Reduced chi-squared =         0.7571 for     55 degrees of freedom
# Null hypothesis probability =   9.081373e-01

Energy  Fluence     90% Error
[keV]   [erg/cm2]   [erg/cm2]
15- 25  2.303e-07   4.708e-08
25- 50  4.100e-07   7.175e-08
50-150  9.898e-07   2.597e-07
15-150  1.630e-06   3.380e-07
Peak spectrum fit
Power-law model
Time interval is from   -0.768 sec. to    0.232 sec.

Spectral model in power-law:
------------------------------------------------------------
Parameters  : value       lower 90%   higher 90%
Photon index: 1.46378     ( -0.337905   0.34199 )
Norm@50keV  : 4.95676E-03    ( -0.00101083   0.000996386 )
------------------------------------------------------------
#Fit statistic : Chi-Squared =          58.02 using 59 PHA bins.
# Reduced chi-squared =          1.018 for     57 degrees of freedom
# Null hypothesis probability =   4.376484e-01

Photon flux (15-150 keV)    in 1 sec: 0.612967 ( -0.119773  0.11991 ) ph/cm2/s
Energy fluence (15-150 keV)             : 4.73141e-08 ( -1.05492e-08  1.08316e-08 ) ergs/cm2
Cutoff power-law model
Time interval is from   -0.768 sec. to    0.232 sec.
Spectral model in the cutoff power-law:
------------------------------------------------------------
Parameters  : value       lower 90%   higher 90%
Photon index: 0.986413     ( -1.90256   0.804703 )
Epeak [keV] : 99.0413      ( -99.1669 -99.1669 )
Norm@50keV  : 8.94256E-03    ( -0.00491066   0.0851642 )
------------------------------------------------------------
#Fit statistic : Chi-Squared =          57.68 using 59 PHA bins.
# Reduced chi-squared =          1.030 for     56 degrees of freedom
# Null hypothesis probability =   4.127833e-01

Photon flux (15-150 keV)    in 1 sec: 0.601219 ( -0.125851  0.123225 ) ph/cm2/s
Energy fluence (15-150 keV)             : 4.50577e-08 ( -1.23982e-08  1.24196e-08 ) ergs/cm2
Band function

Time interval is from   -0.768 sec. to    0.232 sec.

Spectral model in the Band function:
------------------------------------------------------------
Parameters  : value       lower 90%   higher 90%
alpha       : -0.387731   ( 0.530068   5.45875 )
beta        : -1.79077    ( 1.80303   0.627024 )
Epeak [keV] : 59.7054      ( -59.5361 180.45 )
Norm@50keV   : 2.09844E-02    ( -0.0219934   170.596 )
------------------------------------------------------------
#Fit statistic : Chi-Squared =          57.27 using 59 PHA bins.
# Reduced chi-squared =          1.041 for     55 degrees of freedom
# Null hypothesis probability =   3.909608e-01

Photon flux (15-150 keV)    in 1 sec:  (    ) ph/cm2/s
Energy fluence (15-150 keV)             : 4.51407e-08 ( 0  0 ) ergs/cm2
Single BB
Spectral model blackbody:
------------------------------------------------------------
Parameters  : value    Lower 90%  Upper 90%
kT [keV]    : 13.6699  (-2.93229  4.08421)
R^2/D10^2   : 9.71768E-02  (-0.058534   0.132035)
(R is the radius in km and D10 is the distance to the source in units of 10 kpc)
------------------------------------------------------------
#Fit statistic : Chi-Squared =          61.79 using 59 PHA bins.
# Reduced chi-squared =          1.084 for     57 degrees of freedom
# Null hypothesis probability =   3.091460e-01

Energy  Fluence     90% Error
[keV]   [erg/cm2]   [erg/cm2]
15- 25  3.843e-09   1.618e-09
25- 50  1.395e-08   5.128e-09
50-150  1.696e-08   7.631e-09
15-150  3.476e-08   1.253e-08
Thermal bremsstrahlung (OTTB)
Spectral model: thermal bremsstrahlung
------------------------------------------------------------
Parameters  : value         Lower 90%    Upper 90%
kT [keV]    : 199.363       (-109.504      -199.363)
Norm        : 2.51432       (-0.486418     0.486453)
------------------------------------------------------------
#Fit statistic : Chi-Squared =          57.85 using 59 PHA bins.
# Reduced chi-squared =          1.015 for     57 degrees of freedom
# Null hypothesis probability =   4.436342e-01

Energy  Fluence     90% Error
[keV]   [erg/cm2]   [erg/cm2]
15- 25  6.261e-09   3.655e-09
25- 50  1.204e-08   6.920e-09
50-150  2.641e-08   1.513e-08
15-150  4.472e-08   2.538e-08
Double BB
------------------------------------------------------------
Parameters  : value         Lower 90%    Upper 90%
kT1 [keV]   : 10.3069        (-6.90593      4.13333)
R1^2/D10^2  : 0.220321        (      )
kT2 [keV]   : 76.0132        (-80.3064      -80.3065)
R2^2/D10^2  : 3.46940E-04    (-0.000258591   0.0748803)
------------------------------------------------------------
#Fit statistic : Chi-Squared =          57.27 using 59 PHA bins.
#Fit statistic : Chi-Squared =          57.25 using 59 PHA bins.
# Reduced chi-squared =          1.041 for     55 degrees of freedom
# Reduced chi-squared =          1.041 for     55 degrees of freedom
# Null hypothesis probability =   3.908624e-01
# Null hypothesis probability =   3.917281e-01

Energy  Fluence     90% Error
[keV]   [erg/cm2]   [erg/cm2]
15- 25  5.068e-09   2.937e-09
25- 50  1.358e-08   8.445e-09
50-150  2.786e-08   1.363e-08
15-150  4.651e-08   2.270e-08
Pre-slew spectrum (Pre-slew PHA with pre-slew DRM)
Power-law model

Spectral model in power-law:
------------------------------------------------------------
Parameters  : value       lower 90%   higher 90%
Photon index: 1.57707     ( -0.0964588   0.0971689 )
Norm@50keV  : 3.00802E-03    ( -0.000160569   0.000159941 )
------------------------------------------------------------
#Fit statistic : Chi-Squared =          45.43 using 59 PHA bins.
# Reduced chi-squared =         0.7969 for     57 degrees of freedom
# Null hypothesis probability =   8.651913e-01

Photon flux (15-150 keV)    in 43.38 sec: 0.383850 ( -0.0203593  0.0203951 ) ph/cm2/s
Energy fluence (15-150 keV)             : 1.22388e-06 ( -7.08621e-08  7.13354e-08 ) ergs/cm2
Cutoff power-law model

Spectral model in the cutoff power-law:
------------------------------------------------------------
Parameters  : value       lower 90%   higher 90%
Photon index: 1.36476     ( -0.39919   0.261017 )
Epeak [keV] : 148.308      (   )
Norm@50keV  : 3.84884E-03    (     )
------------------------------------------------------------
#Fit statistic : Chi-Squared =          44.47 using 59 PHA bins.
# Reduced chi-squared =         0.7942 for     56 degrees of freedom
# Null hypothesis probability =   8.665496e-01

Photon flux (15-150 keV)    in 43.38 sec: 0.378823 ( -0.022081  0.022061 ) ph/cm2/s
Energy fluence (15-150 keV)             : 1.20068e-06 ( -8.22658e-08  8.0856e-08 ) ergs/cm2
Band function
Spectral model in the Band function:
------------------------------------------------------------
Parameters  : value       lower 90%   higher 90%
alpha       : -1.22376   ( 1.23212   1.23212 )
beta        : -1.72821    ( 1.72757   0.224619 )
Epeak [keV] : 97.8828      ( -101.945 -101.945 )
Norm@50keV   : 4.65408E-03    ( -0.00156817   0 )
------------------------------------------------------------
#Fit statistic : Chi-Squared =          44.32 using 59 PHA bins.
# Reduced chi-squared =         0.8058 for     55 degrees of freedom
# Null hypothesis probability =   8.480489e-01

Photon flux (15-150 keV)    in 43.38 sec:  (    ) ph/cm2/s
Energy fluence (15-150 keV)             : 0 ( 0  0 ) ergs/cm2
S(25-50 keV) vs. S(50-100 keV) plot
S(25-50 keV)  = 4.15e-07
S(50-100 keV) = 5.60e-07
T90 vs. Hardness ratio plot
T90                                   = 88.4280000030994 sec.
Hardness ratio (energy fluence ratio) = 1.3494
Color vs. Color plot
Count Ratio  (25-50 keV) / (15-25 keV) = 1.17336
Count Ratio (50-100 keV) / (15-25 keV) = 0.893607
Mask shadow pattern

IMX = 3.747115588397704E-01, IMY = 7.371383709429975E-02
TIME vs. PHA plot around the trigger time
Blue+Cyan dotted lines: Time interval of the scaled map
From 0.000000 to 3.072000
TIME vs. DetID plot around the trigger time
Blue+Cyan dotted lines: Time interval of the scaled map
From 0.000000 to 3.072000
100 us light curve (15-350 keV)

Blue+Cyan dotted lines: Time interval of the scaled map
From 0.000000 to 3.072000
Spacecraft aspect plot
Bright source in the pre-burst/pre-slew/post-slew images
Pre-burst image of 15-350 keV band
Time interval of the image:
-57.563390 -2.744000

# RAcent  DECcent POSerr Theta    Phi  PeakCts   SNR AngSep     Name
#  [deg]    [deg]    ['] [deg]  [deg]                   [']
170.5862 -60.5548    4.5  45.3  172.6   0.3372   2.6    9.0	Cen X-3
186.6460 -62.7570    1.0  43.8 -176.3   1.2888  11.4    0.9	GX 301-2
 59.3413 -39.1628    2.3  41.1   67.9   1.4723   5.0 ------	UNKNOWN
 20.5945 -23.8590    2.0  49.8   17.8   1.1835   5.6 ------	UNKNOWN
  0.3709 -29.3229    2.2  44.5   -7.0   0.6108   5.3 ------	UNKNOWN
332.7147 -58.7232    2.9  20.8  -59.2   0.2839   3.9 ------	UNKNOWN
320.6046 -43.8706    2.6  37.4  -60.1   0.6053   4.4 ------	UNKNOWN
227.2316 -48.9431    4.2  55.2 -145.2   1.0934   2.7 ------	UNKNOWN
Pre-slew background subtracted image of 15-350 keV band
Time interval of the image:
-2.744000 40.636630

# RAcent  DECcent POSerr Theta    Phi  PeakCts   SNR AngSep     Name
#  [deg]    [deg]    ['] [deg]  [deg]                   [']
170.4687 -60.4944    4.2  45.4  172.5  -0.4294  -2.8    8.9	Cen X-3
186.7246 -62.8424    2.9  43.7 -176.2   0.5550   4.0    4.7	GX 301-2
 13.0809 -54.7567    2.7  18.7    9.8   0.3669   4.3 ------	UNKNOWN
  0.9265 -52.9715    0.5  20.9  -11.1   2.0498  25.2 ------	UNKNOWN
Post-slew image of 15-350 keV band
Time interval of the image:
82.836600 675.136600

# RAcent  DECcent POSerr Theta    Phi  PeakCts   SNR AngSep     Name
#  [deg]    [deg]    ['] [deg]  [deg]                   [']
154.7604 -70.4778    2.9  55.1  167.6   6.6128   4.0 ------	UNKNOWN
 11.1207 -45.7881    2.6   9.7   44.7   1.2444   4.5 ------	UNKNOWN
183.8820 -70.1001    2.8  56.9  179.1   7.0378   4.2 ------	UNKNOWN
246.8515 -70.8570    3.0  47.7 -158.2   2.5203   3.8 ------	UNKNOWN
337.4561 -19.3369    2.7  38.2  -39.5   2.1996   4.2 ------	UNKNOWN
250.6617 -58.3629    7.6  55.2 -145.3   3.8976   1.5 ------	UNKNOWN
Plot creation:
Sun May 31 11:01:26 EDT 2015