Special notes of this burst
Image
Pre-slew 15.0-350.0 keV image (Event data)

#   RAcent    DECcent   POSerr    Theta     Phi              Peak Cts       SNR   Name
   33.4936   -73.5482   0.0450     6.0638    91.9942         0.3034612      4.256 TRIG_00257741

Foreground time interval of the image:
  0.000  64.000 (delta_t =  64.000 [sec])
Background time interval of the image:
Lightcurves
Notes:
- 1) The mask-weighted light curves are using the flight position.
- 2) Multiple plots of different time binning/intervals are shown to cover all scenarios of short/long GRBs, rate/image triggers, and real/false positives.
- 3) For all the mask-weighted lightcurves, the y-axis units are counts/sec/det where a det is 0.4 x 0.4 = 0.16 sq cm.
- 4) The verticle lines correspond to following: green dotted lines are T50 interval, black dotted lines are T90 interval, blue solid line(s) is a spacecraft slew start time, and orange solid line(s) is a spacecraft slew end time.
- 5) Time of each bin is in the middle of the bin.
1 s binning
From T0-310 s to T0+310 s

From T100_start - 20 s to T100_end + 30 s
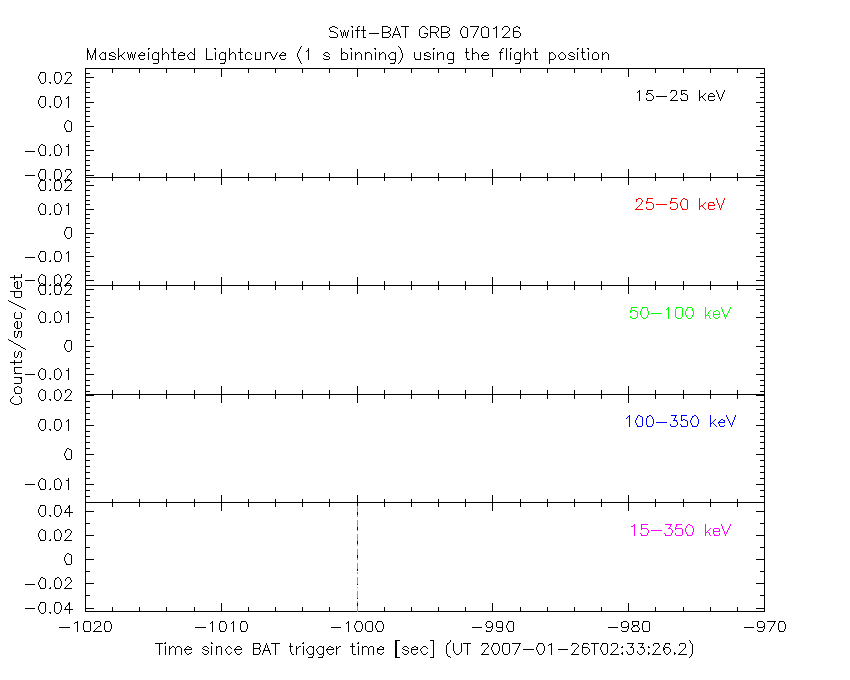
Full time interval

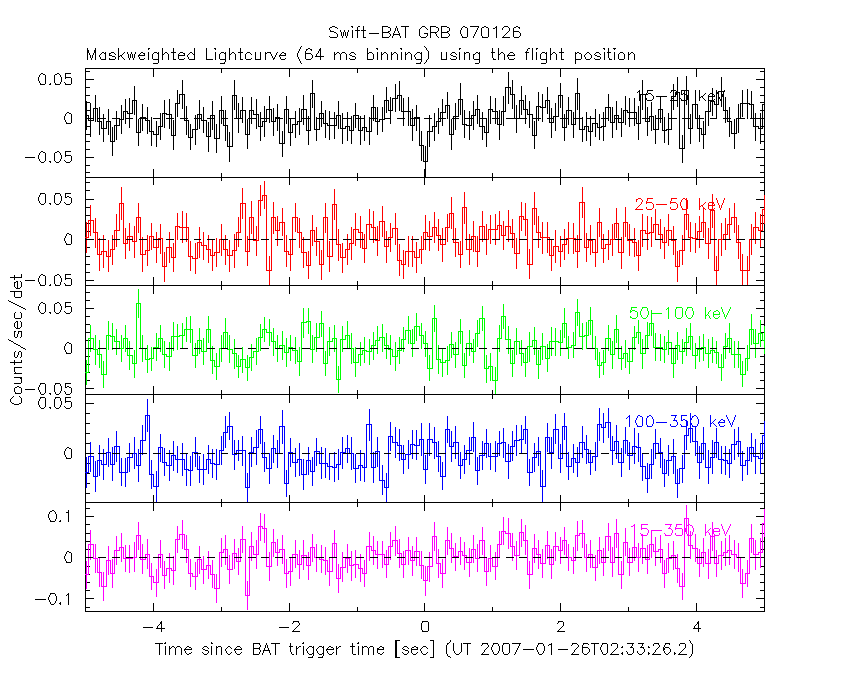
64 ms binning
Full time interval

From T100_start to T100_end

From T0-5 sec to T0+5 sec
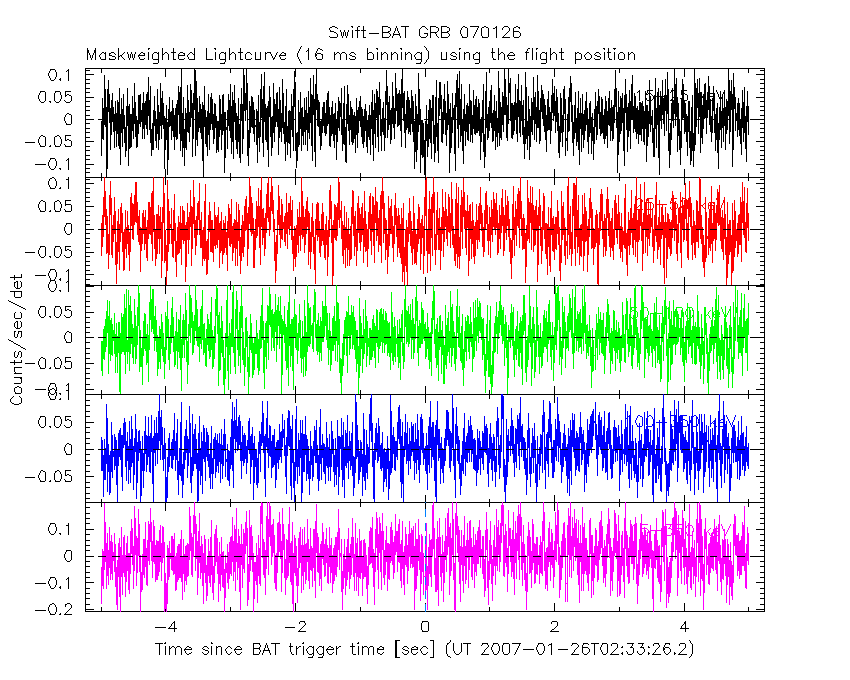
16 ms binning
From T100_start-5 s to T100_start+5 s
Blue+Cyan dotted lines: Time interval of the scaled map
From 0.000000 to 64.000000
8 ms binning
From T100_start-3 s to T100_start+3 s

Blue+Cyan dotted lines: Time interval of the scaled map
From 0.000000 to 64.000000
2 ms binning
From T100_start-1 s to T100_start+1 s

Blue+Cyan dotted lines: Time interval of the scaled map
From 0.000000 to 64.000000
SN=5 or 10 sec. binning (whichever binning is satisfied first)

SN=5 or 10 sec. binning (T < 200 sec)

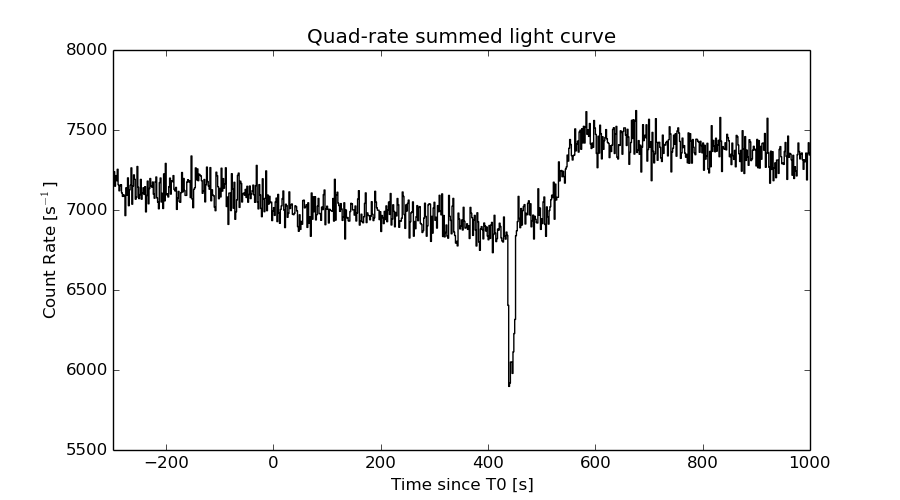
Quad-rate summed light curves (from T0-300s to T0+1000s)
Spectral Evolution

Spectra
Notes:
- 1) The fitting includes the systematic errors.
- 2) When the burst includes telescope slew time periods, the fitting uses an average response file made from multiple 5-s response files through out the slew time plus single time preiod for the non-slew times, and weighted by the total counts in the corresponding time period using addrmf. An average response file is needed becuase a spectral fit using the pre-slew DRM will introduce some errors in both a spectral shape and a normalization if the PHA file contains a lot of the slew/post-slew time interval.
- 3) For fits to more complicated models (e.g. a power-law over a cutoff power-law), the BAT team has decided to require a chi-square improvement of more than 6 for each extra dof.
Time averaged spectrum fit using the average DRM
Power-law model
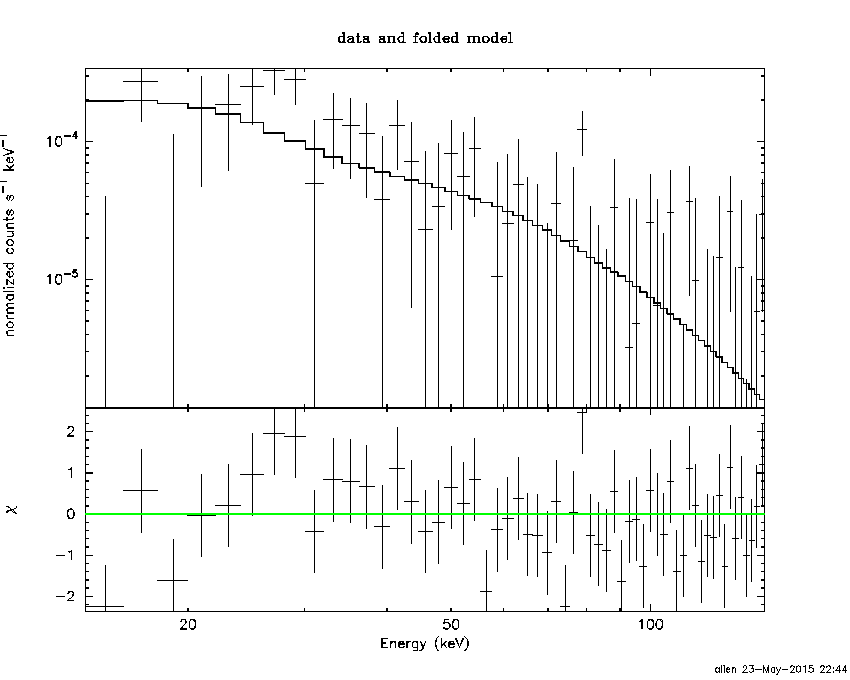
Time interval is from    0.000 sec. to   64.000 sec.

Spectral model in power-law:
------------------------------------------------------------
Parameters  : value       lower 90%   higher 90%
Photon index: 1.88105     ( -0.467696   0.537371 )
Norm@50keV  : 2.74146E-04    ( -0.000106895   0.0001081 )
------------------------------------------------------------
#Fit statistic : Chi-Squared =          57.59 using 59 PHA bins.
# Reduced chi-squared =          1.010 for     57 degrees of freedom
# Null hypothesis probability =   4.530562e-01

Photon flux (15-150 keV)    in 64 sec: 3.90383E-02 ( -0.0126674  0.0126817 ) ph/cm2/s
Energy fluence (15-150 keV)             : 1.61865e-07 ( -6.08434e-08  6.59955e-08 ) ergs/cm2
Cutoff power-law model
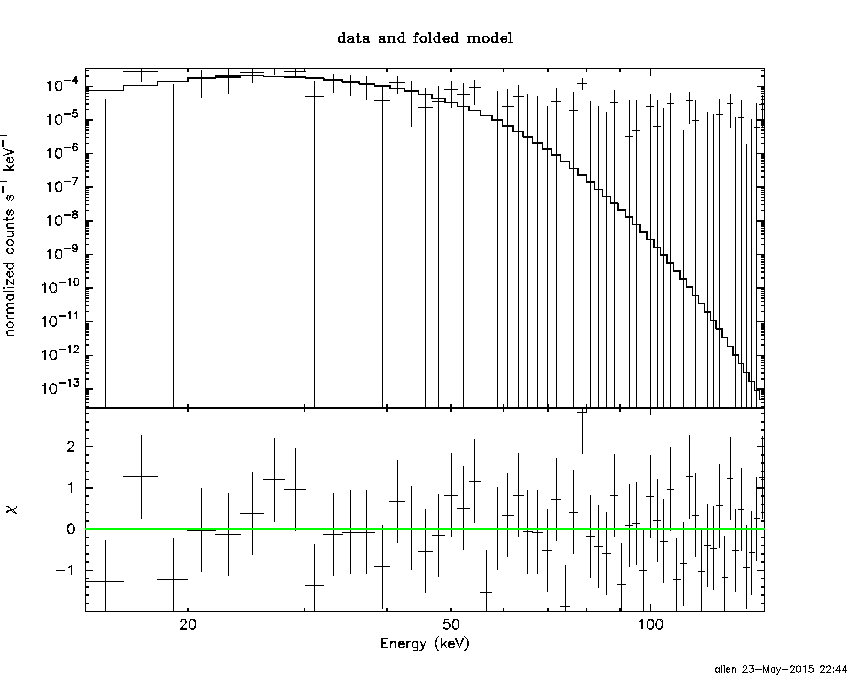
Time interval is from    0.000 sec. to   64.000 sec.
Spectral model in the cutoff power-law:
------------------------------------------------------------
Parameters  : value       lower 90%   higher 90%
Photon index: -7.01104     (     )
Epeak [keV] : 33.4600      ( -4.60292 5.9848 )
Norm@50keV  : 170.039    ( -187.559   22949.8 )
------------------------------------------------------------
#Fit statistic : Chi-Squared =          46.27 using 59 PHA bins.
# Reduced chi-squared =         0.8263 for     56 degrees of freedom
# Null hypothesis probability =   8.197742e-01

Photon flux (15-150 keV)    in 64 sec: 3.72834E-02 ( -0.0108452  0.0114898 ) ph/cm2/s
Energy fluence (15-150 keV)             : 1.17266e-07 ( -3.5369e-08  4.22502e-08 ) ergs/cm2
Band function
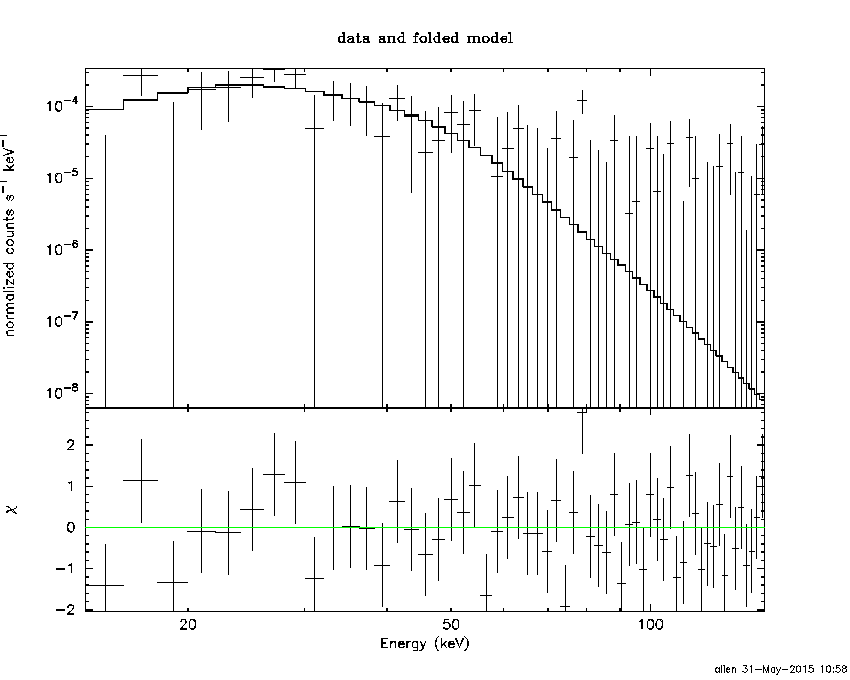
Time interval is from    0.000 sec. to   64.000 sec.

Spectral model in the Band function:
------------------------------------------------------------
Parameters  : value       lower 90%   higher 90%
alpha       : 5.00000   ( -3.91092   -5 )
beta        : -6.52331    ( 6.51029   15.7261 )
Epeak [keV] : 34.4303      ( -6.52214 6.13091 )
Norm@50keV   : 7.83853    ( -2.12497   21.3929 )
------------------------------------------------------------
#Fit statistic : Chi-Squared =          46.52 using 59 PHA bins.
# Reduced chi-squared =         0.8458 for     55 degrees of freedom
# Null hypothesis probability =   7.852043e-01

Photon flux (15-150 keV)    in 64 sec:  (    ) ph/cm2/s
Energy fluence (15-150 keV)             : 0 ( 0  0 ) ergs/cm2
Single BB

Spectral model blackbody:
------------------------------------------------------------
Parameters  : value    Lower 90%  Upper 90%
kT [keV]    : 9.35875  (-1.9317  2.57899)
R^2/D10^2   : 2.83900E-02  (-0.0175342   0.039736)
(R is the radius in km and D10 is the distance to the source in units of 10 kpc)
------------------------------------------------------------
#Fit statistic : Chi-Squared =          48.81 using 59 PHA bins.
# Reduced chi-squared =         0.8563 for     57 degrees of freedom
# Null hypothesis probability =   7.715464e-01

Energy  Fluence     90% Error
[keV]   [erg/cm2]   [erg/cm2]
15- 25  3.158e-08   1.888e-08
25- 50  7.126e-08   4.234e-08
50-150  3.060e-08   2.225e-08
15-150  1.334e-07   7.629e-08
Thermal bremsstrahlung (OTTB)
Spectral model: thermal bremsstrahlung
------------------------------------------------------------
Parameters  : value         Lower 90%    Upper 90%
kT [keV]    : 60.1548       (-31.041      127.209)
Norm        : 0.213737       (-0.0811356     0.117621)
------------------------------------------------------------
#Fit statistic : Chi-Squared =          55.01 using 59 PHA bins.
# Reduced chi-squared =         0.9650 for     57 degrees of freedom
# Null hypothesis probability =   5.501889e-01

Energy  Fluence     90% Error
[keV]   [erg/cm2]   [erg/cm2]
15- 25  3.439e-08   2.119e-08
25- 50  5.239e-08   3.126e-08
50-150  5.974e-08   5.619e-08
15-150  1.465e-07   9.885e-08
Double BB

Spectral model: bbodyrad<1> + bbodyrad<2>
------------------------------------------------------------
Parameters  : value         Lower 90%    Upper 90%
kT1 [keV]   : 9.81690E-02        (-0.098169      -0.098169)
R1^2/D10^2  : 8.73608E-05        (-8.7361e-05      -8.7361e-05)
kT2 [keV]   : 9.35900        (-1.93151      2.57918)
R2^2/D10^2  : 2.83872E-02    (-0.0175364   0.0397339)
------------------------------------------------------------
#Fit statistic : Chi-Squared =          48.81 using 59 PHA bins.
# Reduced chi-squared =         0.8875 for     55 degrees of freedom
# Null hypothesis probability =   7.087276e-01

Energy  Fluence     90% Error
[keV]   [erg/cm2]   [erg/cm2]
15- 25  0.000e+00   0.000e+00
25- 50  0.000e+00   0.000e+00
50-150  0.000e+00   0.000e+00
15-150  0.000e+00   0.000e+00
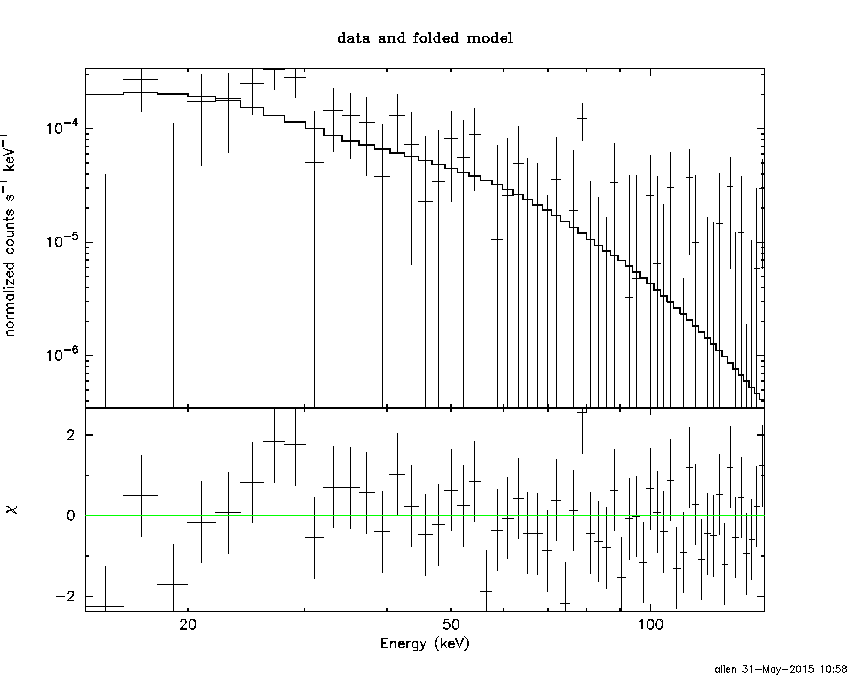
Pre-slew spectrum (Pre-slew PHA with pre-slew DRM)
Power-law model

Spectral model in power-law:
------------------------------------------------------------
Parameters  : value       lower 90%   higher 90%
Photon index: 1.88105     ( -0.467696   0.537371 )
Norm@50keV  : 2.74146E-04    ( -0.000106895   0.0001081 )
------------------------------------------------------------
#Fit statistic : Chi-Squared =          57.59 using 59 PHA bins.
# Reduced chi-squared =          1.010 for     57 degrees of freedom
# Null hypothesis probability =   4.530562e-01

Photon flux (15-150 keV)    in 64 sec: 3.90383E-02 ( -0.0126674  0.0126817 ) ph/cm2/s
Energy fluence (15-150 keV)             : 1.61865e-07 ( -6.08434e-08  6.59955e-08 ) ergs/cm2
Cutoff power-law model

Spectral model in the cutoff power-law:
------------------------------------------------------------
Parameters  : value       lower 90%   higher 90%
Photon index: -7.01104     (     )
Epeak [keV] : 33.4600      ( -4.60292 5.9848 )
Norm@50keV  : 170.039    ( -187.559   22949.8 )
------------------------------------------------------------
#Fit statistic : Chi-Squared =          46.27 using 59 PHA bins.
# Reduced chi-squared =         0.8263 for     56 degrees of freedom
# Null hypothesis probability =   8.197742e-01

Photon flux (15-150 keV)    in 64 sec: 3.72834E-02 ( -0.0108452  0.0114898 ) ph/cm2/s
Energy fluence (15-150 keV)             : 1.17266e-07 ( -3.5369e-08  4.22502e-08 ) ergs/cm2
Band function

Spectral model in the Band function:
------------------------------------------------------------
Parameters  : value       lower 90%   higher 90%
alpha       : 5.00000   ( -3.91092   -5 )
beta        : -6.52331    ( 6.51029   15.7261 )
Epeak [keV] : 34.4303      ( -6.52214 6.13091 )
Norm@50keV   : 7.83853    ( -2.12497   21.3929 )
------------------------------------------------------------
#Fit statistic : Chi-Squared =          46.52 using 59 PHA bins.
# Reduced chi-squared =         0.8458 for     55 degrees of freedom
# Null hypothesis probability =   7.852043e-01

Photon flux (15-150 keV)    in 64 sec:  (    ) ph/cm2/s
Energy fluence (15-150 keV)             : 0 ( 0  0 ) ergs/cm2
S(25-50 keV) vs. S(50-100 keV) plot
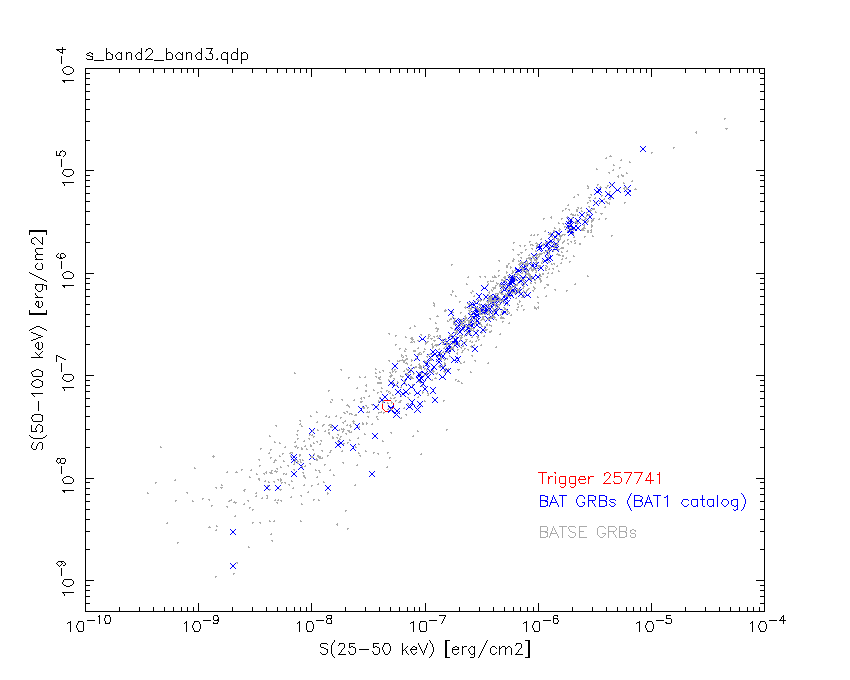
S(25-50 keV)  = 4.68e-08
S(50-100 keV) = 5.11e-08
T90 vs. Hardness ratio plot

T90                                   = 64 sec.
Hardness ratio (energy fluence ratio) = 1.09188
Color vs. Color plot

Count Ratio  (25-50 keV) / (15-25 keV) = 2.08272
Count Ratio (50-100 keV) / (15-25 keV) = 0.285186
Mask shadow pattern
IMX = -3.696553962752156E-03, IMY = -1.061658211320078E-01
TIME vs. PHA plot around the trigger time

Blue+Cyan dotted lines: Time interval of the scaled map
From 0.000000 to 64.000000
TIME vs. DetID plot around the trigger time

Blue+Cyan dotted lines: Time interval of the scaled map
From 0.000000 to 64.000000
100 us light curve (15-350 keV)
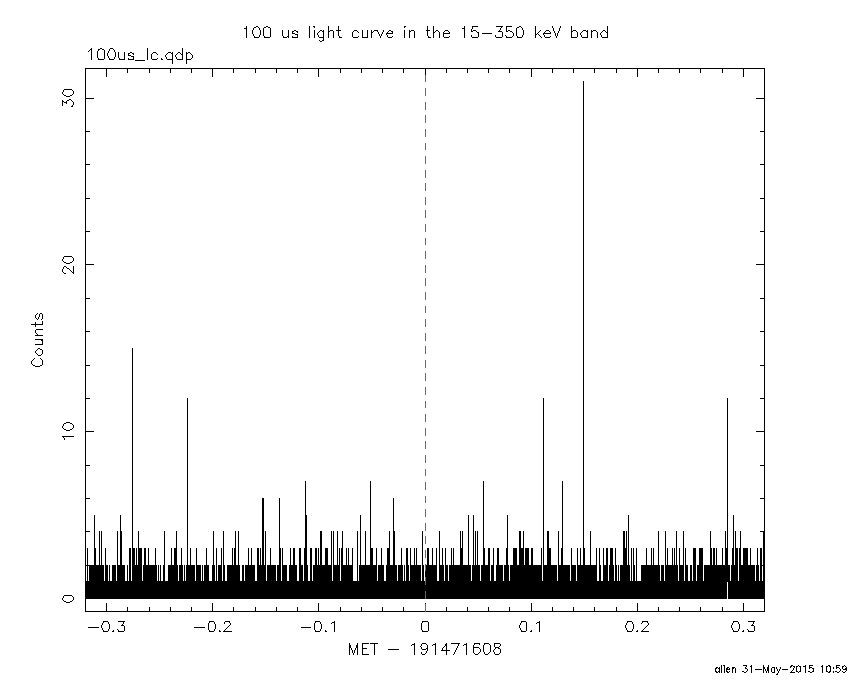
Blue+Cyan dotted lines: Time interval of the scaled map
From 0.000000 to 64.000000
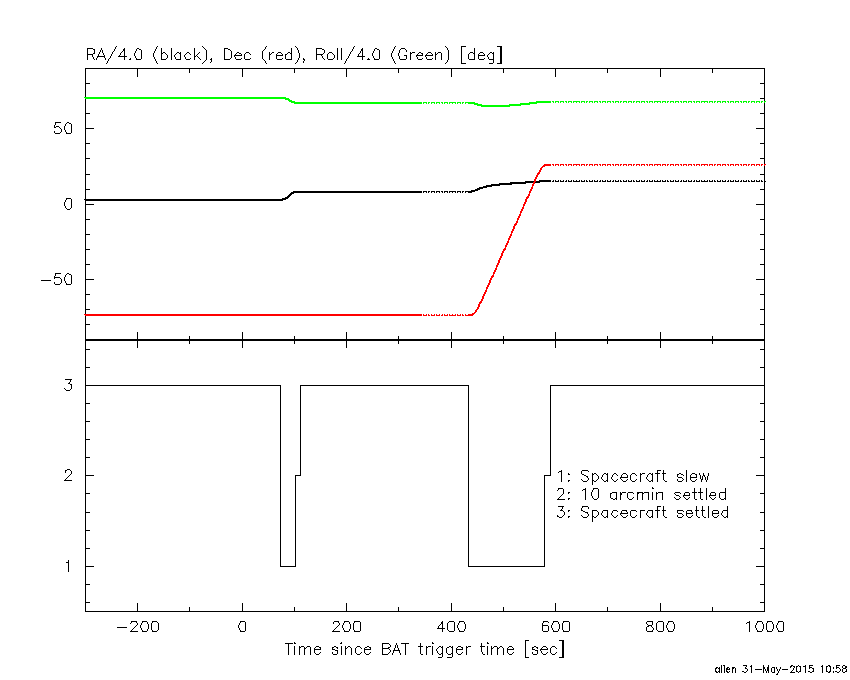
Spacecraft aspect plot
Bright source in the pre-burst/pre-slew/post-slew images
Pre-burst image of 15-350 keV band
Time interval of the image:
Pre-slew background subtracted image of 15-350 keV band
Time interval of the image:
0.000000 64.000000

# RAcent  DECcent POSerr Theta    Phi  PeakCts   SNR AngSep     Name
#  [deg]    [deg]    ['] [deg]  [deg]                   [']
170.4266 -60.6116    3.5  45.4  153.4   0.6279   3.3    3.3	Cen X-3
186.6532 -62.7872    3.3  44.0  164.6   0.5122   3.5    1.0	GX 301-2
109.3823 -60.3717    2.2  35.5  110.6   0.8255   5.2 ------	UNKNOWN
 29.6503 -24.0322    2.4  50.0    9.1   0.9718   4.7 ------	UNKNOWN
192.4051 -68.5243    2.9  38.3  168.4   0.4529   4.0 ------	UNKNOWN
303.8718 -45.1568    2.6  41.1  -97.9   1.5760   4.4 ------	UNKNOWN
299.4074 -46.0624    2.3  41.5 -102.8   1.7508   5.1 ------	UNKNOWN
Post-slew image of 15-350 keV band
Time interval of the image:
101.700600 433.400600

# RAcent  DECcent POSerr Theta    Phi  PeakCts   SNR AngSep     Name
#  [deg]    [deg]    ['] [deg]  [deg]                   [']
170.7415 -60.6154   15.6  42.9  151.8   0.3443   0.7   12.5	Cen X-3
186.4108 -62.7337    4.8  42.6  163.2   1.0049   2.4    7.1	GX 301-2
 60.5168 -31.0626    2.2  44.7   34.8   2.5561   5.2 ------	UNKNOWN
 46.5644 -66.1244    2.4   8.6   38.9   0.8651   4.9 ------	UNKNOWN
325.6008 -62.0932    3.0  26.2  -99.5   1.1032   3.9 ------	UNKNOWN
Plot creation:
Sun May 31 10:59:29 EDT 2015