Special notes of this burst
Image
Pre-slew 15.0-350.0 keV image (Event data)

#   RAcent    DECcent   POSerr    Theta     Phi              Peak Cts       SNR   Name
   46.2357   -47.3880   0.0198    26.7281    -1.4857         0.0377199      9.671 TRIG_00259803

Foreground time interval of the image:
  0.000   0.084 (delta_t =   0.084 [sec])
Background time interval of the image:
-239.700   0.000 (delta_t = 239.700 [sec])
Lightcurves
Notes:
- 1) The mask-weighted light curves are using the flight position.
- 2) Multiple plots of different time binning/intervals are shown to cover all scenarios of short/long GRBs, rate/image triggers, and real/false positives.
- 3) For all the mask-weighted lightcurves, the y-axis units are counts/sec/det where a det is 0.4 x 0.4 = 0.16 sq cm.
- 4) The verticle lines correspond to following: green dotted lines are T50 interval, black dotted lines are T90 interval, blue solid line(s) is a spacecraft slew start time, and orange solid line(s) is a spacecraft slew end time.
- 5) Time of each bin is in the middle of the bin.
1 s binning
From T0-310 s to T0+310 s

From T100_start - 20 s to T100_end + 30 s

Full time interval

64 ms binning
Full time interval

From T100_start to T100_end

From T0-5 sec to T0+5 sec

16 ms binning
From T100_start-5 s to T100_start+5 s

Blue+Cyan dotted lines: Time interval of the scaled map
From 0.000000 to 0.064000
8 ms binning
From T100_start-3 s to T100_start+3 s

Blue+Cyan dotted lines: Time interval of the scaled map
From 0.000000 to 0.064000
2 ms binning
From T100_start-1 s to T100_start+1 s

Blue+Cyan dotted lines: Time interval of the scaled map
From 0.000000 to 0.064000
SN=5 or 10 sec. binning (whichever binning is satisfied first)

SN=5 or 10 sec. binning (T < 200 sec)

Quad-rate summed light curves (from T0-300s to T0+1000s)

Spectral Evolution

Spectra
Notes:
- 1) The fitting includes the systematic errors.
- 2) When the burst includes telescope slew time periods, the fitting uses an average response file made from multiple 5-s response files through out the slew time plus single time preiod for the non-slew times, and weighted by the total counts in the corresponding time period using addrmf. An average response file is needed becuase a spectral fit using the pre-slew DRM will introduce some errors in both a spectral shape and a normalization if the PHA file contains a lot of the slew/post-slew time interval.
- 3) For fits to more complicated models (e.g. a power-law over a cutoff power-law), the BAT team has decided to require a chi-square improvement of more than 6 for each extra dof.
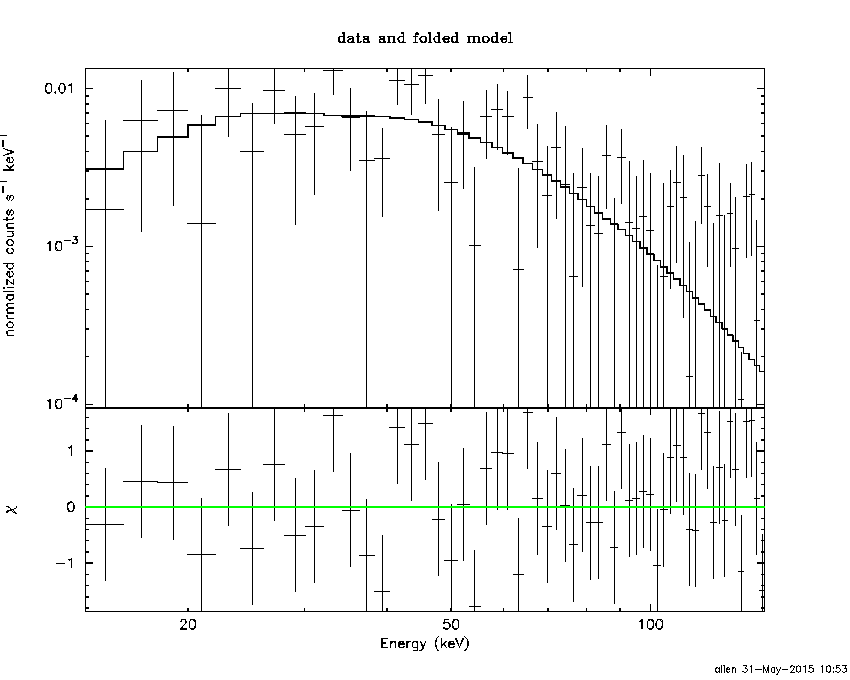
Time averaged spectrum fit using the average DRM
Power-law model

Time interval is from    0.000 sec. to    0.084 sec.

Spectral model in power-law:
------------------------------------------------------------
Parameters  : value       lower 90%   higher 90%
Photon index: 1.30587     ( -0.234633   0.238983 )
Norm@50keV  : 2.45562E-02    ( -0.00448936   0.00448908 )
------------------------------------------------------------
#Fit statistic : Chi-Squared =          59.82 using 59 PHA bins.
# Reduced chi-squared =          1.049 for     57 degrees of freedom
# Null hypothesis probability =   3.738291e-01

Photon flux (15-150 keV)    in 0.084 sec: 2.93264 ( -0.552412  0.553773 ) ph/cm2/s
Energy fluence (15-150 keV)             : 2.03555e-08 ( -3.87082e-09  3.87771e-09 ) ergs/cm2
Cutoff power-law model

Time interval is from    0.000 sec. to    0.084 sec.
Spectral model in the cutoff power-law:
------------------------------------------------------------
Parameters  : value       lower 90%   higher 90%
Photon index: -0.554944     ( -1.53749   1.10469 )
Epeak [keV] : 81.3766      ( -17.7842 37.0229 )
Norm@50keV  : 0.168756    ( -0.168754   0.650863 )
------------------------------------------------------------
#Fit statistic : Chi-Squared =          50.43 using 59 PHA bins.
# Reduced chi-squared =         0.9004 for     56 degrees of freedom
# Null hypothesis probability =   6.850107e-01

Photon flux (15-150 keV)    in 0.084 sec: 2.99103 ( -0.54708  0.55041 ) ph/cm2/s
Energy fluence (15-150 keV)             : 2.16201e-08 ( -4.32499e-09  4.23419e-09 ) ergs/cm2
Band function

Time interval is from    0.000 sec. to    0.084 sec.

Spectral model in the Band function:
------------------------------------------------------------
Parameters  : value       lower 90%   higher 90%
alpha       : 3.16335   ( -4.15849   -3.91097 )
beta        : -2.04844    ( 9.32433   19.2976 )
Epeak [keV] : 51.2639      ( -20.1925 34.8173 )
Norm@50keV   : 5.69134    ( -5.60854   30.7583 )
------------------------------------------------------------
#Fit statistic : Chi-Squared =          50.40 using 59 PHA bins.
# Reduced chi-squared =         0.9164 for     55 degrees of freedom
# Null hypothesis probability =   6.506994e-01

Photon flux (15-150 keV)    in 0.084 sec: 3.02326 (    ) ph/cm2/s
Energy fluence (15-150 keV)             : 2.16126e-08 ( 0  0 ) ergs/cm2
Single BB

Spectral model blackbody:
------------------------------------------------------------
Parameters  : value    Lower 90%  Upper 90%
kT [keV]    : 19.0583  (-3.40069  3.88611)
R^2/D10^2   : 0.186413  (-0.0873755   0.167119)
(R is the radius in km and D10 is the distance to the source in units of 10 kpc)
------------------------------------------------------------
#Fit statistic : Chi-Squared =          51.73 using 59 PHA bins.
# Reduced chi-squared =         0.9075 for     57 degrees of freedom
# Null hypothesis probability =   6.724741e-01

Energy  Fluence     90% Error
[keV]   [erg/cm2]   [erg/cm2]
15- 25  1.117e-09   3.724e-10
25- 50  5.383e-09   1.494e-09
50-150  1.438e-08   4.243e-09
15-150  2.088e-08   5.170e-09
Thermal bremsstrahlung (OTTB)

Spectral model: thermal bremsstrahlung
------------------------------------------------------------
Parameters  : value         Lower 90%    Upper 90%
kT [keV]    : 200.000       (      )
Norm        : 12.5018       (-2.29486     2.29473)
------------------------------------------------------------
#Fit statistic : Chi-Squared =          60.43 using 59 PHA bins.
# Reduced chi-squared =          1.060 for     57 degrees of freedom
# Null hypothesis probability =   3.529824e-01

Energy  Fluence     90% Error
[keV]   [erg/cm2]   [erg/cm2]
15- 25  2.615e-09   1.544e-09
25- 50  5.030e-09   2.914e-09
50-150  1.103e-08   6.405e-09
15-150  1.868e-08   1.058e-08
Double BB

Spectral model: bbodyrad<1> + bbodyrad<2>
------------------------------------------------------------
Parameters  : value         Lower 90%    Upper 90%
kT1 [keV]   : 12.1055        (-11.9257      -11.9257)
R1^2/D10^2  : 0.398632        (-0.40231      -0.40231)
kT2 [keV]   : 26.2350        (-26.0566      -26.0566)
R2^2/D10^2  : 4.02620E-02    (-0.0414819   0.235943)
------------------------------------------------------------
#Fit statistic : Chi-Squared =          50.08 using 59 PHA bins.
# Reduced chi-squared =         0.9105 for     55 degrees of freedom
# Null hypothesis probability =   6.627232e-01

Energy  Fluence     90% Error
[keV]   [erg/cm2]   [erg/cm2]
15- 25  1.433e-09   1.026e-09
25- 50  5.591e-09   3.701e-09
50-150  1.451e-08   9.467e-09
15-150  2.153e-08   1.393e-08
Peak spectrum fit
Power-law model

Time interval is from   -0.456 sec. to    0.544 sec.

Spectral model in power-law:
------------------------------------------------------------
Parameters  : value       lower 90%   higher 90%
Photon index: 1.09982     ( -0.602846   0.540941 )
Norm@50keV  : 3.17555E-03    ( -0.00106288   0.00105175 )
------------------------------------------------------------
#Fit statistic : Chi-Squared =          53.72 using 59 PHA bins.
# Reduced chi-squared =         0.9425 for     57 degrees of freedom
# Null hypothesis probability =   5.988853e-01

Photon flux (15-150 keV)    in 1 sec: 0.368337 ( -0.125835  0.127471 ) ph/cm2/s
Energy fluence (15-150 keV)             : 3.32025e-08 ( -1.14568e-08  1.165e-08 ) ergs/cm2
Cutoff power-law model

Time interval is from   -0.456 sec. to    0.544 sec.
Spectral model in the cutoff power-law:
------------------------------------------------------------
Parameters  : value       lower 90%   higher 90%
Photon index: -2.31230E-02     ( -4.57599   6.84009 )
Epeak [keV] : 95.4308      ( -44.1611 -95.4309 )
Norm@50keV  : 1.09525E-02    ( -0.0109529   1.89313 )
------------------------------------------------------------
#Fit statistic : Chi-Squared =          53.10 using 59 PHA bins.
# Reduced chi-squared =         0.9483 for     56 degrees of freedom
# Null hypothesis probability =   5.852108e-01

Photon flux (15-150 keV)    in 1 sec: 0.353586 ( -0.129589  0.131463 ) ph/cm2/s
Energy fluence (15-150 keV)             : 3.08436e-08 ( -1.30045e-08  1.27263e-08 ) ergs/cm2
Band function

Time interval is from   -0.456 sec. to    0.544 sec.

Spectral model in the Band function:
------------------------------------------------------------
Parameters  : value       lower 90%   higher 90%
alpha       : 4.90676   ( -4.90676   -4.90676 )
beta        : -1.67489    ( -1.82902   0.891153 )
Epeak [keV] : 43.6368      ( -43.6368 31.8084 )
Norm@50keV   : 9.64975    ( -3.06063   1.05256e+06 )
------------------------------------------------------------
#Fit statistic : Chi-Squared =          52.02 using 59 PHA bins.
# Reduced chi-squared =         0.9459 for     55 degrees of freedom
# Null hypothesis probability =   5.891412e-01

Photon flux (15-150 keV)    in 1 sec:  (    ) ph/cm2/s
Energy fluence (15-150 keV)             : 3.09761e-08 ( 0  0 ) ergs/cm2
Single BB

Spectral model blackbody:
------------------------------------------------------------
Parameters  : value    Lower 90%  Upper 90%
kT [keV]    : 18.3737  (-5.93154  11.4455)
R^2/D10^2   : 2.35461E-02  (-0.0234982   0.0642277)
(R is the radius in km and D10 is the distance to the source in units of 10 kpc)
------------------------------------------------------------
#Fit statistic : Chi-Squared =          53.68 using 59 PHA bins.
# Reduced chi-squared =         0.9418 for     57 degrees of freedom
# Null hypothesis probability =   6.003179e-01

Energy  Fluence     90% Error
[keV]   [erg/cm2]   [erg/cm2]
15- 25  1.581e-09   1.038e-09
25- 50  7.423e-09   4.617e-09
50-150  1.828e-08   1.224e-08
15-150  2.729e-08   1.830e-08
Thermal bremsstrahlung (OTTB)

Spectral model: thermal bremsstrahlung
------------------------------------------------------------
Parameters  : value         Lower 90%    Upper 90%
kT [keV]    : 199.362       (-108.063      -199.363)
Norm        : 1.54741       (-0.524435     0.524434)
------------------------------------------------------------
#Fit statistic : Chi-Squared =          55.33 using 59 PHA bins.
# Reduced chi-squared =         0.9707 for     57 degrees of freedom
# Null hypothesis probability =   5.378684e-01

Energy  Fluence     90% Error
[keV]   [erg/cm2]   [erg/cm2]
15- 25  3.853e-09   2.417e-09
25- 50  7.412e-09   4.452e-09
50-150  1.626e-08   1.023e-08
15-150  2.752e-08   1.739e-08
Double BB

R1^2/D10^2  : 2.02097E-04        (      )
kT2 [keV]   : 13.2461        (-13.2568      12.5757)
R2^2/D10^2  : 5.46768E-02    (-0.0545635   -0.0545635)
------------------------------------------------------------
#Fit statistic : Chi-Squared =          52.63 using 59 PHA bins.
#Fit statistic : Chi-Squared =          52.54 using 59 PHA bins.
#Fit statistic : Chi-Squared =          52.48 using 59 PHA bins.
# Reduced chi-squared =         0.9569 for     55 degrees of freedom
# Reduced chi-squared =         0.9552 for     55 degrees of freedom
# Reduced chi-squared =         0.9542 for     55 degrees of freedom
# Null hypothesis probability =   5.657400e-01
# Null hypothesis probability =   5.692700e-01
# Null hypothesis probability =   5.715297e-01

Energy  Fluence     90% Error
[keV]   [erg/cm2]   [erg/cm2]
15- 25  2.217e-09   1.416e-09
25- 50  7.785e-09   5.895e-09
50-150  2.175e-08   1.345e-08
15-150  3.175e-08   1.733e-08
Pre-slew spectrum (Pre-slew PHA with pre-slew DRM)
Power-law model

Spectral model in power-law:
------------------------------------------------------------
Parameters  : value       lower 90%   higher 90%
Photon index: 1.30587     ( -0.234633   0.238983 )
Norm@50keV  : 2.45562E-02    ( -0.00448936   0.00448908 )
------------------------------------------------------------
#Fit statistic : Chi-Squared =          59.82 using 59 PHA bins.
# Reduced chi-squared =          1.049 for     57 degrees of freedom
# Null hypothesis probability =   3.738291e-01

Photon flux (15-150 keV)    in 0.084 sec: 2.93264 ( -0.552412  0.553773 ) ph/cm2/s
Energy fluence (15-150 keV)             : 2.03555e-08 ( -3.87082e-09  3.87771e-09 ) ergs/cm2
Cutoff power-law model

Spectral model in the cutoff power-law:
------------------------------------------------------------
Parameters  : value       lower 90%   higher 90%
Photon index: -0.554944     ( -1.53749   1.10469 )
Epeak [keV] : 81.3766      ( -17.7842 37.0229 )
Norm@50keV  : 0.168756    ( -0.168754   0.650863 )
------------------------------------------------------------
#Fit statistic : Chi-Squared =          50.43 using 59 PHA bins.
# Reduced chi-squared =         0.9004 for     56 degrees of freedom
# Null hypothesis probability =   6.850107e-01

Photon flux (15-150 keV)    in 0.084 sec: 2.99103 ( -0.54708  0.55041 ) ph/cm2/s
Energy fluence (15-150 keV)             : 2.16201e-08 ( -4.32499e-09  4.23419e-09 ) ergs/cm2
Band function
Spectral model in the Band function:
------------------------------------------------------------
Parameters  : value       lower 90%   higher 90%
alpha       : 3.16335   ( -4.15849   -3.91097 )
beta        : -2.04844    ( 9.32433   19.2976 )
Epeak [keV] : 51.2639      ( -20.1925 34.8173 )
Norm@50keV   : 5.69134    ( -5.60854   30.7581 )
------------------------------------------------------------
#Fit statistic : Chi-Squared =          50.40 using 59 PHA bins.
# Reduced chi-squared =         0.9164 for     55 degrees of freedom
# Null hypothesis probability =   6.506994e-01

Photon flux (15-150 keV)    in 0.084 sec: 3.02326 (    ) ph/cm2/s
Energy fluence (15-150 keV)             : 2.16126e-08 ( 0  0 ) ergs/cm2
S(25-50 keV) vs. S(50-100 keV) plot

S(25-50 keV)  = 4.55e-09
S(50-100 keV) = 7.35e-09
T90 vs. Hardness ratio plot

T90                                   = 0.0680000185966492 sec.
Hardness ratio (energy fluence ratio) = 1.61538
Color vs. Color plot

Count Ratio  (25-50 keV) / (15-25 keV) = 3.30288
Count Ratio (50-100 keV) / (15-25 keV) = 2.99056
Mask shadow pattern

IMX = 5.033938484930026E-01, IMY = 1.305644198141932E-02
TIME vs. PHA plot around the trigger time

Blue+Cyan dotted lines: Time interval of the scaled map
From 0.000000 to 0.064000
TIME vs. DetID plot around the trigger time

Blue+Cyan dotted lines: Time interval of the scaled map
From 0.000000 to 0.064000
100 us light curve (15-350 keV)

Blue+Cyan dotted lines: Time interval of the scaled map
From 0.000000 to 0.064000
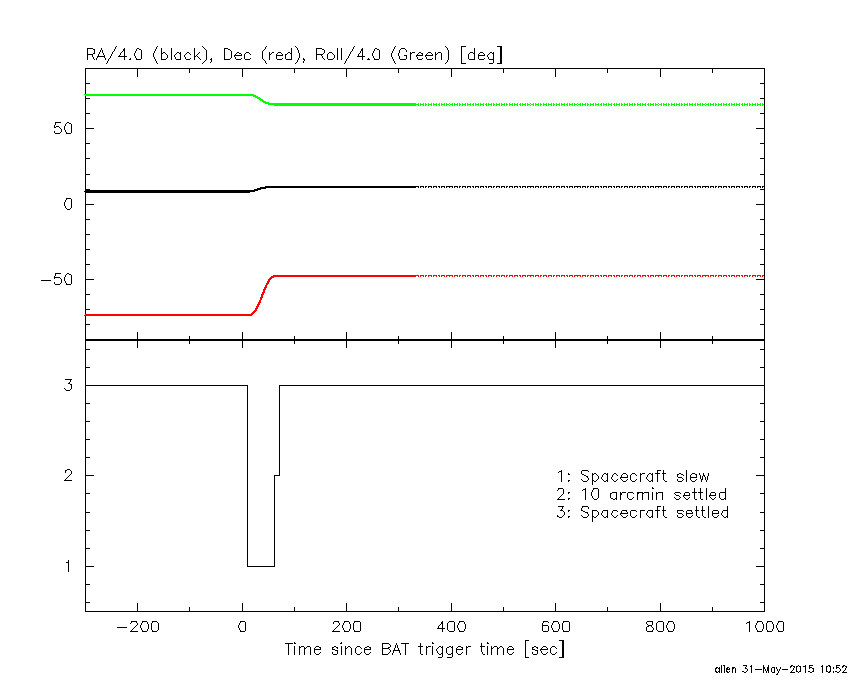
Spacecraft aspect plot
Bright source in the pre-burst/pre-slew/post-slew images
Pre-burst image of 15-350 keV band
Time interval of the image:
-239.700000 0.000000

# RAcent  DECcent POSerr Theta    Phi  PeakCts   SNR AngSep     Name
#  [deg]    [deg]    ['] [deg]  [deg]                   [']
170.4811 -60.5219    3.5  42.9  129.7   1.9647   3.3    7.8	Cen X-3
186.7919 -62.6890   14.0  42.6  141.5   0.3725   0.8    6.1	GX 301-2
264.4847 -44.4165    4.5  57.1 -159.4   2.1709   2.6   11.2	4U 1735-44
 90.3937 -40.1253    2.7  42.5   50.4   2.6757   4.3 ------	UNKNOWN
117.0550 -60.0443    2.5  32.1   90.4   1.4524   4.5 ------	UNKNOWN
 67.2324 -35.7503    3.3  41.2   22.3   1.0205   3.4 ------	UNKNOWN
239.1698 -48.3236    2.7  56.9  179.3   4.2897   4.4 ------	UNKNOWN
 28.7215 -68.2676    2.6   5.5  -40.0   0.7238   4.5 ------	UNKNOWN
255.6829 -48.8123    1.8  54.3 -167.8   3.6208   6.3 ------	UNKNOWN
280.7204 -42.7562    4.3  55.3 -145.3   2.7698   2.7 ------	UNKNOWN
Pre-slew background subtracted image of 15-350 keV band
Time interval of the image:
0.000000 0.084000

# RAcent  DECcent POSerr Theta    Phi  PeakCts   SNR AngSep     Name
#  [deg]    [deg]    ['] [deg]  [deg]                   [']
170.2030 -60.7772    0.0  42.6  129.6   0.0281   2.2    9.8	Cen X-3
186.4182 -62.7170    8.5  42.6  141.3  -0.0131  -1.3    7.3	GX 301-2
264.6744 -44.4452    5.6  57.0 -159.2   0.0319   2.1    3.0	4U 1735-44
104.9952 -46.6174    3.1  40.6   69.0   0.0530   3.7 ------	UNKNOWN
 46.2358 -47.3880    1.2  26.7   -1.5   0.0377   9.7 ------	UNKNOWN
357.2513 -43.4822    2.1  34.4  -70.4   0.0364   5.6 ------	UNKNOWN
Post-slew image of 15-350 keV band
Time interval of the image:
61.400600 962.389100

# RAcent  DECcent POSerr Theta    Phi  PeakCts   SNR AngSep     Name
#  [deg]    [deg]    ['] [deg]  [deg]                   [']
 47.7286   5.1762    2.3  52.6    7.6   6.9004   5.0 ------	UNKNOWN
204.6889 -74.8661    4.8  56.9  179.2   6.8708   2.4 ------	UNKNOWN
231.9861 -80.9646    4.0  51.6 -173.1   3.5170   2.9 ------	UNKNOWN
Plot creation:
Sun May 31 10:54:33 EDT 2015