Special notes of this burst
Image
Pre-slew 15.0-350.0 keV image (Event data)
#   RAcent    DECcent   POSerr    Theta     Phi              Peak Cts       SNR   Name
  260.1983    69.3540   0.0166    14.3599   130.2724         0.5544809     11.534 TRIG_00261132

Foreground time interval of the image:
 -1.920  19.080 (delta_t =  21.000 [sec])
Background time interval of the image:
-83.419  -1.920 (delta_t =  81.499 [sec])
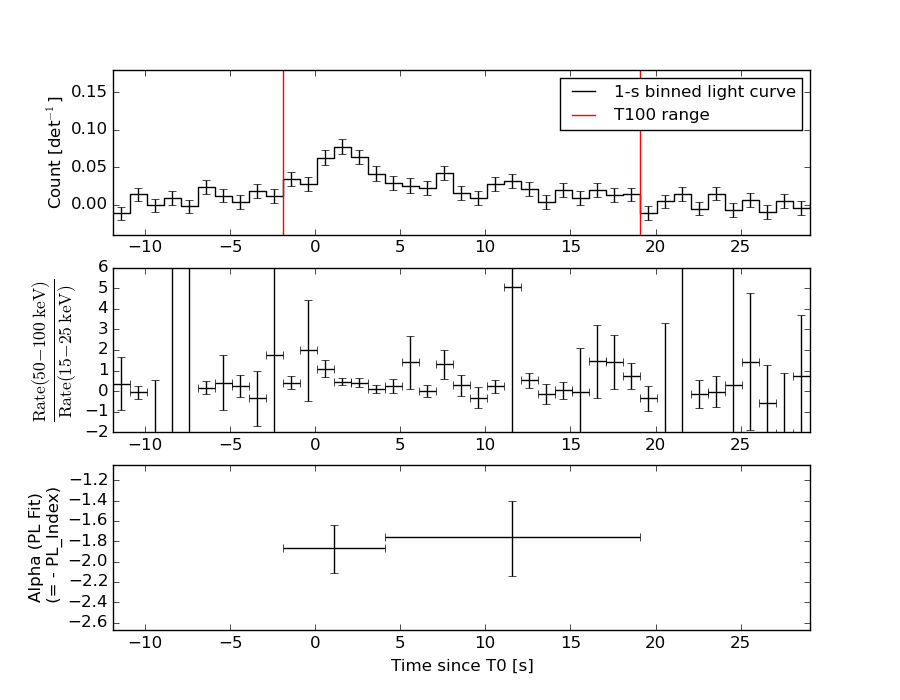
Lightcurves
Notes:
- 1) The mask-weighted light curves are using the flight position.
- 2) Multiple plots of different time binning/intervals are shown to cover all scenarios of short/long GRBs, rate/image triggers, and real/false positives.
- 3) For all the mask-weighted lightcurves, the y-axis units are counts/sec/det where a det is 0.4 x 0.4 = 0.16 sq cm.
- 4) The verticle lines correspond to following: green dotted lines are T50 interval, black dotted lines are T90 interval, blue solid line(s) is a spacecraft slew start time, and orange solid line(s) is a spacecraft slew end time.
- 5) Time of each bin is in the middle of the bin.
1 s binning
From T0-310 s to T0+310 s
From T100_start - 20 s to T100_end + 30 s
Full time interval

64 ms binning
Full time interval

From T100_start to T100_end
From T0-5 sec to T0+5 sec

16 ms binning
From T100_start-5 s to T100_start+5 s

Blue+Cyan dotted lines: Time interval of the scaled map
From 0.000000 to 2.048000
8 ms binning
From T100_start-3 s to T100_start+3 s
Blue+Cyan dotted lines: Time interval of the scaled map
From 0.000000 to 2.048000
2 ms binning
From T100_start-1 s to T100_start+1 s
Blue+Cyan dotted lines: Time interval of the scaled map
From 0.000000 to 2.048000
SN=5 or 10 sec. binning (whichever binning is satisfied first)

SN=5 or 10 sec. binning (T < 200 sec)
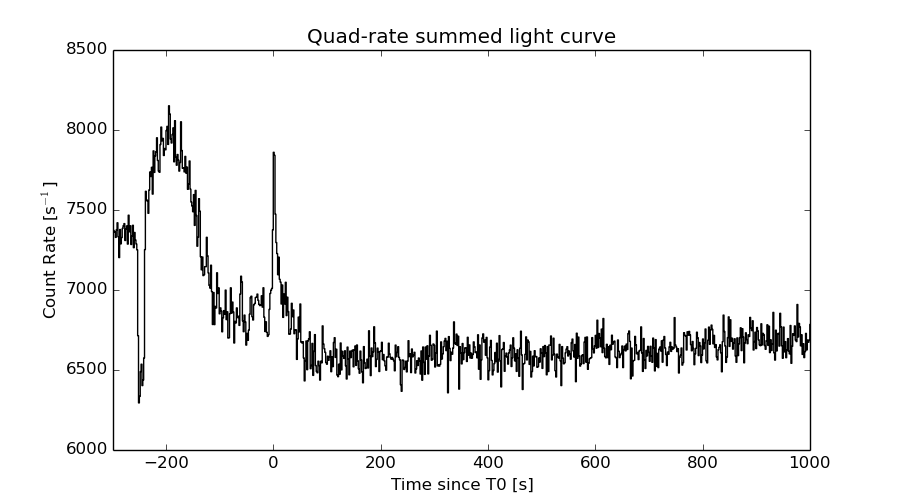
Quad-rate summed light curves (from T0-300s to T0+1000s)
Spectral Evolution
Spectra
Notes:
- 1) The fitting includes the systematic errors.
- 2) When the burst includes telescope slew time periods, the fitting uses an average response file made from multiple 5-s response files through out the slew time plus single time preiod for the non-slew times, and weighted by the total counts in the corresponding time period using addrmf. An average response file is needed becuase a spectral fit using the pre-slew DRM will introduce some errors in both a spectral shape and a normalization if the PHA file contains a lot of the slew/post-slew time interval.
- 3) For fits to more complicated models (e.g. a power-law over a cutoff power-law), the BAT team has decided to require a chi-square improvement of more than 6 for each extra dof.
Time averaged spectrum fit using the average DRM
Power-law model

Time interval is from   -1.920 sec. to   19.080 sec.

Spectral model in power-law:
------------------------------------------------------------
Parameters  : value       lower 90%   higher 90%
Photon index: 1.80522     ( -0.216196   0.225975 )
Norm@50keV  : 1.70559E-03    ( -0.000234389   0.00022747 )
------------------------------------------------------------
#Fit statistic : Chi-Squared =          59.52 using 59 PHA bins.
# Reduced chi-squared =          1.044 for     57 degrees of freedom
# Null hypothesis probability =   3.839680e-01

Photon flux (15-150 keV)    in 21 sec: 0.235504 ( -0.0265501  0.0265638 ) ph/cm2/s
Energy fluence (15-150 keV)             : 3.29673e-07 ( -4.53909e-08  4.64123e-08 ) ergs/cm2
Cutoff power-law model

Time interval is from   -1.920 sec. to   19.080 sec.
Spectral model in the cutoff power-law:
------------------------------------------------------------
Parameters  : value       lower 90%   higher 90%
Photon index: 2.02358     (     )
Epeak [keV] : 10.2558      (   )
Norm@50keV  : 1.32003E-03    (     )
------------------------------------------------------------
#Fit statistic : Chi-Squared =          59.46 using 59 PHA bins.
# Reduced chi-squared =          1.062 for     56 degrees of freedom
# Null hypothesis probability =   3.508177e-01

Photon flux (15-150 keV)    in 21 sec: 0.235544 ( -0.026644  0.026461 ) ph/cm2/s
Energy fluence (15-150 keV)             : 3.28717e-07 ( -4.61538e-08  4.66158e-08 ) ergs/cm2
Band function
Time interval is from   -1.920 sec. to   19.080 sec.

Spectral model in the Band function:
------------------------------------------------------------
Parameters  : value       lower 90%   higher 90%
alpha       : -1.45434   ( 1.44687   1.44687 )
beta        : -1.80533    ( 1.80605   0.216742 )
Epeak [keV] : 21.0277      ( -26.7141 -26.7141 )
Norm@50keV   : 3.83320E-03    ( -0.00222524   0.308323 )
------------------------------------------------------------
#Fit statistic : Chi-Squared =          59.52 using 59 PHA bins.
# Reduced chi-squared =          1.082 for     55 degrees of freedom
# Null hypothesis probability =   3.145291e-01

Photon flux (15-150 keV)    in 21 sec:  (    ) ph/cm2/s
Energy fluence (15-150 keV)             : 0 ( 0  0 ) ergs/cm2
Single BB
Spectral model blackbody:
------------------------------------------------------------
Parameters  : value    Lower 90%  Upper 90%
kT [keV]    : 11.5602  (-1.8683  2.27422)
R^2/D10^2   : 6.21607E-02  (-0.0296088   0.0570661)
(R is the radius in km and D10 is the distance to the source in units of 10 kpc)
------------------------------------------------------------
#Fit statistic : Chi-Squared =          88.53 using 59 PHA bins.
# Reduced chi-squared =          1.553 for     57 degrees of freedom
# Null hypothesis probability =   4.705147e-03

Energy  Fluence     90% Error
[keV]   [erg/cm2]   [erg/cm2]
15- 25  3.675e-08   8.274e-09
25- 50  1.106e-07   1.901e-08
50-150  8.661e-08   2.449e-08
15-150  2.340e-07   3.871e-08
Thermal bremsstrahlung (OTTB)
Spectral model: thermal bremsstrahlung
------------------------------------------------------------
Parameters  : value         Lower 90%    Upper 90%
kT [keV]    : 103.352       (-37.4701      93.5228)
Norm        : 1.02578       (-0.153177     0.191533)
------------------------------------------------------------
#Fit statistic : Chi-Squared =          61.58 using 59 PHA bins.
# Reduced chi-squared =          1.080 for     57 degrees of freedom
# Null hypothesis probability =   3.156279e-01

Energy  Fluence     90% Error
[keV]   [erg/cm2]   [erg/cm2]
15- 25  5.630e-08   9.230e-09
25- 50  9.799e-08   1.415e-08
50-150  1.618e-07   7.296e-08
15-150  3.160e-07   8.358e-08
Double BB
Spectral model: bbodyrad<1> + bbodyrad<2>
------------------------------------------------------------
Parameters  : value         Lower 90%    Upper 90%
kT1 [keV]   : 4.62048        (-1.22147      1.60676)
R1^2/D10^2  : 1.48065        (-1.03512      4.58671)
kT2 [keV]   : 20.7566        (-4.74305      8.37602)
R2^2/D10^2  : 6.17217E-03    (-0.00430204   0.0097074)
------------------------------------------------------------
#Fit statistic : Chi-Squared =          58.55 using 59 PHA bins.
# Reduced chi-squared =          1.065 for     55 degrees of freedom
# Null hypothesis probability =   3.464803e-01

Energy  Fluence     90% Error
[keV]   [erg/cm2]   [erg/cm2]
15- 25  6.515e-08   3.299e-08
25- 50  8.327e-08   3.131e-08
50-150  1.743e-07   9.015e-08
15-150  3.228e-07   1.428e-07
Peak spectrum fit
Power-law model
Time interval is from    1.080 sec. to    2.080 sec.

Spectral model in power-law:
------------------------------------------------------------
Parameters  : value       lower 90%   higher 90%
Photon index: 1.99615     ( -0.399458   0.462777 )
Norm@50keV  : 4.12314E-03    ( -0.00120373   0.00112288 )
------------------------------------------------------------
#Fit statistic : Chi-Squared =          64.30 using 59 PHA bins.
# Reduced chi-squared =          1.128 for     57 degrees of freedom
# Null hypothesis probability =   2.363403e-01

Photon flux (15-150 keV)    in 1 sec: 0.617380 ( -0.124168  0.124172 ) ph/cm2/s
Energy fluence (15-150 keV)             : 3.8015e-08 ( -9.8406e-09  1.03591e-08 ) ergs/cm2
Cutoff power-law model
Time interval is from    1.080 sec. to    2.080 sec.
Spectral model in the cutoff power-law:
------------------------------------------------------------
Parameters  : value       lower 90%   higher 90%
Photon index: 2.06071     ( -1.4962   0.0533208 )
Epeak [keV] : 32.2053      (   )
Norm@50keV  : 3.72323E-03    (     )
------------------------------------------------------------
#Fit statistic : Chi-Squared =          64.24 using 59 PHA bins.
# Reduced chi-squared =          1.147 for     56 degrees of freedom
# Null hypothesis probability =   2.100890e-01

Photon flux (15-150 keV)    in 1 sec: 0.617408 ( -0.124528  0.123661 ) ph/cm2/s
Energy fluence (15-150 keV)             : 3.77837e-08 ( -1.00845e-08  1.04412e-08 ) ergs/cm2
Band function

Time interval is from    1.080 sec. to    2.080 sec.

Spectral model in the Band function:
------------------------------------------------------------
Parameters  : value       lower 90%   higher 90%
alpha       : -1.54266   ( 1.54572   1.54572 )
beta        : -1.98274    ( 1.98775   0.391372 )
Epeak [keV] : 16.0552      ( -12.2041 -12.2041 )
Norm@50keV   : 1.07922E-02    ( -0.011563   6.90778 )
------------------------------------------------------------
#Fit statistic : Chi-Squared =          64.31 using 59 PHA bins.
# Reduced chi-squared =          1.169 for     55 degrees of freedom
# Null hypothesis probability =   1.828664e-01

Photon flux (15-150 keV)    in 1 sec:  (    ) ph/cm2/s
Energy fluence (15-150 keV)             : 3.6985e-08 ( -3.6978e-08  -3.6985e-08 ) ergs/cm2
Single BB
Spectral model blackbody:
------------------------------------------------------------
Parameters  : value    Lower 90%  Upper 90%
kT [keV]    : 10.5180  (-2.8375  3.40507)
R^2/D10^2   : 0.231544  (-0.148572   0.516743)
(R is the radius in km and D10 is the distance to the source in units of 10 kpc)
------------------------------------------------------------
#Fit statistic : Chi-Squared =          73.21 using 59 PHA bins.
# Reduced chi-squared =          1.284 for     57 degrees of freedom
# Null hypothesis probability =   7.278470e-02

Energy  Fluence     90% Error
[keV]   [erg/cm2]   [erg/cm2]
15- 25  5.297e-09   2.564e-09
25- 50  1.412e-08   5.464e-09
50-150  8.514e-09   4.712e-09
15-150  2.793e-08   1.109e-08
Thermal bremsstrahlung (OTTB)
Spectral model: thermal bremsstrahlung
------------------------------------------------------------
Parameters  : value         Lower 90%    Upper 90%
kT [keV]    : 70.8232       (-34.9998      122.386)
Norm        : 3.00106       (-0.805853     1.34072)
------------------------------------------------------------
#Fit statistic : Chi-Squared =          65.28 using 59 PHA bins.
# Reduced chi-squared =          1.145 for     57 degrees of freedom
# Null hypothesis probability =   2.112100e-01

Energy  Fluence     90% Error
[keV]   [erg/cm2]   [erg/cm2]
15- 25  7.709e-09   2.250e-09
25- 50  1.230e-08   4.015e-09
50-150  1.594e-08   1.214e-08
15-150  3.595e-08   1.577e-08
Double BB
Spectral model: bbodyrad<1> + bbodyrad<2>
------------------------------------------------------------
Parameters  : value         Lower 90%    Upper 90%
kT1 [keV]   : 3.44608        (-2.64592      2.36269)
R1^2/D10^2  : 15.4864        (-14.0134      2.33038e+07)
kT2 [keV]   : 15.8477        (-4.96315      10.6636)
R2^2/D10^2  : 4.17122E-02    (-0.0345255   0.135778)
------------------------------------------------------------
#Fit statistic : Chi-Squared =          63.35 using 59 PHA bins.
# Reduced chi-squared =          1.152 for     55 degrees of freedom
# Null hypothesis probability =   2.056126e-01

Energy  Fluence     90% Error
[keV]   [erg/cm2]   [erg/cm2]
15- 25  8.688e-09   4.947e-09
25- 50  1.056e-08   5.900e-09
50-150  1.585e-08   1.011e-08
15-150  3.510e-08   1.815e-08
Pre-slew spectrum (Pre-slew PHA with pre-slew DRM)
Power-law model

Spectral model in power-law:
------------------------------------------------------------
Parameters  : value       lower 90%   higher 90%
Photon index: 1.80522     ( -0.216196   0.225975 )
Norm@50keV  : 1.70559E-03    ( -0.000234389   0.00022747 )
------------------------------------------------------------
#Fit statistic : Chi-Squared =          59.52 using 59 PHA bins.
# Reduced chi-squared =          1.044 for     57 degrees of freedom
# Null hypothesis probability =   3.839680e-01

Photon flux (15-150 keV)    in 21 sec: 0.235504 ( -0.0265501  0.0265638 ) ph/cm2/s
Energy fluence (15-150 keV)             : 3.29673e-07 ( -4.53909e-08  4.64123e-08 ) ergs/cm2
Cutoff power-law model
Spectral model in the cutoff power-law:
------------------------------------------------------------
Parameters  : value       lower 90%   higher 90%
Photon index: 2.02358     (     )
Epeak [keV] : 10.2558      (   )
Norm@50keV  : 1.32003E-03    (     )
------------------------------------------------------------
#Fit statistic : Chi-Squared =          59.46 using 59 PHA bins.
# Reduced chi-squared =          1.062 for     56 degrees of freedom
# Null hypothesis probability =   3.508177e-01

Photon flux (15-150 keV)    in 21 sec: 0.235544 ( -0.026644  0.026461 ) ph/cm2/s
Energy fluence (15-150 keV)             : 3.28717e-07 ( -4.61538e-08  4.66158e-08 ) ergs/cm2
Band function

Spectral model in the Band function:
------------------------------------------------------------
Parameters  : value       lower 90%   higher 90%
alpha       : -1.45434   ( 1.44687   1.44687 )
beta        : -1.80533    ( 1.80605   0.216742 )
Epeak [keV] : 21.0277      ( -26.7141 -26.7141 )
Norm@50keV   : 3.83320E-03    ( -0.00222524   0.308323 )
------------------------------------------------------------
#Fit statistic : Chi-Squared =          59.52 using 59 PHA bins.
# Reduced chi-squared =          1.082 for     55 degrees of freedom
# Null hypothesis probability =   3.145291e-01

Photon flux (15-150 keV)    in 21 sec:  (    ) ph/cm2/s
Energy fluence (15-150 keV)             : 0 ( 0  0 ) ergs/cm2
S(25-50 keV) vs. S(50-100 keV) plot
S(25-50 keV)  = 9.30e-08
S(50-100 keV) = 1.06e-07
T90 vs. Hardness ratio plot
T90                                   = 18 sec.
Hardness ratio (energy fluence ratio) = 1.13978
Color vs. Color plot
Count Ratio  (25-50 keV) / (15-25 keV) = 0.921388
Count Ratio (50-100 keV) / (15-25 keV) = 0.585549
Mask shadow pattern
IMX = -1.654912484241922E-01, IMY = -1.953310178599256E-01
TIME vs. PHA plot around the trigger time
Blue+Cyan dotted lines: Time interval of the scaled map
From 0.000000 to 2.048000
TIME vs. DetID plot around the trigger time
Blue+Cyan dotted lines: Time interval of the scaled map
From 0.000000 to 2.048000
100 us light curve (15-350 keV)
Blue+Cyan dotted lines: Time interval of the scaled map
From 0.000000 to 2.048000
Spacecraft aspect plot
Bright source in the pre-burst/pre-slew/post-slew images
Pre-burst image of 15-350 keV band
Time interval of the image:
-83.419410 -1.920000

# RAcent  DECcent POSerr Theta    Phi  PeakCts   SNR AngSep     Name
#  [deg]    [deg]    ['] [deg]  [deg]                   [']
254.5487  35.1735    8.2  26.1   16.2  -0.1373  -1.4   11.1	Her X-1
268.3083  -1.4102    4.9  58.6  -17.7  -1.2849  -2.4    4.4	SW J1753.5-0127
288.7639  10.9047    2.3  46.9  -44.0   1.3527   5.1    3.2	GRS 1915+105
299.5749  35.2194    0.6  26.8  -73.1   2.3115  18.4    1.3	Cyg X-1
308.0962  40.9716    1.6  26.0  -93.0   0.8575   7.3    1.3	Cyg X-3
326.1791  38.3286   79.1  37.4 -109.1   0.0314   0.1    0.5	Cyg X-2
263.1134  24.1479    2.2  34.0   -5.4   0.5564   5.3 ------	UNKNOWN
256.8077   4.3892    1.9  54.6   -3.0   1.6922   6.1 ------	UNKNOWN
296.7772  46.3833    2.2  16.4  -86.3   0.4752   5.2 ------	UNKNOWN
308.0457  37.7277    1.8  28.4  -88.4   0.8713   6.5 ------	UNKNOWN
Pre-slew background subtracted image of 15-350 keV band
Time interval of the image:
-1.920000 19.080000

# RAcent  DECcent POSerr Theta    Phi  PeakCts   SNR AngSep     Name
#  [deg]    [deg]    ['] [deg]  [deg]                   [']
254.5912  35.1657    0.0  26.1   16.2   0.0386   0.7   12.5	Her X-1
268.3580  -1.4132    4.3  58.6  -17.8   0.7737   2.7    2.4	SW J1753.5-0127
288.6975  10.9400   13.7  46.9  -43.9  -0.1256  -0.8    5.9	GRS 1915+105
299.8442  35.1953    0.0  26.9  -73.5   0.1381   2.1   12.5	Cyg X-1
308.0075  40.8333   11.7  26.0  -92.7   0.0675   1.0    8.5	Cyg X-3
326.2367  38.4778    5.8  37.3 -109.3   0.2282   2.0    9.9	Cyg X-2
260.2003  69.3543    1.0  14.4  130.3   0.5531  11.5 ------	UNKNOWN
277.4047  13.6497    2.6  43.2  -28.7   0.3676   4.4 ------	UNKNOWN
Post-slew image of 15-350 keV band
Time interval of the image:
66.380600 962.131100

# RAcent  DECcent POSerr Theta    Phi  PeakCts   SNR AngSep     Name
#  [deg]    [deg]    ['] [deg]  [deg]                   [']
254.6279  35.3615    5.7  34.1  -12.7  -0.8979  -2.0    8.4	Her X-1
299.6074  35.2056    0.8  40.3  -74.1  21.0199  15.2    0.9	Cyg X-1
308.0207  40.9678    3.2  37.6  -87.3   5.5022   3.5    4.2	Cyg X-3
 46.0435  49.7755    3.2  58.3 -175.6  10.6944   3.6 ------	UNKNOWN
 23.7887  57.4179    2.6  46.9 -162.9   3.3471   4.4 ------	UNKNOWN
259.9962  17.9218    2.9  51.4  -20.6   4.1150   4.0 ------	UNKNOWN
300.3505  38.4930    4.2  37.5  -76.8   2.9960   2.7 ------	UNKNOWN
Plot creation:
Sun May 31 10:52:32 EDT 2015