Special notes of this burst
Image
Pre-slew 15.0-350.0 keV image (Event data)

#   RAcent    DECcent   POSerr    Theta     Phi              Peak Cts       SNR   Name
  178.9972   -13.3735   0.0206    12.2877    -0.4991         0.7773800      9.305 TRIG_00261880

Foreground time interval of the image:
-15.000  49.000 (delta_t =  64.000 [sec])
Background time interval of the image:
-239.000 -15.000 (delta_t = 224.000 [sec])
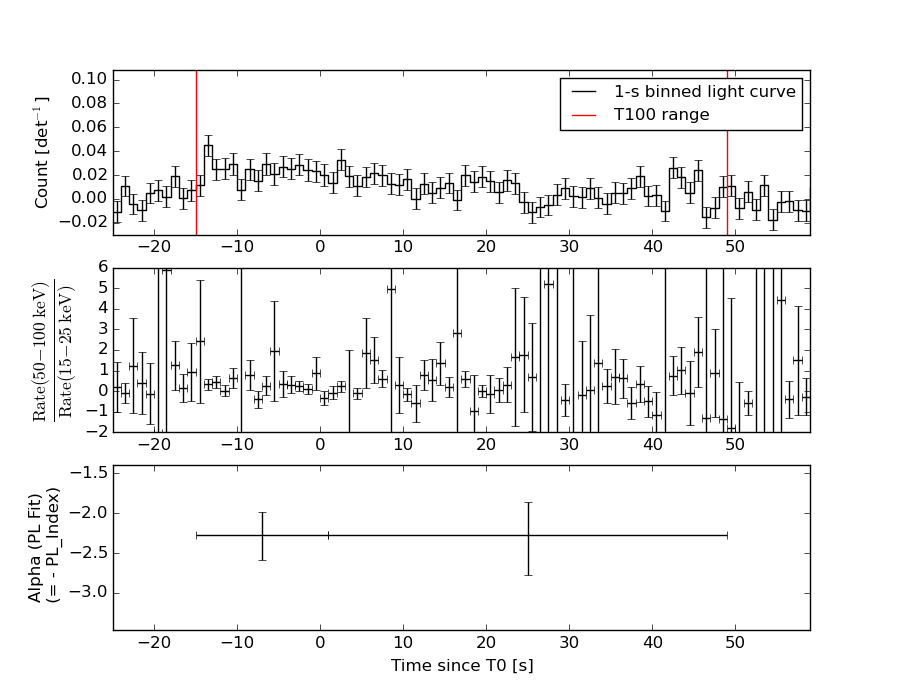
Lightcurves
Notes:
- 1) The mask-weighted light curves are using the flight position.
- 2) Multiple plots of different time binning/intervals are shown to cover all scenarios of short/long GRBs, rate/image triggers, and real/false positives.
- 3) For all the mask-weighted lightcurves, the y-axis units are counts/sec/det where a det is 0.4 x 0.4 = 0.16 sq cm.
- 4) The verticle lines correspond to following: green dotted lines are T50 interval, black dotted lines are T90 interval, blue solid line(s) is a spacecraft slew start time, and orange solid line(s) is a spacecraft slew end time.
- 5) Time of each bin is in the middle of the bin.
1 s binning
From T0-310 s to T0+310 s

From T100_start - 20 s to T100_end + 30 s

Full time interval

64 ms binning
Full time interval

From T100_start to T100_end

From T0-5 sec to T0+5 sec

16 ms binning
From T100_start-5 s to T100_start+5 s

Blue+Cyan dotted lines: Time interval of the scaled map
From 0.000000 to 64.000000
8 ms binning
From T100_start-3 s to T100_start+3 s

Blue+Cyan dotted lines: Time interval of the scaled map
From 0.000000 to 64.000000
2 ms binning
From T100_start-1 s to T100_start+1 s

Blue+Cyan dotted lines: Time interval of the scaled map
From 0.000000 to 64.000000
SN=5 or 10 sec. binning (whichever binning is satisfied first)

SN=5 or 10 sec. binning (T < 200 sec)

Quad-rate summed light curves (from T0-300s to T0+1000s)

Spectral Evolution
Spectra
Notes:
- 1) The fitting includes the systematic errors.
- 2) When the burst includes telescope slew time periods, the fitting uses an average response file made from multiple 5-s response files through out the slew time plus single time preiod for the non-slew times, and weighted by the total counts in the corresponding time period using addrmf. An average response file is needed becuase a spectral fit using the pre-slew DRM will introduce some errors in both a spectral shape and a normalization if the PHA file contains a lot of the slew/post-slew time interval.
- 3) For fits to more complicated models (e.g. a power-law over a cutoff power-law), the BAT team has decided to require a chi-square improvement of more than 6 for each extra dof.
Time averaged spectrum fit using the average DRM
Power-law model

Time interval is from  -15.000 sec. to   49.000 sec.

Spectral model in power-law:
------------------------------------------------------------
Parameters  : value       lower 90%   higher 90%
Photon index: 2.28896     ( -0.270033   0.300418 )
Norm@50keV  : 6.05476E-04    ( -0.000131605   0.000129548 )
------------------------------------------------------------
#Fit statistic : Chi-Squared =          61.38 using 59 PHA bins.
# Reduced chi-squared =          1.077 for     57 degrees of freedom
# Null hypothesis probability =   3.219588e-01

Photon flux (15-150 keV)    in 64 sec: 0.105166 ( -0.0140837  0.0140907 ) ph/cm2/s
Energy fluence (15-150 keV)             : 3.69565e-07 ( -6.43936e-08  6.76486e-08 ) ergs/cm2
Cutoff power-law model

Time interval is from  -15.000 sec. to   49.000 sec.
Spectral model in the cutoff power-law:
------------------------------------------------------------
Parameters  : value       lower 90%   higher 90%
Photon index: 1.50948     ( -1.50888   0.827012 )
Epeak [keV] : 22.5772      ( -19.4422 14.9217 )
Norm@50keV  : 1.89181E-03    ( -0.00108144   0.0157306 )
------------------------------------------------------------
#Fit statistic : Chi-Squared =          60.22 using 59 PHA bins.
# Reduced chi-squared =          1.075 for     56 degrees of freedom
# Null hypothesis probability =   3.255668e-01

Photon flux (15-150 keV)    in 64 sec: 0.102803 ( -0.0142401  0.014441 ) ph/cm2/s
Energy fluence (15-150 keV)             : 3.38113e-07 ( -6.5769e-08  8.24838e-08 ) ergs/cm2
Band function

Time interval is from  -15.000 sec. to   49.000 sec.

Spectral model in the Band function:
------------------------------------------------------------
Parameters  : value       lower 90%   higher 90%
alpha       : 4.93025   ( -4.93025   -4.93025 )
beta        : -2.39981    ( -0.439841   0.314329 )
Epeak [keV] : 19.1140      ( -19.114 4.04236 )
Norm@50keV   : 689.880    ( -91.628   1.52084e+06 )
------------------------------------------------------------
#Fit statistic : Chi-Squared =          60.50 using 59 PHA bins.
# Reduced chi-squared =          1.100 for     55 degrees of freedom
# Null hypothesis probability =   2.840491e-01

Photon flux (15-150 keV)    in 64 sec:  (    ) ph/cm2/s
Energy fluence (15-150 keV)             : 0 ( 0  0 ) ergs/cm2
Single BB

Spectral model blackbody:
------------------------------------------------------------
Parameters  : value    Lower 90%  Upper 90%
kT [keV]    : 8.08272  (-1.26622  1.414)
R^2/D10^2   : 0.111052  (-0.0522055   0.107324)
(R is the radius in km and D10 is the distance to the source in units of 10 kpc)
------------------------------------------------------------
#Fit statistic : Chi-Squared =          69.50 using 59 PHA bins.
# Reduced chi-squared =          1.219 for     57 degrees of freedom
# Null hypothesis probability =   1.238857e-01

Energy  Fluence     90% Error
[keV]   [erg/cm2]   [erg/cm2]
15- 25  8.460e-08   2.094e-08
25- 50  1.507e-07   3.296e-08
50-150  4.093e-08   1.726e-08
15-150  2.763e-07   5.315e-08
Thermal bremsstrahlung (OTTB)

Spectral model: thermal bremsstrahlung
------------------------------------------------------------
Parameters  : value         Lower 90%    Upper 90%
kT [keV]    : 39.5705       (-11.8194      19.7686)
Norm        : 0.687781       (-0.158985     0.22296)
------------------------------------------------------------
#Fit statistic : Chi-Squared =          60.29 using 59 PHA bins.
# Reduced chi-squared =          1.058 for     57 degrees of freedom
# Null hypothesis probability =   3.577540e-01

Energy  Fluence     90% Error
[keV]   [erg/cm2]   [erg/cm2]
15- 25  1.007e-07   1.677e-08
25- 50  1.319e-07   2.493e-08
50-150  1.008e-07   4.606e-08
15-150  3.334e-07   6.963e-08
Double BB

Spectral model: bbodyrad<1> + bbodyrad<2>
------------------------------------------------------------
Parameters  : value         Lower 90%    Upper 90%
kT1 [keV]   : 3.55951        (-1.31194      1.751)
R1^2/D10^2  : 2.02942        (-1.65053      22.2645)
kT2 [keV]   : 11.5565        (-2.55973      4.62)
R2^2/D10^2  : 2.09058E-02    (-0.0163667   0.0416728)
------------------------------------------------------------
#Fit statistic : Chi-Squared =          58.75 using 59 PHA bins.
# Reduced chi-squared =          1.068 for     55 degrees of freedom
# Null hypothesis probability =   3.398249e-01

Energy  Fluence     90% Error
[keV]   [erg/cm2]   [erg/cm2]
15- 25  1.028e-07   5.398e-08
25- 50  1.299e-07   6.931e-08
50-150  8.869e-08   5.398e-08
15-150  3.214e-07   1.686e-07
Peak spectrum fit
Power-law model

Time interval is from   -7.500 sec. to   -6.500 sec.

Spectral model in power-law:
------------------------------------------------------------
Parameters  : value       lower 90%   higher 90%
Photon index: 2.15739     ( -0.89301   1.08746 )
Norm@50keV  : 1.21692E-03    ( -0.000872113   0.000869417 )
------------------------------------------------------------
#Fit statistic : Chi-Squared =          51.04 using 59 PHA bins.
# Reduced chi-squared =         0.8954 for     57 degrees of freedom
# Null hypothesis probability =   6.972080e-01

Photon flux (15-150 keV)    in 1 sec: 0.195595 ( -0.107622  0.107966 ) ph/cm2/s
Energy fluence (15-150 keV)             : 1.08959e-08 ( -6.79282e-09  8.01032e-09 ) ergs/cm2
Cutoff power-law model

Time interval is from   -7.500 sec. to   -6.500 sec.
Spectral model in the cutoff power-law:
------------------------------------------------------------
Parameters  : value       lower 90%   higher 90%
Photon index: -6.95328     (     )
Epeak [keV] : 32.0340      ( -4.32483 9.05452 )
Norm@50keV  : 1238.58    (     )
------------------------------------------------------------
#Fit statistic : Chi-Squared =          45.51 using 59 PHA bins.
# Reduced chi-squared =         0.8126 for     56 degrees of freedom
# Null hypothesis probability =   8.406599e-01

Photon flux (15-150 keV)    in 1 sec: 0.207831 ( -0.093979  0.097976 ) ph/cm2/s
Energy fluence (15-150 keV)             : 9.85905e-09 ( -4.48605e-09  4.94545e-09 ) ergs/cm2
Band function

Time interval is from   -7.500 sec. to   -6.500 sec.

Spectral model in the Band function:
------------------------------------------------------------
Parameters  : value       lower 90%   higher 90%
alpha       : 4.98098   ( -13.8292   -4.98098 )
beta        : -9.36691    ( 9.36691   19.335 )
Epeak [keV] : 31.9662      ( -7.32957 9.13652 )
Norm@50keV   : 67.3606    ( -29.0705   312.504 )
------------------------------------------------------------
#Fit statistic : Chi-Squared =          45.61 using 59 PHA bins.
# Reduced chi-squared =         0.8293 for     55 degrees of freedom
# Null hypothesis probability =   8.125789e-01

Photon flux (15-150 keV)    in 1 sec:  (    ) ph/cm2/s
Energy fluence (15-150 keV)             : 0 ( 0  0 ) ergs/cm2
Single BB

Spectral model blackbody:
------------------------------------------------------------
Parameters  : value    Lower 90%  Upper 90%
kT [keV]    : 8.08569  (-2.4412  3.3135)
R^2/D10^2   : 0.264583  (-0.262656   0.760284)
(R is the radius in km and D10 is the distance to the source in units of 10 kpc)
------------------------------------------------------------
#Fit statistic : Chi-Squared =          46.72 using 59 PHA bins.
# Reduced chi-squared =         0.8196 for     57 degrees of freedom
# Null hypothesis probability =   8.326229e-01

Energy  Fluence     90% Error
[keV]   [erg/cm2]   [erg/cm2]
15- 25  3.153e-09   2.008e-09
25- 50  5.620e-09   3.703e-09
50-150  1.528e-09   1.450e-09
15-150  1.030e-08   7.025e-09
Thermal bremsstrahlung (OTTB)

Spectral model: thermal bremsstrahlung
------------------------------------------------------------
Parameters  : value         Lower 90%    Upper 90%
kT [keV]    : 34.5724       (-22.3553      122.173)
Norm        : 1.49992       (-0.919735     1.95651)
------------------------------------------------------------
#Fit statistic : Chi-Squared =          49.55 using 59 PHA bins.
# Reduced chi-squared =         0.8693 for     57 degrees of freedom
# Null hypothesis probability =   7.477564e-01

Energy  Fluence     90% Error
[keV]   [erg/cm2]   [erg/cm2]
15- 25  3.260e-09   2.078e-09
25- 50  4.011e-09   2.736e-09
50-150  2.625e-09   2.711e-09
15-150  9.896e-09   7.430e-09
Double BB

------------------------------------------------------------
Parameters  : value         Lower 90%    Upper 90%
kT1 [keV]   : 1.00088E-04        (      )
R1^2/D10^2  : 6.30878E-02        (-0.0630917      -0.0630917)
kT2 [keV]   : 8.12010        (-2.42469      3.32731)
R2^2/D10^2  : 0.260535    (-0.261446   0.761101)
------------------------------------------------------------
#Fit statistic : Chi-Squared =          46.73 using 59 PHA bins.
#Fit statistic : Chi-Squared =          46.72 using 59 PHA bins.
# Reduced chi-squared =         0.8497 for     55 degrees of freedom
# Reduced chi-squared =         0.8494 for     55 degrees of freedom
# Null hypothesis probability =   7.785565e-01
# Null hypothesis probability =   7.790368e-01

Energy  Fluence     90% Error
[keV]   [erg/cm2]   [erg/cm2]
15- 25  3.123e-09   5.710e-04
25- 50  5.777e-09   4.849e-03
50-150  1.691e-09   1.167e-01
15-150  1.059e-08   1.134e-01
Pre-slew spectrum (Pre-slew PHA with pre-slew DRM)
Power-law model
Spectral model in power-law:
------------------------------------------------------------
Parameters  : value       lower 90%   higher 90%
Photon index: 2.28896     ( -0.270033   0.300418 )
Norm@50keV  : 6.05476E-04    ( -0.000131605   0.000129548 )
------------------------------------------------------------
#Fit statistic : Chi-Squared =          61.38 using 59 PHA bins.
# Reduced chi-squared =          1.077 for     57 degrees of freedom
# Null hypothesis probability =   3.219588e-01

Photon flux (15-150 keV)    in 64 sec: 0.105166 ( -0.0140837  0.0140907 ) ph/cm2/s
Energy fluence (15-150 keV)             : 3.69565e-07 ( -6.43936e-08  6.76486e-08 ) ergs/cm2
Cutoff power-law model
Spectral model in the cutoff power-law:
------------------------------------------------------------
Parameters  : value       lower 90%   higher 90%
Photon index: 1.50948     ( -1.50888   0.827012 )
Epeak [keV] : 22.5772      ( -19.3658 14.9254 )
Norm@50keV  : 1.89181E-03    ( -0.00108144   0.0157306 )
------------------------------------------------------------
#Fit statistic : Chi-Squared =          60.22 using 59 PHA bins.
# Reduced chi-squared =          1.075 for     56 degrees of freedom
# Null hypothesis probability =   3.255668e-01

Photon flux (15-150 keV)    in 64 sec: 0.102803 ( -0.0142401  0.014441 ) ph/cm2/s
Energy fluence (15-150 keV)             : 3.38113e-07 ( -6.5769e-08  8.24838e-08 ) ergs/cm2
Band function
Spectral model in the Band function:
------------------------------------------------------------
Parameters  : value       lower 90%   higher 90%
alpha       : 4.93025   ( -4.93025   -4.93025 )
beta        : -2.39981    ( -0.439841   0.314329 )
Epeak [keV] : 19.1140      ( -19.114 4.04236 )
Norm@50keV   : 689.880    ( -91.628   1.52084e+06 )
------------------------------------------------------------
#Fit statistic : Chi-Squared =          60.50 using 59 PHA bins.
# Reduced chi-squared =          1.100 for     55 degrees of freedom
# Null hypothesis probability =   2.840491e-01

Photon flux (15-150 keV)    in 64 sec:  (    ) ph/cm2/s
Energy fluence (15-150 keV)             : 0 ( 0  0 ) ergs/cm2
S(25-50 keV) vs. S(50-100 keV) plot

S(25-50 keV)  = 1.19e-07
S(50-100 keV) = 9.75e-08
T90 vs. Hardness ratio plot

T90                                   = 48 sec.
Hardness ratio (energy fluence ratio) = 0.819328
Color vs. Color plot

Count Ratio  (25-50 keV) / (15-25 keV) = 0.799942
Count Ratio (50-100 keV) / (15-25 keV) = 0.309979
Mask shadow pattern

IMX = 2.178018704812982E-01, IMY = 1.897387479609091E-03
TIME vs. PHA plot around the trigger time
Blue+Cyan dotted lines: Time interval of the scaled map
From 0.000000 to 64.000000
TIME vs. DetID plot around the trigger time

Blue+Cyan dotted lines: Time interval of the scaled map
From 0.000000 to 64.000000
100 us light curve (15-350 keV)

Blue+Cyan dotted lines: Time interval of the scaled map
From 0.000000 to 64.000000
Spacecraft aspect plot
Bright source in the pre-burst/pre-slew/post-slew images
Pre-burst image of 15-350 keV band
Time interval of the image:
-239.000000 -15.000000

# RAcent  DECcent POSerr Theta    Phi  PeakCts   SNR AngSep     Name
#  [deg]    [deg]    ['] [deg]  [deg]                   [']
179.6562  43.9069    2.9  45.0  173.7   1.1662   3.9 ------	UNKNOWN
197.6841  42.0144    2.2  46.0 -167.6   1.4909   5.2 ------	UNKNOWN
194.4151  14.4744    2.1  21.1 -144.1   0.9032   5.5 ------	UNKNOWN
Pre-slew background subtracted image of 15-350 keV band
Time interval of the image:
-15.000000 49.000000

# RAcent  DECcent POSerr Theta    Phi  PeakCts   SNR AngSep     Name
#  [deg]    [deg]    ['] [deg]  [deg]                   [']
154.5690  42.7021    1.9  49.5  149.6   1.9876   6.0 ------	UNKNOWN
176.8772 -11.6020    2.5  11.0   11.3   0.3707   4.7 ------	UNKNOWN
178.9972 -13.3736    1.2  12.3   -0.5   0.7776   9.4 ------	UNKNOWN
Post-slew image of 15-350 keV band
Time interval of the image:
129.100590 963.100000

# RAcent  DECcent POSerr Theta    Phi  PeakCts   SNR AngSep     Name
#  [deg]    [deg]    ['] [deg]  [deg]                   [']
135.6042 -40.5968    5.1  46.6   -0.0   1.8253   2.2    4.3	Vela X-1
170.2892 -60.6424    5.7  47.7  -40.2   2.7231   2.0    1.4	Cen X-3
159.7756   0.1318    2.7  23.3   78.0   2.0529   4.3 ------	UNKNOWN
174.5395  -1.3048    2.9  12.8  113.9   1.4027   4.0 ------	UNKNOWN
145.3789 -33.3172    3.0  36.5    5.2   1.9049   3.8 ------	UNKNOWN
189.5516   1.6451    3.0  18.3  170.0   1.3517   3.8 ------	UNKNOWN
143.4278 -50.4883    2.4  47.0  -15.5   3.4858   4.7 ------	UNKNOWN
231.4595  15.4639    3.7  59.4 -163.2  11.2082   3.2 ------	UNKNOWN
Plot creation:
Sun May 31 10:46:19 EDT 2015