Analysis for Ground-detected GRB: Trigger=262347
Analysis Summary
Notes:
- 1) No attempt has been made to eliminate the non-significant decimal places.
- 2) This is a special analysis for ground-detected GRB. The event data duration is likely to be shorter than the burst duration. In such cases, the burst durations are found using the quad-rate data, and spectral analyses are only available for event data range.
- 3) Some mask-weighted light curve plots might be missing because the time range is not completely covered by the event data range.
Special note: This burst was outside the BAT calibrated field of view (the FLUX mask region)
in the whole event data range (see figure below),
hence spectral analysis is not available.
FLUX-mask-weighted light curve (pcodethresh=0.05; aperture=CALDB:FLUX)
==========================================================================
           BAT GROUND-DETECTED GRB DATA PROCESSING REPORT
    Process Script Ver: batgrbproduct v2.46
    Process Start Time: Thu Dec 17 19:55:13 EST 2015
             Host Name: bat1
   Current Working Dir: /local/data/bat1/alien/Swift_3rdBATcatalog/event/batevent_reproc/trigger262347
======================================================================

  Trigger: 00262347      Segment: 000

  BAT Trigger Time: 194307720.0
               UTC: 2007-02-27T22:21:58.208   [includes UTCF correction]
       Where From?: Ground analysis (best_duration.txt)
  NOTE: BAT trigger time for ground-detected burst is the T100 start time.

  Analysis Position:   [ source = GCN ]
    RA: 120.571   Dec: -46.312  [deg; J2000]

  Refined Position:   [ source = BAT pre-slew image ]
    RA: 120.571   Dec: -46.312  [deg; J2000]
        { 08h 02m 17.0s , -46d -18' -43.2" }
        +/- 2.6042537801 [arcmin] (estimated 90% radius based on SNR)
    SNR: 7.75071749022

  Angular difference between the GCN position (ra=120.571, dec=-46.312 deg) and this refined position is 0.004 arcmin

  Partial Coding Fraction: 0.03417969    [ including projection effects ]

  Duration
     T90: 3.20000001788139 +/- 1.6
        Measured from: 0
                   to: 3.2     [s; relative to TRIGTIME]
     T50: 3.20000001788139 +/- 1.6
        Measured from: 0
                   to: 3.2     [s; relative to TRIGTIME]
=== Table of the duration information ==

        Value   tstart    tstop
T100    3.200    0.000    3.200
T90     3.200    0.000    3.200
T50     3.200    0.000    3.200
Peak    1.000    0.300    1.300
Click here for the BAT GCN circular template
Special notes of this burst
Image
15.0-350.0 keV image (Event data with DETECTION mask)

#RAcent DECcent POSerr Theta  Phi  Peak_Cts  SNR Name
120.571 -46.312 0.000 57.123 168.715 0.876 7.751 TRIG_00262347
Image time interval: 0.000 to 1.700 [sec]
Lightcurves
Notes:
- 1) The mask-weighted lightcurves have units of either count/det or counts/sec/det, where a det is 0.4 x 0.4 = 0.16 sq cm.
- 2) The verticle lines correspond to following: green dotted lines are T50 interval, black dotted lines are T90 interval, blue solid line(s) is a spacecraft slew start time, and orange solid line(s) is a spacecraft slew end time (for the best duration plot, slew times are marked by green arrows).
- 3) For lightcurves in unit of count rate, time of each bin is in the middle of the bin.
Best duration plot

1 s binning
From T0-310 s to T0+310 s
From T100_start - 20 s to T100_end + 30 s
Full time interval
64 ms binning
Full time interval
From T100_start to T100_end
From T0-5 sec to T0+5 sec
16 ms binning
From T100_start-5 s to T100_start+5 s

8 ms binning
From T100_start-3 s to T100_start+3 s
2 ms binning
From T100_start-1 s to T100_start+1 s

SN=5 or 10 sec. binning (whichever binning is satisfied first)

SN=5 or 10 sec. binning (T < 200 sec)
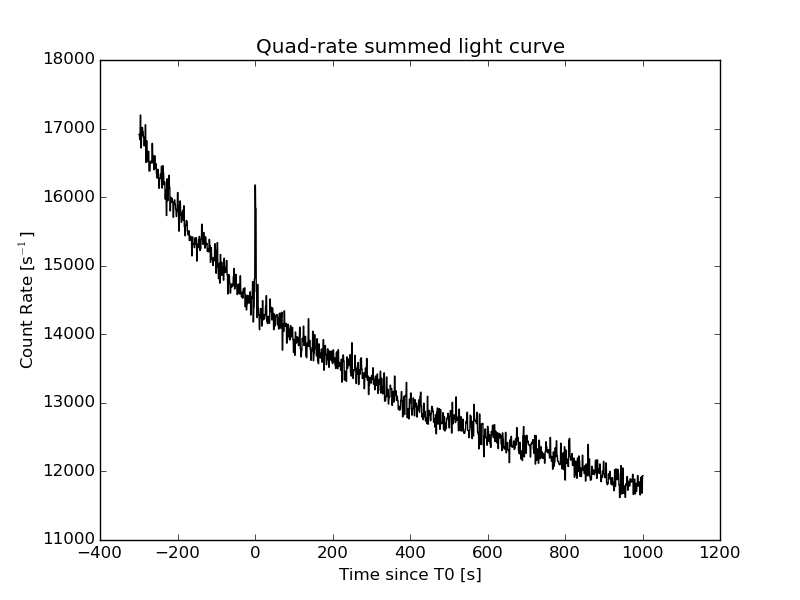
Quad-rate summed light curves (from T0-300s to T0+1000s)
Mask shadow pattern (with DETECTION mask)
IMX = -1.51722202434, IMY = -0.302762848473
TIME vs. PHA plot around the beginning of event data (event_start to event_start+0.64s) with DETECTION mask
TIME vs. DetID plot around the beginning of event data (event_start to event_start+0.64s) with DETECTION mask
100 us light curve (15-350 keV; (event_start to event_start+0.64s)
Spacecraft aspect plot
Bright source in the event data image
Event data image of 15-350 keV band
Time interval of the image:
0.000000 1.700600

# RAcent  DECcent POSerr Theta    Phi  PeakCts   SNR AngSep     Name
#  [deg]    [deg]    ['] [deg]  [deg]                   [']
135.5255 -40.4102    5.4  46.8  160.0   0.0849   2.2    8.7	Vela X-1
202.2335   9.2455    2.1  51.9   46.5   1.0806   5.5 ------	UNKNOWN
120.5715 -46.3117    1.8  57.1  168.7   0.9245   6.5 ------	UNKNOWN
184.9877  36.6505    2.1  45.3    4.9   0.1812   5.4 ------	UNKNOWN
111.8143  -7.7295    2.6  40.1 -142.8   0.1229   4.5 ------	UNKNOWN
Webpage updated on:
Thu Dec 17 20:05:13 EST 2015