Special notes of this burst
Image
Pre-slew 15.0-350.0 keV image (Event data)
#   RAcent    DECcent   POSerr    Theta     Phi              Peak Cts       SNR   Name
   48.4859   -42.9423   0.0043    21.5540   -57.2923         1.8327941     44.347 TRIG_00271019

Foreground time interval of the image:
 -1.008   9.981 (delta_t =  10.989 [sec])
Background time interval of the image:
-113.419  -1.008 (delta_t = 112.411 [sec])
Lightcurves
Notes:
- 1) The mask-weighted light curves are using the flight position.
- 2) Multiple plots of different time binning/intervals are shown to cover all scenarios of short/long GRBs, rate/image triggers, and real/false positives.
- 3) For all the mask-weighted lightcurves, the y-axis units are counts/sec/det where a det is 0.4 x 0.4 = 0.16 sq cm.
- 4) The verticle lines correspond to following: green dotted lines are T50 interval, black dotted lines are T90 interval, blue solid line(s) is a spacecraft slew start time, and orange solid line(s) is a spacecraft slew end time.
- 5) Time of each bin is in the middle of the bin.
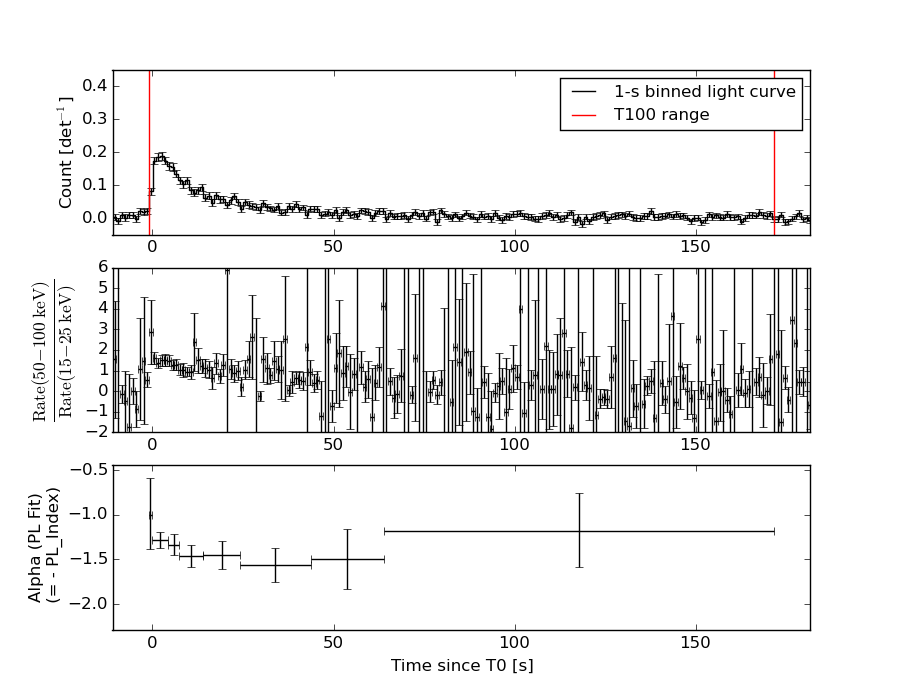
1 s binning
From T0-310 s to T0+310 s

From T100_start - 20 s to T100_end + 30 s

Full time interval
64 ms binning
Full time interval

From T100_start to T100_end
From T0-5 sec to T0+5 sec
16 ms binning
From T100_start-5 s to T100_start+5 s

Blue+Cyan dotted lines: Time interval of the scaled map
From 0.000000 to 0.512000
8 ms binning
From T100_start-3 s to T100_start+3 s
Blue+Cyan dotted lines: Time interval of the scaled map
From 0.000000 to 0.512000
2 ms binning
From T100_start-1 s to T100_start+1 s
Blue+Cyan dotted lines: Time interval of the scaled map
From 0.000000 to 0.512000
SN=5 or 10 sec. binning (whichever binning is satisfied first)
SN=5 or 10 sec. binning (T < 200 sec)
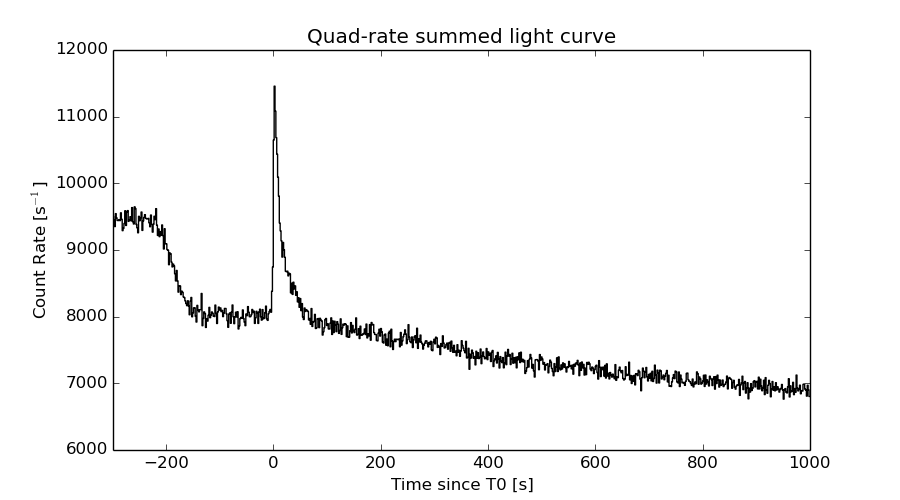
Quad-rate summed light curves (from T0-300s to T0+1000s)
Spectral Evolution
Spectra
Notes:
- 1) The fitting includes the systematic errors.
- 2) When the burst includes telescope slew time periods, the fitting uses an average response file made from multiple 5-s response files through out the slew time plus single time preiod for the non-slew times, and weighted by the total counts in the corresponding time period using addrmf. An average response file is needed becuase a spectral fit using the pre-slew DRM will introduce some errors in both a spectral shape and a normalization if the PHA file contains a lot of the slew/post-slew time interval.
- 3) For fits to more complicated models (e.g. a power-law over a cutoff power-law), the BAT team has decided to require a chi-square improvement of more than 6 for each extra dof.
Time averaged spectrum fit using the average DRM
Power-law model

Time interval is from   -1.008 sec. to  171.536 sec.

Spectral model in power-law:
------------------------------------------------------------
Parameters  : value       lower 90%   higher 90%
Photon index: 1.37558     ( -0.0883   0.088271 )
Norm@50keV  : 1.56413E-03    ( -7.44954e-05   7.43979e-05 )
------------------------------------------------------------
#Fit statistic : Chi-Squared =          43.94 using 59 PHA bins.
# Reduced chi-squared =         0.7709 for     57 degrees of freedom
# Null hypothesis probability =   8.975208e-01

Photon flux (15-150 keV)    in 172.5 sec: 0.189453 ( -0.00928121  0.00930223 ) ph/cm2/s
Energy fluence (15-150 keV)             : 2.62046e-06 ( -1.3935e-07  1.40077e-07 ) ergs/cm2
Cutoff power-law model

Time interval is from   -1.008 sec. to  171.536 sec.
Spectral model in the cutoff power-law:
------------------------------------------------------------
Parameters  : value       lower 90%   higher 90%
Photon index: 1.25751     ( -0.336407   0.162712 )
Epeak [keV] : 330.143      ( -330.082 -330.082 )
Norm@50keV  : 1.78293E-03    ( -0.000281593   0.000776671 )
------------------------------------------------------------
#Fit statistic : Chi-Squared =          43.54 using 59 PHA bins.
# Reduced chi-squared =         0.7775 for     56 degrees of freedom
# Null hypothesis probability =   8.875840e-01

Photon flux (15-150 keV)    in 172.5 sec: 0.188110 ( -0.009909  0.009908 ) ph/cm2/s
Energy fluence (15-150 keV)             : 2.597e-06 ( -1.54922e-07  1.54008e-07 ) ergs/cm2
Band function

Time interval is from   -1.008 sec. to  171.536 sec.

Spectral model in the Band function:
------------------------------------------------------------
Parameters  : value       lower 90%   higher 90%
alpha       : -7.79385E-02   ( -1.61375   -1.61375 )
beta        : -1.41088    ( 1.40954   0.114004 )
Epeak [keV] : 40.1401      ( -40.1512 243.381 )
Norm@50keV   : 1.30660E-02    ( -0.0129929   96049.4 )
------------------------------------------------------------
#Fit statistic : Chi-Squared =          43.22 using 59 PHA bins.
# Reduced chi-squared =         0.7858 for     55 degrees of freedom
# Null hypothesis probability =   8.749994e-01

Photon flux (15-150 keV)    in 172.5 sec:  (    ) ph/cm2/s
Energy fluence (15-150 keV)             : 0 ( 0  0 ) ergs/cm2
Single BB

Spectral model blackbody:
------------------------------------------------------------
Parameters  : value    Lower 90%  Upper 90%
kT [keV]    : 17.0132  (  )
R^2/D10^2   : 1.38651E-02  (   )
(R is the radius in km and D10 is the distance to the source in units of 10 kpc)
------------------------------------------------------------
#Fit statistic : Chi-Squared =         146.05 using 59 PHA bins.
# Reduced chi-squared =         2.5622 for     57 degrees of freedom
# Null hypothesis probability =   9.397448e-10

Energy  Fluence     90% Error
[keV]   [erg/cm2]   [erg/cm2]
15- 25  1.410e-07   1.369e-08
25- 50  6.241e-07   3.959e-08
50-150  1.290e-06   1.264e-07
15-150  2.055e-06   1.207e-07
Thermal bremsstrahlung (OTTB)

Spectral model: thermal bremsstrahlung
------------------------------------------------------------
Parameters  : value         Lower 90%    Upper 90%
kT [keV]    : 200.000       (      )
Norm        : 0.782037       (-0.037121     0.0371164)
------------------------------------------------------------
#Fit statistic : Chi-Squared =          56.20 using 59 PHA bins.
# Reduced chi-squared =         0.9860 for     57 degrees of freedom
# Null hypothesis probability =   5.049095e-01

Energy  Fluence     90% Error
[keV]   [erg/cm2]   [erg/cm2]
15- 25  3.360e-07   1.889e-08
25- 50  6.463e-07   3.631e-08
50-150  1.418e-06   1.030e-07
15-150  2.400e-06   1.294e-07
Double BB

Spectral model: bbodyrad<1> + bbodyrad<2>
------------------------------------------------------------
Parameters  : value         Lower 90%    Upper 90%
kT1 [keV]   : 6.95907        (-1.03016      1.15764)
R1^2/D10^2  : 0.185750        (-0.0753762      0.143139)
kT2 [keV]   : 28.6550        (-3.85467      5.64285)
R2^2/D10^2  : 2.01951E-03    (-0.000903783   0.00130505)
------------------------------------------------------------
#Fit statistic : Chi-Squared =          40.31 using 59 PHA bins.
# Reduced chi-squared =         0.7328 for     55 degrees of freedom
# Null hypothesis probability =   9.311906e-01

Energy  Fluence     90% Error
[keV]   [erg/cm2]   [erg/cm2]
15- 25  2.938e-07   5.649e-08
25- 50  6.138e-07   8.677e-08
50-150  1.696e-06   3.587e-07
15-150  2.604e-06   3.717e-07
Peak spectrum fit
Power-law model

Time interval is from    1.212 sec. to    2.212 sec.

Spectral model in power-law:
------------------------------------------------------------
Parameters  : value       lower 90%   higher 90%
Photon index: 1.32538     ( -0.157659   0.158419 )
Norm@50keV  : 1.33950E-02    ( -0.00126467   0.00126086 )
------------------------------------------------------------
#Fit statistic : Chi-Squared =          64.72 using 59 PHA bins.
# Reduced chi-squared =          1.135 for     57 degrees of freedom
# Null hypothesis probability =   2.252440e-01

Photon flux (15-150 keV)    in 1 sec: 1.60577 ( -0.150219  0.150298 ) ph/cm2/s
Energy fluence (15-150 keV)             : 1.31566e-07 ( -1.40458e-08  1.41863e-08 ) ergs/cm2
Cutoff power-law model

Time interval is from    1.212 sec. to    2.212 sec.
Spectral model in the cutoff power-law:
------------------------------------------------------------
Parameters  : value       lower 90%   higher 90%
Photon index: 0.806380     ( -0.682047   0.575781 )
Epeak [keV] : 118.368      ( -41.4935 -118.368 )
Norm@50keV  : 2.42270E-02    ( -0.0113239   0.0271302 )
------------------------------------------------------------
#Fit statistic : Chi-Squared =          62.49 using 59 PHA bins.
# Reduced chi-squared =          1.116 for     56 degrees of freedom
# Null hypothesis probability =   2.566618e-01

Photon flux (15-150 keV)    in 1 sec: 1.57459 ( -0.15461  0.15445 ) ph/cm2/s
Energy fluence (15-150 keV)             : 1.27076e-07 ( -1.5092e-08  1.5169e-08 ) ergs/cm2
Band function
Time interval is from    1.212 sec. to    2.212 sec.

Spectral model in the Band function:
------------------------------------------------------------
Parameters  : value       lower 90%   higher 90%
alpha       : -0.806701   ( -0.445623   0.668321 )
beta        : -10.0000    ( 10   3.55271e-15 )
Epeak [keV] : 118.400      ( -41.5049 -118.401 )
Norm@50keV   : 2.42163E-02    ( -0.0113161   0.0271503 )
------------------------------------------------------------
#Fit statistic : Chi-Squared =          62.49 using 59 PHA bins.
# Reduced chi-squared =          1.136 for     55 degrees of freedom
# Null hypothesis probability =   2.274783e-01

Photon flux (15-150 keV)    in 1 sec: 1.58501 (    ) ph/cm2/s
Energy fluence (15-150 keV)             : 0 ( 0  0 ) ergs/cm2
Single BB

Spectral model blackbody:
------------------------------------------------------------
Parameters  : value    Lower 90%  Upper 90%
kT [keV]    : 16.9384  (-1.96988  2.25422)
R^2/D10^2   : 0.126414  (-0.0434151   0.0652543)
(R is the radius in km and D10 is the distance to the source in units of 10 kpc)
------------------------------------------------------------
#Fit statistic : Chi-Squared =          83.10 using 59 PHA bins.
# Reduced chi-squared =          1.458 for     57 degrees of freedom
# Null hypothesis probability =   1.363640e-02

Energy  Fluence     90% Error
[keV]   [erg/cm2]   [erg/cm2]
15- 25  7.394e-09   1.302e-09
25- 50  3.262e-08   4.180e-09
50-150  6.675e-08   1.188e-08
15-150  1.068e-07   1.332e-08
Thermal bremsstrahlung (OTTB)

Spectral model: thermal bremsstrahlung
------------------------------------------------------------
Parameters  : value         Lower 90%    Upper 90%
kT [keV]    : 200.000       (      )
Norm        : 6.54960       (-0.615516     0.615518)
------------------------------------------------------------
#Fit statistic : Chi-Squared =          68.48 using 59 PHA bins.
# Reduced chi-squared =          1.201 for     57 degrees of freedom
# Null hypothesis probability =   1.419333e-01

Energy  Fluence     90% Error
[keV]   [erg/cm2]   [erg/cm2]
15- 25  1.641e-08   3.270e-09
25- 50  3.156e-08   1.274e-08
50-150  6.923e-08   3.727e-08
15-150  1.172e-07   3.574e-08
Double BB

Spectral model: bbodyrad<1> + bbodyrad<2>
------------------------------------------------------------
Parameters  : value         Lower 90%    Upper 90%
kT1 [keV]   : 6.50028        (-1.95495      2.64801)
R1^2/D10^2  : 1.69913        (-1.12491      4.55261)
kT2 [keV]   : 24.8642        (-4.8039      9.11231)
R2^2/D10^2  : 2.91513E-02    (-0.0195199   0.0266861)
------------------------------------------------------------
#Fit statistic : Chi-Squared =          60.98 using 59 PHA bins.
# Reduced chi-squared =          1.109 for     55 degrees of freedom
# Null hypothesis probability =   2.696843e-01

Energy  Fluence     90% Error
[keV]   [erg/cm2]   [erg/cm2]
15- 25  1.375e-08   6.668e-09
25- 50  3.030e-08   1.019e-08
50-150  8.307e-08   3.885e-08
15-150  1.271e-07   4.843e-08
Pre-slew spectrum (Pre-slew PHA with pre-slew DRM)
Power-law model

Spectral model in power-law:
------------------------------------------------------------
Parameters  : value       lower 90%   higher 90%
Photon index: 1.34269     ( -0.0706237   0.0705854 )
Norm@50keV  : 9.86643E-03    ( -0.00038643   0.000386306 )
------------------------------------------------------------
#Fit statistic : Chi-Squared =          51.78 using 59 PHA bins.
# Reduced chi-squared =         0.9085 for     57 degrees of freedom
# Null hypothesis probability =   6.705166e-01

Photon flux (15-150 keV)    in 10.99 sec: 1.18685 ( -0.0479799  0.0480413 ) ph/cm2/s
Energy fluence (15-150 keV)             : 1.06078e-06 ( -4.61939e-08  4.63732e-08 ) ergs/cm2
Cutoff power-law model

Spectral model in the cutoff power-law:
------------------------------------------------------------
Parameters  : value       lower 90%   higher 90%
Photon index: 0.964772     ( -0.292481   0.274171 )
Epeak [keV] : 144.604      ( -41.2489 217.76 )
Norm@50keV  : 1.49646E-02    ( -0.00381012   0.00550353 )
------------------------------------------------------------
#Fit statistic : Chi-Squared =          46.10 using 59 PHA bins.
# Reduced chi-squared =         0.8232 for     56 degrees of freedom
# Null hypothesis probability =   8.246823e-01

Photon flux (15-150 keV)    in 10.99 sec: 1.16216 ( -0.05098  0.051 ) ph/cm2/s
Energy fluence (15-150 keV)             : 1.03173e-06 ( -5.13211e-08  5.1165e-08 ) ergs/cm2
Band function

Spectral model in the Band function:
------------------------------------------------------------
Parameters  : value       lower 90%   higher 90%
alpha       : -0.964758   ( -0.207237   0.359294 )
beta        : -10.0000    ( 10   7.10543e-15 )
Epeak [keV] : 144.581      ( -25.7665 217.644 )
Norm@50keV   : 1.49636E-02    ( -0.00381044   0.00550447 )
------------------------------------------------------------
#Fit statistic : Chi-Squared =          46.10 using 59 PHA bins.
# Reduced chi-squared =         0.8381 for     55 degrees of freedom
# Null hypothesis probability =   7.981485e-01

Photon flux (15-150 keV)    in 10.99 sec: 1.16318 (    ) ph/cm2/s
Energy fluence (15-150 keV)             : 0 ( 0  0 ) ergs/cm2
S(25-50 keV) vs. S(50-100 keV) plot
S(25-50 keV)  = 6.08e-07
S(50-100 keV) = 9.37e-07
T90 vs. Hardness ratio plot
T90                                   = 130.368000030518 sec.
Hardness ratio (energy fluence ratio) = 1.54112
Color vs. Color plot
Count Ratio  (25-50 keV) / (15-25 keV) = 1.50983
Count Ratio (50-100 keV) / (15-25 keV) = 1.17971
Mask shadow pattern

IMX = 2.134392873802190E-01, IMY = 3.323675962069452E-01
TIME vs. PHA plot around the trigger time
Blue+Cyan dotted lines: Time interval of the scaled map
From 0.000000 to 0.512000
TIME vs. DetID plot around the trigger time
Blue+Cyan dotted lines: Time interval of the scaled map
From 0.000000 to 0.512000
100 us light curve (15-350 keV)
Blue+Cyan dotted lines: Time interval of the scaled map
From 0.000000 to 0.512000
Spacecraft aspect plot

Bright source in the pre-burst/pre-slew/post-slew images
Pre-burst image of 15-350 keV band
Time interval of the image:
-113.419380 -1.008000

# RAcent  DECcent POSerr Theta    Phi  PeakCts   SNR AngSep     Name
#  [deg]    [deg]    ['] [deg]  [deg]                   [']
170.3156 -60.7611    8.7  44.6  130.4   0.6340   1.3    8.3	Cen X-3
186.2891 -62.7078    5.6  48.3  139.9   1.0123   2.0   10.8	GX 301-2
 75.1735 -39.8467    2.3  19.5    2.3   0.5000   4.9 ------	UNKNOWN
 66.2951  -5.3186    2.3  54.1  -12.6   1.4965   5.1 ------	UNKNOWN
285.8080 -58.6388    2.7  59.1 -166.2   2.9200   4.3 ------	UNKNOWN
320.8343 -53.8954    5.2  54.0 -143.2   1.3839   2.2 ------	UNKNOWN
 41.9337 -13.4994    3.1  50.7  -44.5   2.0728   3.7 ------	UNKNOWN
Pre-slew background subtracted image of 15-350 keV band
Time interval of the image:
-1.008000 9.980600

# RAcent  DECcent POSerr Theta    Phi  PeakCts   SNR AngSep     Name
#  [deg]    [deg]    ['] [deg]  [deg]                   [']
170.3036 -60.6292   53.7  44.7  130.2  -0.0350  -0.2    0.5	Cen X-3
186.6820 -62.8931   10.5  48.3  140.2  -0.1811  -1.1    7.4	GX 301-2
113.7662 -63.5245    2.3  20.3  113.9   0.2189   5.1 ------	UNKNOWN
238.0174 -66.2490    2.6  54.1  167.1   0.7638   4.5 ------	UNKNOWN
 79.4073 -25.3595    2.3  34.3    6.6   0.2355   5.0 ------	UNKNOWN
 48.4859 -42.9423    0.3  21.6  -57.3   1.8327  44.4 ------	UNKNOWN
297.6359 -55.8728    1.9  59.2 -158.1   1.4249   6.1 ------	UNKNOWN
Post-slew image of 15-350 keV band
Time interval of the image:
52.780600 962.163000

# RAcent  DECcent POSerr Theta    Phi  PeakCts   SNR AngSep     Name
#  [deg]    [deg]    ['] [deg]  [deg]                   [']
312.7394 -54.8767    3.8  59.0 -166.2   9.6607   3.1 ------	UNKNOWN
 44.1302   2.4307    3.0  45.6  -34.3   3.0425   3.8 ------	UNKNOWN
 44.4027  11.4008    5.1  54.5  -33.1   5.4171   2.3 ------	UNKNOWN
 35.8270   6.3838    3.1  50.7  -44.5   9.5670   3.7 ------	UNKNOWN
Plot creation:
Sun May 31 10:42:56 EDT 2015