Special notes of this burst
Image
Pre-slew 15.0-350.0 keV image (Event data)

#   RAcent    DECcent   POSerr    Theta     Phi              Peak Cts       SNR   Name
  269.5569   -63.8059   0.0134    18.6060   -68.8529         0.4012042     14.385 TRIG_00273180

Foreground time interval of the image:
 -1.404   5.716 (delta_t =   7.120 [sec])
Background time interval of the image:
-239.056  -1.404 (delta_t = 237.652 [sec])
Lightcurves
Notes:
- 1) The mask-weighted light curves are using the flight position.
- 2) Multiple plots of different time binning/intervals are shown to cover all scenarios of short/long GRBs, rate/image triggers, and real/false positives.
- 3) For all the mask-weighted lightcurves, the y-axis units are counts/sec/det where a det is 0.4 x 0.4 = 0.16 sq cm.
- 4) The verticle lines correspond to following: green dotted lines are T50 interval, black dotted lines are T90 interval, blue solid line(s) is a spacecraft slew start time, and orange solid line(s) is a spacecraft slew end time.
- 5) Time of each bin is in the middle of the bin.
1 s binning
From T0-310 s to T0+310 s

From T100_start - 20 s to T100_end + 30 s

Full time interval
64 ms binning
Full time interval

From T100_start to T100_end

From T0-5 sec to T0+5 sec
16 ms binning
From T100_start-5 s to T100_start+5 s

Blue+Cyan dotted lines: Time interval of the scaled map
From 0.000000 to 1.024000
8 ms binning
From T100_start-3 s to T100_start+3 s

Blue+Cyan dotted lines: Time interval of the scaled map
From 0.000000 to 1.024000
2 ms binning
From T100_start-1 s to T100_start+1 s

Blue+Cyan dotted lines: Time interval of the scaled map
From 0.000000 to 1.024000
SN=5 or 10 sec. binning (whichever binning is satisfied first)
SN=5 or 10 sec. binning (T < 200 sec)
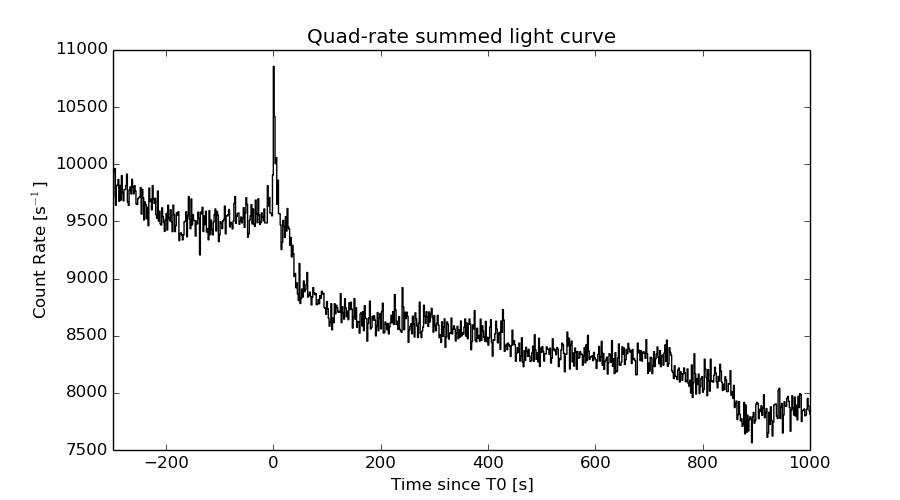
Quad-rate summed light curves (from T0-300s to T0+1000s)
Spectral Evolution

Spectra
Notes:
- 1) The fitting includes the systematic errors.
- 2) When the burst includes telescope slew time periods, the fitting uses an average response file made from multiple 5-s response files through out the slew time plus single time preiod for the non-slew times, and weighted by the total counts in the corresponding time period using addrmf. An average response file is needed becuase a spectral fit using the pre-slew DRM will introduce some errors in both a spectral shape and a normalization if the PHA file contains a lot of the slew/post-slew time interval.
- 3) For fits to more complicated models (e.g. a power-law over a cutoff power-law), the BAT team has decided to require a chi-square improvement of more than 6 for each extra dof.
Time averaged spectrum fit using the average DRM
Power-law model

Time interval is from   -1.404 sec. to    5.716 sec.

Spectral model in power-law:
------------------------------------------------------------
Parameters  : value       lower 90%   higher 90%
Photon index: 1.88303     ( -0.1851   0.191733 )
Norm@50keV  : 3.21230E-03    ( -0.000424739   0.00041944 )
------------------------------------------------------------
#Fit statistic : Chi-Squared =          76.85 using 59 PHA bins.
# Reduced chi-squared =          1.348 for     57 degrees of freedom
# Null hypothesis probability =   4.097095e-02

Photon flux (15-150 keV)    in 7.12 sec: 0.457720 ( -0.0515209  0.0515384 ) ph/cm2/s
Energy fluence (15-150 keV)             : 2.10245e-07 ( -2.7292e-08  2.78549e-08 ) ergs/cm2
Cutoff power-law model

Time interval is from   -1.404 sec. to    5.716 sec.
Spectral model in the cutoff power-law:
------------------------------------------------------------
Parameters  : value       lower 90%   higher 90%
Photon index: -0.686542     ( -2.04746   1.35081 )
Epeak [keV] : 39.5390      ( -4.80411 7.6186 )
Norm@50keV  : 0.117374    ( -0.119752   2.29345 )
------------------------------------------------------------
#Fit statistic : Chi-Squared =          62.29 using 59 PHA bins.
# Reduced chi-squared =          1.112 for     56 degrees of freedom
# Null hypothesis probability =   2.624305e-01

Photon flux (15-150 keV)    in 7.12 sec: 0.426695 ( -0.052299  0.05272 ) ph/cm2/s
Energy fluence (15-150 keV)             : 1.67146e-07 ( -2.60229e-08  3.02223e-08 ) ergs/cm2
Band function

Time interval is from   -1.404 sec. to    5.716 sec.

Spectral model in the Band function:
------------------------------------------------------------
Parameters  : value       lower 90%   higher 90%
alpha       : 4.90854   ( -3.4922   -4.90854 )
beta        : -2.78844    ( -0.734408   0.434549 )
Epeak [keV] : 31.7158      ( -3.63517 2.99485 )
Norm@50keV   : 106.671    ( -11.4026   156.315 )
------------------------------------------------------------
#Fit statistic : Chi-Squared =          55.22 using 59 PHA bins.
# Reduced chi-squared =          1.004 for     55 degrees of freedom
# Null hypothesis probability =   4.661861e-01

Photon flux (15-150 keV)    in 7.12 sec:  (    ) ph/cm2/s
Energy fluence (15-150 keV)             : 1.85109e-07 ( -1.85059e-07  -2.76655e-08 ) ergs/cm2
Single BB

Spectral model blackbody:
------------------------------------------------------------
Parameters  : value    Lower 90%  Upper 90%
kT [keV]    : 9.78437  (-1.01519  1.17158)
R^2/D10^2   : 0.248606  (-0.088637   0.131709)
(R is the radius in km and D10 is the distance to the source in units of 10 kpc)
------------------------------------------------------------
#Fit statistic : Chi-Squared =          63.45 using 59 PHA bins.
# Reduced chi-squared =          1.113 for     57 degrees of freedom
# Null hypothesis probability =   2.595334e-01

Energy  Fluence     90% Error
[keV]   [erg/cm2]   [erg/cm2]
15- 25  3.424e-08   6.807e-09
25- 50  8.253e-08   1.194e-08
50-150  4.042e-08   1.144e-08
15-150  1.572e-07   2.225e-08
Thermal bremsstrahlung (OTTB)
Spectral model: thermal bremsstrahlung
------------------------------------------------------------
Parameters  : value         Lower 90%    Upper 90%
kT [keV]    : 70.7897       (-19.7833      33.5239)
Norm        : 2.28858       (-0.366603     0.429929)
------------------------------------------------------------
#Fit statistic : Chi-Squared =          69.26 using 59 PHA bins.
# Reduced chi-squared =          1.215 for     57 degrees of freedom
# Null hypothesis probability =   1.279084e-01

Energy  Fluence     90% Error
[keV]   [erg/cm2]   [erg/cm2]
15- 25  4.185e-08   6.675e-09
25- 50  6.679e-08   8.658e-09
50-150  8.651e-08   2.895e-08
15-150  1.952e-07   3.222e-08
Double BB

Spectral model: bbodyrad<1> + bbodyrad<2>
------------------------------------------------------------
Parameters  : value         Lower 90%    Upper 90%
kT1 [keV]   : 8.35102        (-1.93106      1.6517)
R1^2/D10^2  : 0.386728        (-0.147102      0.339887)
kT2 [keV]   : 26.1866        (-17.4937      -30.3992)
R2^2/D10^2  : 2.07211E-03    (-0.00126855   0.0501671)
------------------------------------------------------------
#Fit statistic : Chi-Squared =          58.62 using 59 PHA bins.
# Reduced chi-squared =          1.066 for     55 degrees of freedom
# Null hypothesis probability =   3.442392e-01

Energy  Fluence     90% Error
[keV]   [erg/cm2]   [erg/cm2]
15- 25  3.750e-08   1.523e-08
25- 50  7.733e-08   3.377e-08
50-150  7.053e-08   3.747e-08
15-150  1.854e-07   8.201e-08
Peak spectrum fit
Power-law model
Time interval is from   -0.016 sec. to    0.984 sec.

Spectral model in power-law:
------------------------------------------------------------
Parameters  : value       lower 90%   higher 90%
Photon index: 1.82041     ( -0.262731   0.275823 )
Norm@50keV  : 6.32465E-03    ( -0.00115297   0.00112919 )
------------------------------------------------------------
#Fit statistic : Chi-Squared =          57.23 using 59 PHA bins.
# Reduced chi-squared =          1.004 for     57 degrees of freedom
# Null hypothesis probability =   4.666259e-01

Photon flux (15-150 keV)    in 1 sec: 0.878512 ( -0.140245  0.140362 ) ph/cm2/s
Energy fluence (15-150 keV)             : 5.81902e-08 ( -1.05489e-08  1.07903e-08 ) ergs/cm2
Cutoff power-law model

Time interval is from   -0.016 sec. to    0.984 sec.
Spectral model in the cutoff power-law:
------------------------------------------------------------
Parameters  : value       lower 90%   higher 90%
Photon index: 0.167293     ( -2.17434   1.4584 )
Epeak [keV] : 45.7850      ( -9.53226 39.132 )
Norm@50keV  : 5.71701E-02    ( -0.0586737   1.07155 )
------------------------------------------------------------
#Fit statistic : Chi-Squared =          53.31 using 59 PHA bins.
# Reduced chi-squared =         0.9520 for     56 degrees of freedom
# Null hypothesis probability =   5.772830e-01

Photon flux (15-150 keV)    in 1 sec: 0.834630 ( -0.143304  0.145535 ) ph/cm2/s
Energy fluence (15-150 keV)             : 5.00973e-08 ( -1.07219e-08  1.25478e-08 ) ergs/cm2
Band function

Time interval is from   -0.016 sec. to    0.984 sec.

Spectral model in the Band function:
------------------------------------------------------------
Parameters  : value       lower 90%   higher 90%
alpha       : 4.50209   ( -5.81856   -4.50209 )
beta        : -2.37285    ( -0.662946   0.460185 )
Epeak [keV] : 31.3254      ( -5.28819 5.56346 )
Norm@50keV   : 110.897    ( -17.1776   1375.6 )
------------------------------------------------------------
#Fit statistic : Chi-Squared =          52.14 using 59 PHA bins.
# Reduced chi-squared =         0.9481 for     55 degrees of freedom
# Null hypothesis probability =   5.844696e-01

Photon flux (15-150 keV)    in 1 sec:  (    ) ph/cm2/s
Energy fluence (15-150 keV)             : 5.37828e-08 ( -5.37758e-08  -1.10137e-08 ) ergs/cm2
Single BB

Spectral model blackbody:
------------------------------------------------------------
Parameters  : value    Lower 90%  Upper 90%
kT [keV]    : 10.7966  (-1.63414  1.96611)
R^2/D10^2   : 0.327980  (-0.155155   0.281915)
(R is the radius in km and D10 is the distance to the source in units of 10 kpc)
------------------------------------------------------------
#Fit statistic : Chi-Squared =          55.29 using 59 PHA bins.
# Reduced chi-squared =         0.9699 for     57 degrees of freedom
# Null hypothesis probability =   5.396702e-01

Energy  Fluence     90% Error
[keV]   [erg/cm2]   [erg/cm2]
15- 25  7.957e-09   2.216e-09
25- 50  2.196e-08   4.850e-09
50-150  1.425e-08   5.362e-09
15-150  4.417e-08   1.083e-08
Thermal bremsstrahlung (OTTB)

Spectral model: thermal bremsstrahlung
------------------------------------------------------------
Parameters  : value         Lower 90%    Upper 90%
kT [keV]    : 85.1714       (-33.003      80.9643)
Norm        : 4.11366       (-0.85832     1.11805)
------------------------------------------------------------
#Fit statistic : Chi-Squared =          54.81 using 59 PHA bins.
# Reduced chi-squared =         0.9616 for     57 degrees of freedom
# Null hypothesis probability =   5.576797e-01

Energy  Fluence     90% Error
[keV]   [erg/cm2]   [erg/cm2]
15- 25  1.071e-08   2.461e-09
25- 50  1.789e-08   3.565e-09
50-150  2.632e-08   1.536e-08
15-150  5.492e-08   1.843e-08
Double BB
Spectral model: bbodyrad<1> + bbodyrad<2>
------------------------------------------------------------
Parameters  : value         Lower 90%    Upper 90%
kT1 [keV]   : 9.44005        (-5.20843      2.16594)
R1^2/D10^2  : 0.492024        (-0.240934      5.71117)
kT2 [keV]   : 56.6585        (-64.0272      -64.0273)
R2^2/D10^2  : 4.91066E-04    (-0.000336617   0.279274)
------------------------------------------------------------
#Fit statistic : Chi-Squared =          51.97 using 59 PHA bins.
# Reduced chi-squared =         0.9449 for     55 degrees of freedom
# Null hypothesis probability =   5.910593e-01

Energy  Fluence     90% Error
[keV]   [erg/cm2]   [erg/cm2]
15- 25  8.889e-09   4.375e-09
25- 50  2.112e-08   1.024e-08
50-150  2.465e-08   1.128e-08
15-150  5.466e-08   2.252e-08
Pre-slew spectrum (Pre-slew PHA with pre-slew DRM)
Power-law model
Spectral model in power-law:
------------------------------------------------------------
Parameters  : value       lower 90%   higher 90%
Photon index: 1.88303     ( -0.1851   0.191733 )
Norm@50keV  : 3.21230E-03    ( -0.000424739   0.00041944 )
------------------------------------------------------------
#Fit statistic : Chi-Squared =          76.85 using 59 PHA bins.
# Reduced chi-squared =          1.348 for     57 degrees of freedom
# Null hypothesis probability =   4.097095e-02

Photon flux (15-150 keV)    in 7.12 sec: 0.457720 ( -0.0515209  0.0515384 ) ph/cm2/s
Energy fluence (15-150 keV)             : 2.10245e-07 ( -2.7292e-08  2.78549e-08 ) ergs/cm2
Cutoff power-law model
Spectral model in the cutoff power-law:
------------------------------------------------------------
Parameters  : value       lower 90%   higher 90%
Photon index: -0.686542     ( -2.04746   1.35081 )
Epeak [keV] : 39.5390      ( -4.80411 7.6186 )
Norm@50keV  : 0.117374    ( -0.119752   2.29345 )
------------------------------------------------------------
#Fit statistic : Chi-Squared =          62.29 using 59 PHA bins.
# Reduced chi-squared =          1.112 for     56 degrees of freedom
# Null hypothesis probability =   2.624305e-01

Photon flux (15-150 keV)    in 7.12 sec: 0.426695 ( -0.052299  0.05272 ) ph/cm2/s
Energy fluence (15-150 keV)             : 1.67146e-07 ( -2.60229e-08  3.02223e-08 ) ergs/cm2
Band function
Spectral model in the Band function:
------------------------------------------------------------
Parameters  : value       lower 90%   higher 90%
alpha       : 4.90854   ( -3.4922   -4.90854 )
beta        : -2.78844    ( -0.734408   0.434549 )
Epeak [keV] : 31.7158      ( -3.63517 2.99485 )
Norm@50keV   : 106.671    ( -11.4026   156.315 )
------------------------------------------------------------
#Fit statistic : Chi-Squared =          55.22 using 59 PHA bins.
# Reduced chi-squared =          1.004 for     55 degrees of freedom
# Null hypothesis probability =   4.661861e-01

Photon flux (15-150 keV)    in 7.12 sec:  (    ) ph/cm2/s
Energy fluence (15-150 keV)             : 1.85109e-07 ( -1.85059e-07  -2.76655e-08 ) ergs/cm2
S(25-50 keV) vs. S(50-100 keV) plot
S(25-50 keV)  = 6.10e-08
S(50-100 keV) = 6.61e-08
T90 vs. Hardness ratio plot

T90                                   = 6.63999998569489 sec.
Hardness ratio (energy fluence ratio) = 1.08361
Color vs. Color plot
Count Ratio  (25-50 keV) / (15-25 keV) = 1.54964
Count Ratio (50-100 keV) / (15-25 keV) = 0.590795
Mask shadow pattern
IMX = 1.214525430920516E-01, IMY = 3.139821132370270E-01
TIME vs. PHA plot around the trigger time

Blue+Cyan dotted lines: Time interval of the scaled map
From 0.000000 to 1.024000
TIME vs. DetID plot around the trigger time

Blue+Cyan dotted lines: Time interval of the scaled map
From 0.000000 to 1.024000
100 us light curve (15-350 keV)

Blue+Cyan dotted lines: Time interval of the scaled map
From 0.000000 to 1.024000
Spacecraft aspect plot
Bright source in the pre-burst/pre-slew/post-slew images
Pre-burst image of 15-350 keV band
Time interval of the image:
-239.056000 -1.404000

# RAcent  DECcent POSerr Theta    Phi  PeakCts   SNR AngSep     Name
#  [deg]    [deg]    ['] [deg]  [deg]                   [']
170.3293 -60.6700    2.4  40.2   14.4   1.4315   4.8    2.9	Cen X-3
186.6740 -62.7666    0.8  32.2   14.0   3.2860  15.0    0.5	GX 301-2
244.9744 -15.6360    0.5  35.3  149.3   7.6205  23.1    0.4	Sco X-1
255.7643 -37.9299    4.8  15.4 -175.2   0.4596   2.4   11.7	4U 1700-377
256.3753 -36.3870    1.7  17.0 -176.3   1.2321   6.9    3.6	GX 349+2
263.1073 -24.7554    3.2  30.0 -175.9   0.6565   3.6    5.4	GX 1+4
264.8093 -44.5929    6.2  15.3 -138.7   0.3163   1.9    9.0	4U 1735-44
268.4326  -1.4556    6.0  53.6  178.6   1.1637   1.9    3.9	SW J1753.5-0127
270.1993 -24.9225    6.9  32.8 -164.8   0.3488   1.7   10.5	GX 5-1
270.2817 -25.7195    2.4  32.2 -163.9   0.9945   4.9    1.8	GRS 1758-258
274.1016 -14.0019    4.1  44.2 -168.1   0.8961   2.8    5.9	GX 17+2
275.9046 -30.4423    7.4  31.3 -151.0   0.3090   1.6    4.6	H1820-303
284.9013 -25.0362  441.4  40.5 -146.4   0.0076   0.0   10.1	HT1900.1-2455
263.0008 -33.7670    3.2  22.0 -166.2   0.6806   3.6    4.1	GX 354-0
285.5868 -47.8466    2.3  26.9 -112.4   1.2107   5.2 ------	UNKNOWN
284.6095  -2.3423    4.2  59.3 -163.2   4.0533   2.8 ------	UNKNOWN
297.4439 -19.9970    2.7  51.8 -138.5   4.1197   4.3 ------	UNKNOWN
Pre-slew background subtracted image of 15-350 keV band
Time interval of the image:
-1.404000 5.716000

# RAcent  DECcent POSerr Theta    Phi  PeakCts   SNR AngSep     Name
#  [deg]    [deg]    ['] [deg]  [deg]                   [']
170.4322 -60.5077    7.9  40.2   14.7   0.0585   1.5    7.7	Cen X-3
186.3074 -62.6697    0.0  32.4   14.1   0.0740   2.4   11.3	GX 301-2
244.7676 -15.6973    4.5  35.2  148.9  -0.1033  -2.6   12.7	Sco X-1
256.1024 -37.9232    3.7  15.6 -174.4   0.0757   3.1    7.3	4U 1700-377
256.5266 -36.5256    5.6  16.9 -175.7  -0.0496  -2.1    7.6	GX 349+2
262.8608 -24.8549    7.6  29.8 -176.2   0.0470   1.5   10.4	GX 1+4
264.9106 -44.5674   12.1  15.3 -138.7  -0.0231  -0.9   10.1	4U 1735-44
268.4296  -1.5401   14.6  53.5  178.6  -0.0656  -0.8    6.4	SW J1753.5-0127
270.4246 -25.0974    9.5  32.8 -164.3  -0.0358  -1.2    7.7	GX 5-1
270.2267 -25.5663    7.2  32.3 -164.1   0.0473   1.7   11.4	GRS 1758-258
273.8743 -14.1198    3.0  44.0 -168.3   0.1614   3.9    9.1	GX 17+2
275.9546 -30.2236    8.8  31.4 -151.2   0.0398   1.3    8.7	H1820-303
285.1401 -24.8742    9.9  40.8 -146.3  -0.0475  -1.2    6.3	HT1900.1-2455
263.1825 -33.7933    6.2  22.1 -165.8   0.0494   1.9   10.0	GX 354-0
170.1975 -47.3859    2.3  46.4   31.7   0.3691   5.0 ------	UNKNOWN
267.5623 -30.1719    2.2  27.1 -163.2   0.1343   5.3 ------	UNKNOWN
269.5569 -63.8059    0.8  18.6  -68.9   0.4012  14.4 ------	UNKNOWN
Post-slew image of 15-350 keV band
Time interval of the image:
52.044610 808.044600

# RAcent  DECcent POSerr Theta    Phi  PeakCts   SNR AngSep     Name
#  [deg]    [deg]    ['] [deg]  [deg]                   [']
170.3533 -60.6744    3.8  41.6   39.9   3.0516   3.1    3.3	Cen X-3
186.6434 -62.7598    0.6  34.6   46.2  11.7013  18.7    0.7	GX 301-2
255.9641 -37.8432    5.0  27.2  149.3   1.0850   2.3    1.1	4U 1700-377
256.5661 -36.4109    4.0  28.5  151.0   1.4472   2.9    6.3	GX 349+2
263.0031 -24.7292    3.0  39.3  163.8   2.7206   3.8    1.0	GX 1+4
264.7624 -44.4332    4.9  19.5  163.0   0.8921   2.3    1.3	4U 1735-44
270.2093 -25.1285    3.0  38.7  174.2   2.0820   3.8    5.0	GX 5-1
270.2587 -25.7475    2.7  38.0  174.3   2.3264   4.3    2.4	GRS 1758-258
274.1026 -14.0788   11.9  49.8  179.0   0.8656   1.0    6.2	GX 17+2
276.0662 -30.5223    0.0  33.5 -176.6   0.8500   2.0   11.8	H1820-303
285.1108 -24.9918   10.5  40.1 -164.6   0.6602   1.1    5.9	HT1900.1-2455
262.8696 -33.7655    5.0  30.3  162.2   1.1075   2.3    7.3	GX 354-0
251.4864 -45.5979    2.1  20.8  135.6   2.1415   5.4 ------	UNKNOWN
 97.4011 -71.4810    3.6  44.6   -3.3   2.6666   3.2 ------	UNKNOWN
307.2384 -44.3064    3.1  28.8 -121.3   1.9342   3.6 ------	UNKNOWN
344.2546 -53.3979    4.8  37.9  -76.4   2.6626   2.4 ------	UNKNOWN
 20.4103 -56.7917    3.3  48.4  -50.0  10.0715   3.6 ------	UNKNOWN
342.3738 -48.1350    3.4  41.0  -83.4   7.7586   3.4 ------	UNKNOWN
Plot creation:
Sun May 31 10:38:52 EDT 2015