Special notes of this burst
Image
Pre-slew 15.0-350.0 keV image (Event data)
# RAcent DECcent POSerr Theta Phi Peak Cts SNR Name
28.8777 -27.6052 0.0045 14.8252 -27.8000 1.4579100 42.562 TRIG_00277356
Foreground time interval of the image:
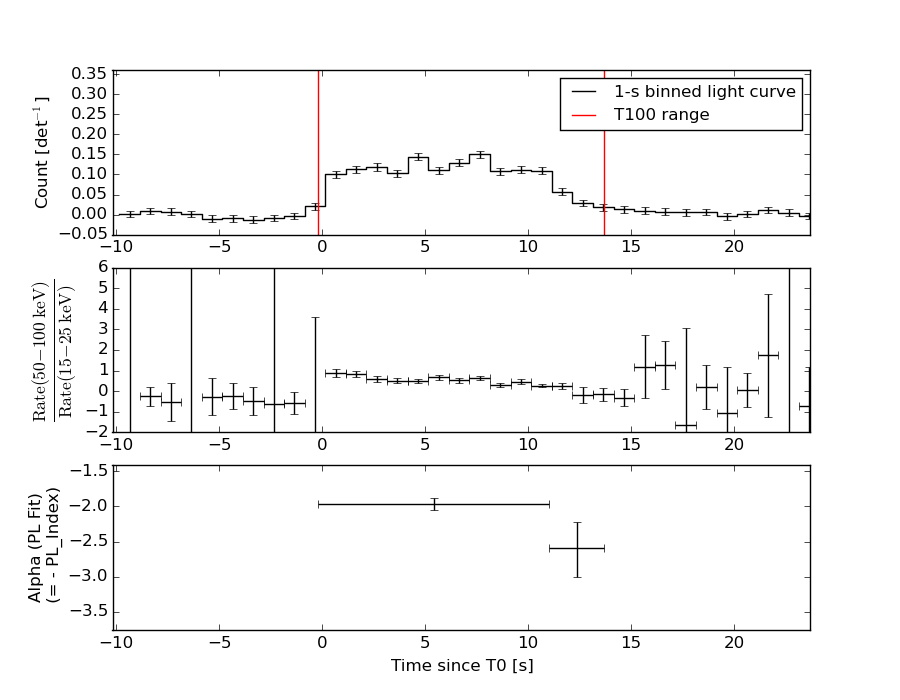
-0.180 13.688 (delta_t = 13.868 [sec])
Background time interval of the image:
-239.848 -0.180 (delta_t = 239.668 [sec])
Lightcurves
Notes:
- 1) The mask-weighted light curves are using the flight position.
- 2) Multiple plots of different time binning/intervals are shown to cover all scenarios of short/long GRBs, rate/image triggers, and real/false positives.
- 3) For all the mask-weighted lightcurves, the y-axis units are counts/sec/det where a det is 0.4 x 0.4 = 0.16 sq cm.
- 4) The verticle lines correspond to following: green dotted lines are T50 interval, black dotted lines are T90 interval, blue solid line(s) is a spacecraft slew start time, and orange solid line(s) is a spacecraft slew end time.
- 5) Time of each bin is in the middle of the bin.
1 s binning
From T0-310 s to T0+310 s
From T100_start - 20 s to T100_end + 30 s
Full time interval
64 ms binning
Full time interval
From T100_start to T100_end
From T0-5 sec to T0+5 sec
16 ms binning
From T100_start-5 s to T100_start+5 s
Blue+Cyan dotted lines: Time interval of the scaled map
From 0.000000 to 1.024000
8 ms binning
From T100_start-3 s to T100_start+3 s
Blue+Cyan dotted lines: Time interval of the scaled map
From 0.000000 to 1.024000
2 ms binning
From T100_start-1 s to T100_start+1 s
Blue+Cyan dotted lines: Time interval of the scaled map
From 0.000000 to 1.024000
SN=5 or 10 sec. binning (whichever binning is satisfied first)
SN=5 or 10 sec. binning (T < 200 sec)
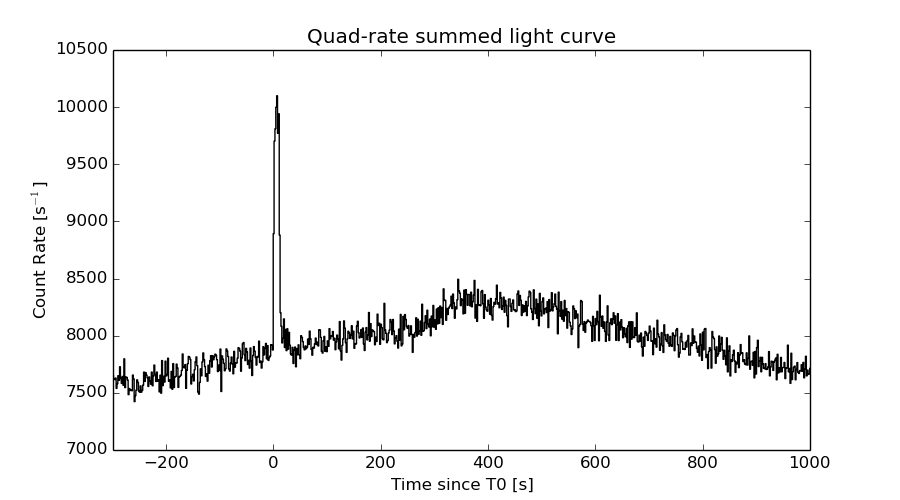
Quad-rate summed light curves (from T0-300s to T0+1000s)
Spectral Evolution
Spectra
Notes:
- 1) The fitting includes the systematic errors.
- 2) When the burst includes telescope slew time periods, the fitting uses an average response file made from multiple 5-s response files through out the slew time plus single time preiod for the non-slew times, and weighted by the total counts in the corresponding time period using addrmf. An average response file is needed becuase a spectral fit using the pre-slew DRM will introduce some errors in both a spectral shape and a normalization if the PHA file contains a lot of the slew/post-slew time interval.
- 3) For fits to more complicated models (e.g. a power-law over a cutoff power-law), the BAT team has decided to require a chi-square improvement of more than 6 for each extra dof.
Time averaged spectrum fit using the average DRM
Power-law model

Time interval is from   -0.180 sec. to   13.688 sec.

Spectral model in power-law:
------------------------------------------------------------
Parameters  : value       lower 90%   higher 90%
Photon index: 2.03359     ( -0.0856606   0.0871251 )
Norm@50keV  : 5.70601E-03    ( -0.000296124   0.000293604 )
------------------------------------------------------------
#Fit statistic : Chi-Squared =          57.80 using 59 PHA bins.
# Reduced chi-squared =          1.014 for     57 degrees of freedom
# Null hypothesis probability =   4.454705e-01

Photon flux (15-150 keV)    in 13.87 sec: 0.869392 ( -0.0389364  0.0390076 ) ph/cm2/s
Energy fluence (15-150 keV)             : 7.31314e-07 ( -3.54821e-08  3.57456e-08 ) ergs/cm2
Cutoff power-law model
Time interval is from   -0.180 sec. to   13.688 sec.
Spectral model in the cutoff power-law:
------------------------------------------------------------
Parameters  : value       lower 90%   higher 90%
Photon index: 1.51158     ( -0.392622   0.35511 )
Epeak [keV] : 40.0347      ( -12.2418 9.19576 )
Norm@50keV  : 1.11693E-02    ( -0.00402107   0.00727837 )
------------------------------------------------------------
#Fit statistic : Chi-Squared =          51.20 using 59 PHA bins.
# Reduced chi-squared =         0.9143 for     56 degrees of freedom
# Null hypothesis probability =   6.567911e-01

Photon flux (15-150 keV)    in 13.87 sec: 0.842357 ( -0.042643  0.042687 ) ph/cm2/s
Energy fluence (15-150 keV)             : 6.90317e-07 ( -4.37002e-08  4.43979e-08 ) ergs/cm2
Band function

Time interval is from   -0.180 sec. to   13.688 sec.

Spectral model in the Band function:
------------------------------------------------------------
Parameters  : value       lower 90%   higher 90%
alpha       : 1.84461   ( -2.93486   -1.84653 )
beta        : -2.20030    ( -0.194674   0.129204 )
Epeak [keV] : 26.5569      ( -3.36176 10.8189 )
Norm@50keV   : 3.44175    ( -3.48834   382.253 )
------------------------------------------------------------
#Fit statistic : Chi-Squared =          45.40 using 59 PHA bins.
# Reduced chi-squared =         0.8254 for     55 degrees of freedom
# Null hypothesis probability =   8.187089e-01

Photon flux (15-150 keV)    in 13.87 sec:  (    ) ph/cm2/s
Energy fluence (15-150 keV)             : 7.00851e-07 ( -7.00754e-07  -3.86501e-08 ) ergs/cm2
Single BB
Spectral model blackbody:
------------------------------------------------------------
Parameters  : value    Lower 90%  Upper 90%
kT [keV]    : 10.0624  (  )
R^2/D10^2   : 0.374946  (   )
(R is the radius in km and D10 is the distance to the source in units of 10 kpc)
------------------------------------------------------------
#Fit statistic : Chi-Squared =         140.15 using 59 PHA bins.
# Reduced chi-squared =         2.4588 for     57 degrees of freedom
# Null hypothesis probability =   5.904208e-09

Energy  Fluence     90% Error
[keV]   [erg/cm2]   [erg/cm2]
15- 25  1.075e-07   8.620e-09
25- 50  2.695e-07   1.325e-08
50-150  1.432e-07   1.830e-08
15-150  5.202e-07   2.628e-08
Thermal bremsstrahlung (OTTB)
Spectral model: thermal bremsstrahlung
------------------------------------------------------------
Parameters  : value         Lower 90%    Upper 90%
kT [keV]    : 64.6727       (-8.46613      10.5344)
Norm        : 4.33042       (-0.33744     0.374126)
------------------------------------------------------------
#Fit statistic : Chi-Squared =          51.71 using 59 PHA bins.
# Reduced chi-squared =         0.9071 for     57 degrees of freedom
# Null hypothesis probability =   6.732584e-01

Energy  Fluence     90% Error
[keV]   [erg/cm2]   [erg/cm2]
15- 25  1.526e-07   9.848e-09
25- 50  2.376e-07   1.026e-08
50-150  2.872e-07   3.079e-08
15-150  6.774e-07   3.676e-08
Double BB
Spectral model: bbodyrad<1> + bbodyrad<2>
------------------------------------------------------------
Parameters  : value         Lower 90%    Upper 90%
kT1 [keV]   : 6.48167        (-0.76834      0.780858)
R1^2/D10^2  : 1.55589        (-0.510299      0.882206)
kT2 [keV]   : 21.8226        (-3.73843      5.59615)
R2^2/D10^2  : 1.25090E-02    (-0.00727311   0.0144313)
------------------------------------------------------------
#Fit statistic : Chi-Squared =          45.94 using 59 PHA bins.
# Reduced chi-squared =         0.8352 for     55 degrees of freedom
# Null hypothesis probability =   8.029111e-01

Energy  Fluence     90% Error
[keV]   [erg/cm2]   [erg/cm2]
15- 25  1.489e-07   1.691e-08
25- 50  2.376e-07   2.788e-08
50-150  3.068e-07   1.048e-07
15-150  6.932e-07   1.334e-07
Peak spectrum fit
Power-law model
Time interval is from    6.800 sec. to    7.800 sec.

Spectral model in power-law:
------------------------------------------------------------
Parameters  : value       lower 90%   higher 90%
Photon index: 1.92549     ( -0.172683   0.181261 )
Norm@50keV  : 9.11579E-03    ( -0.0011069   0.00108567 )
------------------------------------------------------------
#Fit statistic : Chi-Squared =          43.21 using 59 PHA bins.
# Reduced chi-squared =         0.7580 for     57 degrees of freedom
# Null hypothesis probability =   9.114864e-01

Photon flux (15-150 keV)    in 1 sec: 1.32260 ( -0.126399  0.126405 ) ph/cm2/s
Energy fluence (15-150 keV)             : 8.38382e-08 ( -9.79003e-09  1.00026e-08 ) ergs/cm2
Cutoff power-law model
Time interval is from    6.800 sec. to    7.800 sec.
Spectral model in the cutoff power-law:
------------------------------------------------------------
Parameters  : value       lower 90%   higher 90%
Photon index: 1.04580     ( -1.01328   0.788868 )
Epeak [keV] : 44.0687      ( -10.9851 36.7094 )
Norm@50keV  : 2.99708E-02    ( -0.0299896   0.0910342 )
------------------------------------------------------------
#Fit statistic : Chi-Squared =          39.52 using 59 PHA bins.
# Reduced chi-squared =         0.7056 for     56 degrees of freedom
# Null hypothesis probability =   9.534204e-01

Photon flux (15-150 keV)    in 1 sec: 1.28177 ( -0.13012  0.13125 ) ph/cm2/s
Energy fluence (15-150 keV)             : 7.62465e-08 ( -1.10215e-08  1.18597e-08 ) ergs/cm2
Band function
Time interval is from    6.800 sec. to    7.800 sec.

Spectral model in the Band function:
------------------------------------------------------------
Parameters  : value       lower 90%   higher 90%
alpha       : -0.222402   ( -1.47176   4.43278 )
beta        : -2.38990    ( 2.39383   0.437597 )
Epeak [keV] : 36.2917      ( -10.6461 24.3018 )
Norm@50keV   : 0.109313    ( -0.111813   373.195 )
------------------------------------------------------------
#Fit statistic : Chi-Squared =          38.50 using 59 PHA bins.
# Reduced chi-squared =         0.7000 for     55 degrees of freedom
# Null hypothesis probability =   9.554700e-01

Photon flux (15-150 keV)    in 1 sec: 1.28774 ( 5.71226  -0.13005 ) ph/cm2/s
Energy fluence (15-150 keV)             : 7.8412e-08 ( 0  0 ) ergs/cm2
Single BB
Spectral model blackbody:
------------------------------------------------------------
Parameters  : value    Lower 90%  Upper 90%
kT [keV]    : 9.88458  (-1.01635  1.14935)
R^2/D10^2   : 0.658421  (-0.225604   0.33728)
(R is the radius in km and D10 is the distance to the source in units of 10 kpc)
------------------------------------------------------------
#Fit statistic : Chi-Squared =          52.16 using 59 PHA bins.
# Reduced chi-squared =         0.9150 for     57 degrees of freedom
# Null hypothesis probability =   6.570174e-01

Energy  Fluence     90% Error
[keV]   [erg/cm2]   [erg/cm2]
15- 25  1.305e-08   2.080e-09
25- 50  3.191e-08   3.740e-09
50-150  1.610e-08   4.125e-09
15-150  6.106e-08   7.065e-09
Thermal bremsstrahlung (OTTB)
Spectral model: thermal bremsstrahlung
------------------------------------------------------------
Parameters  : value         Lower 90%    Upper 90%
kT [keV]    : 71.3030       (-19.056      30.9578)
Norm        : 6.49638       (-0.922101     1.1143)
------------------------------------------------------------
#Fit statistic : Chi-Squared =          39.73 using 59 PHA bins.
# Reduced chi-squared =         0.6971 for     57 degrees of freedom
# Null hypothesis probability =   9.602085e-01

Energy  Fluence     90% Error
[keV]   [erg/cm2]   [erg/cm2]
15- 25  1.670e-08   2.140e-09
25- 50  2.670e-08   2.780e-09
50-150  3.476e-08   1.096e-08
15-150  7.816e-08   1.242e-08
Double BB
Spectral model: bbodyrad<1> + bbodyrad<2>
------------------------------------------------------------
Parameters  : value         Lower 90%    Upper 90%
kT1 [keV]   : 7.19025        (-2.29391      1.78558)
R1^2/D10^2  : 1.66489        (-0.82819      3.57734)
kT2 [keV]   : 22.9888        (-9.29166      38.3295)
R2^2/D10^2  : 1.50723E-02    (-0.0143786   0.127659)
------------------------------------------------------------
#Fit statistic : Chi-Squared =          39.03 using 59 PHA bins.
# Reduced chi-squared =         0.7097 for     55 degrees of freedom
# Null hypothesis probability =   9.490565e-01

Energy  Fluence     90% Error
[keV]   [erg/cm2]   [erg/cm2]
15- 25  1.565e-08   5.474e-09
25- 50  2.831e-08   1.043e-08
50-150  3.465e-08   1.950e-08
15-150  7.862e-08   3.016e-08
Pre-slew spectrum (Pre-slew PHA with pre-slew DRM)
Power-law model
Spectral model in power-law:
------------------------------------------------------------
Parameters  : value       lower 90%   higher 90%
Photon index: 2.03359     ( -0.0856606   0.0871251 )
Norm@50keV  : 5.70601E-03    ( -0.000296124   0.000293604 )
------------------------------------------------------------
#Fit statistic : Chi-Squared =          57.80 using 59 PHA bins.
# Reduced chi-squared =          1.014 for     57 degrees of freedom
# Null hypothesis probability =   4.454705e-01

Photon flux (15-150 keV)    in 13.87 sec: 0.869392 ( -0.0389364  0.0390076 ) ph/cm2/s
Energy fluence (15-150 keV)             : 7.31314e-07 ( -3.54821e-08  3.57456e-08 ) ergs/cm2
Cutoff power-law model

Spectral model in the cutoff power-law:
------------------------------------------------------------
Parameters  : value       lower 90%   higher 90%
Photon index: 1.51158     ( -0.392622   0.35511 )
Epeak [keV] : 40.0347      ( -12.2418 9.19576 )
Norm@50keV  : 1.11693E-02    ( -0.00402107   0.00727837 )
------------------------------------------------------------
#Fit statistic : Chi-Squared =          51.20 using 59 PHA bins.
# Reduced chi-squared =         0.9143 for     56 degrees of freedom
# Null hypothesis probability =   6.567911e-01

Photon flux (15-150 keV)    in 13.87 sec: 0.842357 ( -0.042643  0.042687 ) ph/cm2/s
Energy fluence (15-150 keV)             : 6.90317e-07 ( -4.37002e-08  4.43979e-08 ) ergs/cm2
Band function
Spectral model in the Band function:
------------------------------------------------------------
Parameters  : value       lower 90%   higher 90%
alpha       : 1.84461   ( -2.93486   -1.84653 )
beta        : -2.20030    ( -0.194674   0.129204 )
Epeak [keV] : 26.5569      ( -3.36176 11.2273 )
Norm@50keV   : 3.44175    ( -3.48834   382.254 )
------------------------------------------------------------
#Fit statistic : Chi-Squared =          45.40 using 59 PHA bins.
# Reduced chi-squared =         0.8254 for     55 degrees of freedom
# Null hypothesis probability =   8.187089e-01

Photon flux (15-150 keV)    in 13.87 sec:  (    ) ph/cm2/s
Energy fluence (15-150 keV)             : 7.00851e-07 ( -7.00754e-07  -3.86501e-08 ) ergs/cm2
S(25-50 keV) vs. S(50-100 keV) plot
S(25-50 keV)  = 2.22e-07
S(50-100 keV) = 2.17e-07
T90 vs. Hardness ratio plot
T90                                   = 11.080000013113 sec.
Hardness ratio (energy fluence ratio) = 0.977477
Color vs. Color plot
Count Ratio  (25-50 keV) / (15-25 keV) = 1.05727
Count Ratio (50-100 keV) / (15-25 keV) = 0.512335
Mask shadow pattern
IMX = 2.341320456674236E-01, IMY = 1.234435913118846E-01
TIME vs. PHA plot around the trigger time
Blue+Cyan dotted lines: Time interval of the scaled map
From 0.000000 to 1.024000
TIME vs. DetID plot around the trigger time
Blue+Cyan dotted lines: Time interval of the scaled map
From 0.000000 to 1.024000
100 us light curve (15-350 keV)
Blue+Cyan dotted lines: Time interval of the scaled map
From 0.000000 to 1.024000
Spacecraft aspect plot
Bright source in the pre-burst/pre-slew/post-slew images
Pre-burst image of 15-350 keV band
Time interval of the image:
-239.848000 -0.180000

# RAcent  DECcent POSerr Theta    Phi  PeakCts   SNR AngSep     Name
#  [deg]    [deg]    ['] [deg]  [deg]                   [']
 30.9837 -64.1733    3.0  34.9   58.2   1.1925   3.8 ------	UNKNOWN
 33.0087 -17.2165    2.2  23.4  -49.8   0.8398   5.3 ------	UNKNOWN
 56.1165  -1.8399    3.1  50.7  -44.4   3.2386   3.7 ------	UNKNOWN
Pre-slew background subtracted image of 15-350 keV band
Time interval of the image:
-0.180000 13.688000

# RAcent  DECcent POSerr Theta    Phi  PeakCts   SNR AngSep     Name
#  [deg]    [deg]    ['] [deg]  [deg]                   [']
327.4157 -42.1454    3.2  37.2  132.3   0.2655   3.6 ------	UNKNOWN
333.4571 -30.5571    2.1  33.2  153.1   0.2729   5.4 ------	UNKNOWN
 28.8777 -27.6052    0.3  14.8  -27.8   1.4580  42.6 ------	UNKNOWN
Post-slew image of 15-350 keV band
Time interval of the image:
400.252580 962.170200

# RAcent  DECcent POSerr Theta    Phi  PeakCts   SNR AngSep     Name
#  [deg]    [deg]    ['] [deg]  [deg]                   [']
135.5117 -40.5469    3.1  46.3  156.6   3.1759   3.7    0.9	Vela X-1
148.4035  27.7680    3.2  26.2    9.8   1.0327   3.6 ------	UNKNOWN
 94.3564 -20.9690    2.9  46.7 -147.2   2.8067   3.9 ------	UNKNOWN
Plot creation:
Sun May 31 10:27:42 EDT 2015