Special notes of this burst
Image
Pre-slew 15.0-350.0 keV image (Event data)

#   RAcent    DECcent   POSerr    Theta     Phi              Peak Cts       SNR   Name
  297.6873   -32.4181   0.0230    28.2113  -134.7361         1.6206704      8.355 TRIG_00277571

Foreground time interval of the image:
-14.000  88.501 (delta_t = 102.501 [sec])
Background time interval of the image:
-68.899 -14.000 (delta_t =  54.899 [sec])
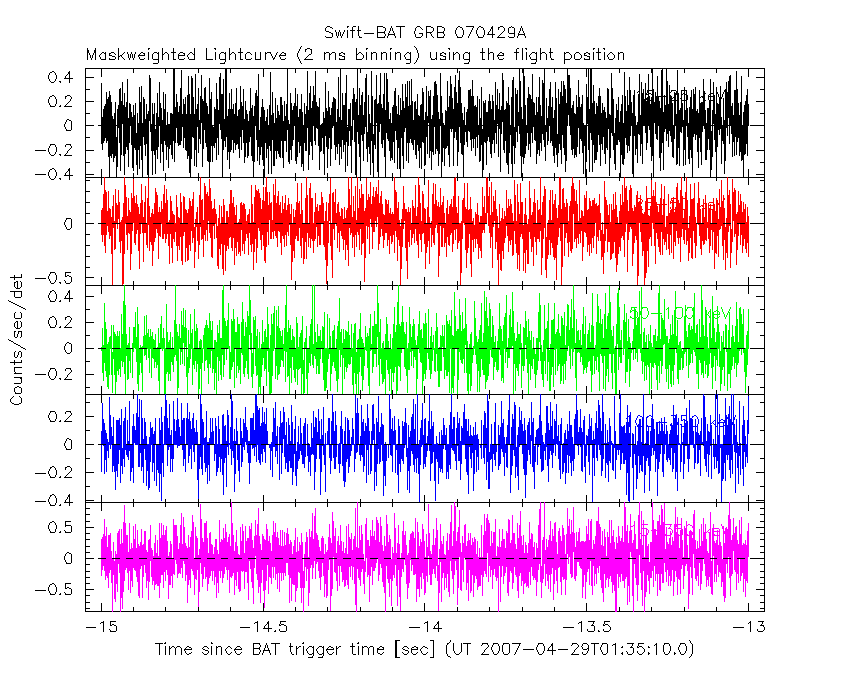
Lightcurves
Notes:
- 1) The mask-weighted light curves are using the flight position.
- 2) Multiple plots of different time binning/intervals are shown to cover all scenarios of short/long GRBs, rate/image triggers, and real/false positives.
- 3) For all the mask-weighted lightcurves, the y-axis units are counts/sec/det where a det is 0.4 x 0.4 = 0.16 sq cm.
- 4) The verticle lines correspond to following: green dotted lines are T50 interval, black dotted lines are T90 interval, blue solid line(s) is a spacecraft slew start time, and orange solid line(s) is a spacecraft slew end time.
- 5) Time of each bin is in the middle of the bin.
1 s binning
From T0-310 s to T0+310 s

From T100_start - 20 s to T100_end + 30 s

Full time interval

64 ms binning
Full time interval

From T100_start to T100_end

From T0-5 sec to T0+5 sec

16 ms binning
From T100_start-5 s to T100_start+5 s

Blue+Cyan dotted lines: Time interval of the scaled map
From 0.000000 to 80.000000
8 ms binning
From T100_start-3 s to T100_start+3 s

Blue+Cyan dotted lines: Time interval of the scaled map
From 0.000000 to 80.000000
2 ms binning
From T100_start-1 s to T100_start+1 s
Blue+Cyan dotted lines: Time interval of the scaled map
From 0.000000 to 80.000000
SN=5 or 10 sec. binning (whichever binning is satisfied first)

SN=5 or 10 sec. binning (T < 200 sec)

Quad-rate summed light curves (from T0-300s to T0+1000s)

Spectral Evolution

Spectra
Notes:
- 1) The fitting includes the systematic errors.
- 2) When the burst includes telescope slew time periods, the fitting uses an average response file made from multiple 5-s response files through out the slew time plus single time preiod for the non-slew times, and weighted by the total counts in the corresponding time period using addrmf. An average response file is needed becuase a spectral fit using the pre-slew DRM will introduce some errors in both a spectral shape and a normalization if the PHA file contains a lot of the slew/post-slew time interval.
- 3) For fits to more complicated models (e.g. a power-law over a cutoff power-law), the BAT team has decided to require a chi-square improvement of more than 6 for each extra dof.
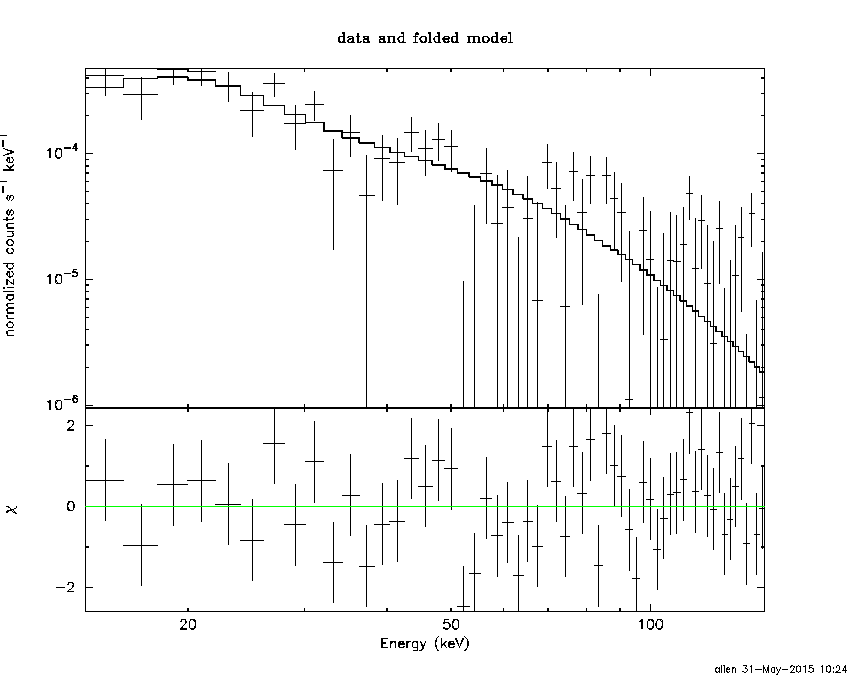
Time averaged spectrum fit using the average DRM
Power-law model

Time interval is from  -14.000 sec. to  180.000 sec.

Spectral model in power-law:
------------------------------------------------------------
Parameters  : value       lower 90%   higher 90%
Photon index: 2.09708     ( -0.252268   0.269745 )
Norm@50keV  : 5.19398E-04    ( -8.99912e-05   8.67977e-05 )
------------------------------------------------------------
#Fit statistic : Chi-Squared =          66.96 using 59 PHA bins.
# Reduced chi-squared =          1.175 for     57 degrees of freedom
# Null hypothesis probability =   1.722031e-01

Photon flux (15-150 keV)    in 194 sec: 8.15968E-02 ( -0.0101321  0.0101369 ) ph/cm2/s
Energy fluence (15-150 keV)             : 9.35934e-07 ( -1.42055e-07  1.46253e-07 ) ergs/cm2
Cutoff power-law model

Time interval is from  -14.000 sec. to  180.000 sec.
Spectral model in the cutoff power-law:
------------------------------------------------------------
Parameters  : value       lower 90%   higher 90%
Photon index: 2.19135     (     )
Epeak [keV] : 83.8099      (   )
Norm@50keV  : 4.40861E-04    (     )
------------------------------------------------------------
#Fit statistic : Chi-Squared =          66.42 using 59 PHA bins.
# Reduced chi-squared =          1.186 for     56 degrees of freedom
# Null hypothesis probability =   1.606631e-01

Photon flux (15-150 keV)    in 194 sec: 8.16555E-02 ( -0.0102354  0.0101002 ) ph/cm2/s
Energy fluence (15-150 keV)             : 9.37916e-07 ( -1.44243e-07  1.40035e-07 ) ergs/cm2
Band function
Time interval is from  -14.000 sec. to  180.000 sec.

Spectral model in the Band function:
------------------------------------------------------------
Parameters  : value       lower 90%   higher 90%
alpha       : 4.83499   ( -4.83499   -4.83499 )
beta        : -2.17842    ( -0.331915   0.286311 )
Epeak [keV] : 19.9891      ( -19.9891 4.63505 )
Norm@50keV   : 296.450    ( -36.6536   949173 )
------------------------------------------------------------
#Fit statistic : Chi-Squared =          66.68 using 59 PHA bins.
# Reduced chi-squared =          1.212 for     55 degrees of freedom
# Null hypothesis probability =   1.344333e-01

Photon flux (15-150 keV)    in 194 sec:  (    ) ph/cm2/s
Energy fluence (15-150 keV)             : 0 ( 0  0 ) ergs/cm2
Single BB

Spectral model blackbody:
------------------------------------------------------------
Parameters  : value    Lower 90%  Upper 90%
kT [keV]    : 7.89982  (-1.15116  1.39961)
R^2/D10^2   : 9.06065E-02  (-0.0436649   0.0816814)
(R is the radius in km and D10 is the distance to the source in units of 10 kpc)
------------------------------------------------------------
#Fit statistic : Chi-Squared =          86.77 using 59 PHA bins.
# Reduced chi-squared =          1.522 for     57 degrees of freedom
# Null hypothesis probability =   6.719189e-03

Energy  Fluence     90% Error
[keV]   [erg/cm2]   [erg/cm2]
15- 25  1.965e-07   4.133e-08
25- 50  3.364e-07   6.373e-08
50-150  8.473e-08   3.466e-08
15-150  6.176e-07   1.154e-07
Thermal bremsstrahlung (OTTB)

Spectral model: thermal bremsstrahlung
------------------------------------------------------------
Parameters  : value         Lower 90%    Upper 90%
kT [keV]    : 55.6970       (-19.2388      37.6241)
Norm        : 0.434969       (-0.0971977     0.13241)
------------------------------------------------------------
#Fit statistic : Chi-Squared =          71.15 using 59 PHA bins.
# Reduced chi-squared =          1.248 for     57 degrees of freedom
# Null hypothesis probability =   9.845162e-02

Energy  Fluence     90% Error
[keV]   [erg/cm2]   [erg/cm2]
15- 25  2.093e-07   3.885e-08
25- 50  3.112e-07   5.044e-08
50-150  3.323e-07   1.182e-07
15-150  8.527e-07   1.586e-07
Double BB

Spectral model: bbodyrad<1> + bbodyrad<2>
------------------------------------------------------------
Parameters  : value         Lower 90%    Upper 90%
kT1 [keV]   : 6.18101        (-1.18034      0.653166)
R1^2/D10^2  : 0.216821        (-0.114462      0.291332)
kT2 [keV]   : 43.1750        (-20.4759      -43.295)
R2^2/D10^2  : 1.56915E-04    (-0.000145804   0.000930492)
------------------------------------------------------------
#Fit statistic : Chi-Squared =          63.17 using 59 PHA bins.
# Reduced chi-squared =          1.148 for     55 degrees of freedom
# Null hypothesis probability =   2.101206e-01

Energy  Fluence     90% Error
[keV]   [erg/cm2]   [erg/cm2]
15- 25  2.295e-07   8.118e-08
25- 50  2.849e-07   8.965e-08
50-150  5.295e-07   2.939e-07
15-150  1.044e-06   3.708e-07
Peak spectrum fit
Power-law model

Time interval is from    4.000 sec. to    5.000 sec.

Spectral model in power-law:
------------------------------------------------------------
Parameters  : value       lower 90%   higher 90%
Photon index: 1.52024     ( -0.620341   0.603928 )
Norm@50keV  : 3.26306E-03    ( -0.00118235   0.00117072 )
------------------------------------------------------------
#Fit statistic : Chi-Squared =          66.04 using 59 PHA bins.
# Reduced chi-squared =          1.159 for     57 degrees of freedom
# Null hypothesis probability =   1.929375e-01

Photon flux (15-150 keV)    in 1 sec: 0.409600 ( -0.149054  0.15044 ) ph/cm2/s
Energy fluence (15-150 keV)             : 3.08561e-08 ( -1.16875e-08  1.20582e-08 ) ergs/cm2
Cutoff power-law model

Time interval is from    4.000 sec. to    5.000 sec.
Spectral model in the cutoff power-law:
------------------------------------------------------------
Parameters  : value       lower 90%   higher 90%
Photon index: -1.46810     ( 1.52598   3.85487 )
Epeak [keV] : 49.2162      ( -13.67 -48.8969 )
Norm@50keV  : 0.152569    ( -0.18686   32205.7 )
------------------------------------------------------------
#Fit statistic : Chi-Squared =          64.69 using 59 PHA bins.
# Reduced chi-squared =          1.155 for     56 degrees of freedom
# Null hypothesis probability =   1.991855e-01

Photon flux (15-150 keV)    in 1 sec: 0.358384 ( -0.149717  0.167475 ) ph/cm2/s
Energy fluence (15-150 keV)             : 2.27852e-08 ( -9.6281e-09  1.64539e-08 ) ergs/cm2
Band function

Time interval is from    4.000 sec. to    5.000 sec.

Spectral model in the Band function:
------------------------------------------------------------
Parameters  : value       lower 90%   higher 90%
alpha       : 4.88366   ( -4.88366   -4.88366 )
beta        : -2.43859    ( 2.43859   1.12587 )
Epeak [keV] : 39.1391      ( -39.1391 14.725 )
Norm@50keV   : 23.2823    ( -7.85374   2.1169e+06 )
------------------------------------------------------------
#Fit statistic : Chi-Squared =          63.88 using 59 PHA bins.
# Reduced chi-squared =          1.161 for     55 degrees of freedom
# Null hypothesis probability =   1.927626e-01

Photon flux (15-150 keV)    in 1 sec:  (    ) ph/cm2/s
Energy fluence (15-150 keV)             : 2.72219e-08 ( 0  0 ) ergs/cm2
Single BB
Spectral model blackbody:
------------------------------------------------------------
Parameters  : value    Lower 90%  Upper 90%
kT [keV]    : 12.5138  (-3.47319  5.72808)
R^2/D10^2   : 9.38214E-02  (-0.0938221   0.217969)
(R is the radius in km and D10 is the distance to the source in units of 10 kpc)
------------------------------------------------------------
#Fit statistic : Chi-Squared =          64.72 using 59 PHA bins.
# Reduced chi-squared =          1.135 for     57 degrees of freedom
# Null hypothesis probability =   2.253477e-01

Energy  Fluence     90% Error
[keV]   [erg/cm2]   [erg/cm2]
15- 25  3.115e-09   1.988e-09
25- 50  1.029e-08   6.265e-09
50-150  9.952e-09   7.080e-09
15-150  2.335e-08   1.513e-08
Thermal bremsstrahlung (OTTB)

Spectral model: thermal bremsstrahlung
------------------------------------------------------------
Parameters  : value         Lower 90%    Upper 90%
kT [keV]    : 187.272       (-137.613      -185.963)
Norm        : 1.69217       (-0.60096     0.977582)
------------------------------------------------------------
#Fit statistic : Chi-Squared =          65.76 using 59 PHA bins.
# Reduced chi-squared =          1.154 for     57 degrees of freedom
# Null hypothesis probability =   1.995173e-01

Energy  Fluence     90% Error
[keV]   [erg/cm2]   [erg/cm2]
15- 25  4.247e-09   2.657e-09
25- 50  8.109e-09   4.897e-09
50-150  1.741e-08   1.081e-08
15-150  2.977e-08   1.775e-08
Double BB

R1^2/D10^2  : 3.74411E-05        (      )
kT2 [keV]   : 10.8719        (-8.61833      5.15281)
R2^2/D10^2  : 0.140801    (-0.107946   0.205719)
------------------------------------------------------------
#Fit statistic : Chi-Squared =          64.72 using 59 PHA bins.
#Fit statistic : Chi-Squared =          63.37 using 59 PHA bins.
#Fit statistic : Chi-Squared =          63.12 using 59 PHA bins.
# Reduced chi-squared =          1.177 for     55 degrees of freedom
# Reduced chi-squared =          1.152 for     55 degrees of freedom
# Reduced chi-squared =          1.148 for     55 degrees of freedom
# Null hypothesis probability =   1.737105e-01
# Null hypothesis probability =   2.051214e-01
# Null hypothesis probability =   2.112943e-01

Energy  Fluence     90% Error
[keV]   [erg/cm2]   [erg/cm2]
15- 25  0.000e+00   0.000e+00
25- 50  0.000e+00   0.000e+00
50-150  0.000e+00   0.000e+00
15-150  0.000e+00   0.000e+00
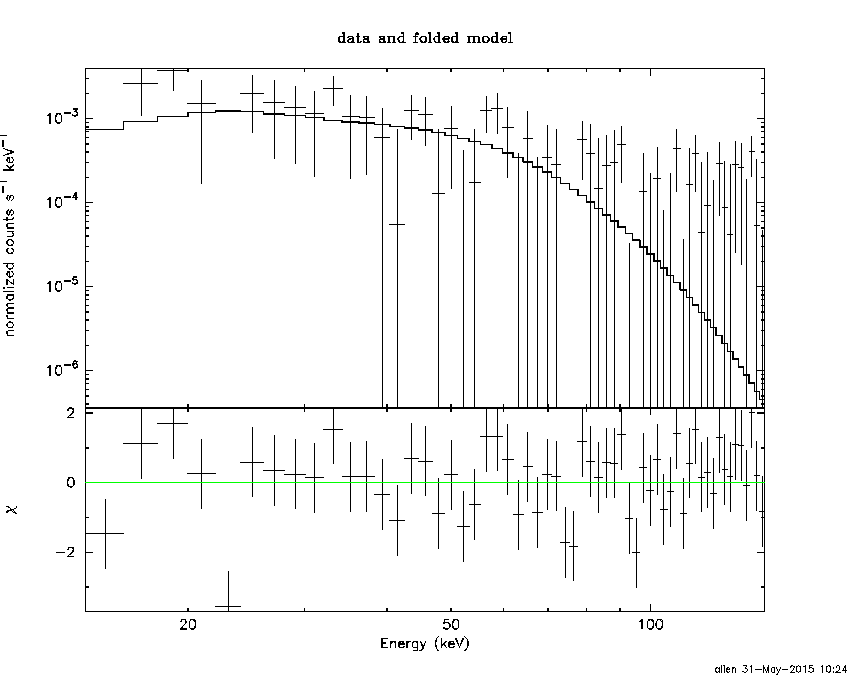
Pre-slew spectrum (Pre-slew PHA with pre-slew DRM)
Power-law model

Spectral model in power-law:
------------------------------------------------------------
Parameters  : value       lower 90%   higher 90%
Photon index: 2.15544     ( -0.237204   0.253763 )
Norm@50keV  : 7.95459E-04    ( -0.000133483   0.000129685 )
------------------------------------------------------------
#Fit statistic : Chi-Squared =          66.72 using 59 PHA bins.
# Reduced chi-squared =          1.171 for     57 degrees of freedom
# Null hypothesis probability =   1.774132e-01

Photon flux (15-150 keV)    in 102.5 sec: 0.128682 ( -0.0154143  0.0154197 ) ph/cm2/s
Energy fluence (15-150 keV)             : 7.62137e-07 ( -1.10016e-07  1.13088e-07 ) ergs/cm2
Cutoff power-law model

Spectral model in the cutoff power-law:
------------------------------------------------------------
Parameters  : value       lower 90%   higher 90%
Photon index: 2.22405     ( -1.99203   -1.99203 )
Epeak [keV] : 127.490      (   )
Norm@50keV  : 7.23378E-04    ( -0.000183268   0.00191793 )
------------------------------------------------------------
#Fit statistic : Chi-Squared =          66.70 using 59 PHA bins.
# Reduced chi-squared =          1.191 for     56 degrees of freedom
# Null hypothesis probability =   1.551006e-01

Photon flux (15-150 keV)    in 102.5 sec: 0.128672 ( -0.015409  0.015364 ) ph/cm2/s
Energy fluence (15-150 keV)             : 7.6107e-07 ( -1.2691e-07  1.13093e-07 ) ergs/cm2
Band function

Spectral model in the Band function:
------------------------------------------------------------
Parameters  : value       lower 90%   higher 90%
alpha       : 4.61688   ( -4.61688   -4.61688 )
beta        : -2.30804    ( -0.350659   0.290918 )
Epeak [keV] : 21.3376      ( -21.3376 3.94731 )
Norm@50keV   : 211.368    ( -25.1226   1.41553e+06 )
------------------------------------------------------------
#Fit statistic : Chi-Squared =          65.08 using 59 PHA bins.
# Reduced chi-squared =          1.183 for     55 degrees of freedom
# Null hypothesis probability =   1.658632e-01

Photon flux (15-150 keV)    in 102.5 sec:  (    ) ph/cm2/s
Energy fluence (15-150 keV)             : 0 ( 0  0 ) ergs/cm2
S(25-50 keV) vs. S(50-100 keV) plot

S(25-50 keV)  = 2.89e-07
S(50-100 keV) = 2.71e-07
T90 vs. Hardness ratio plot
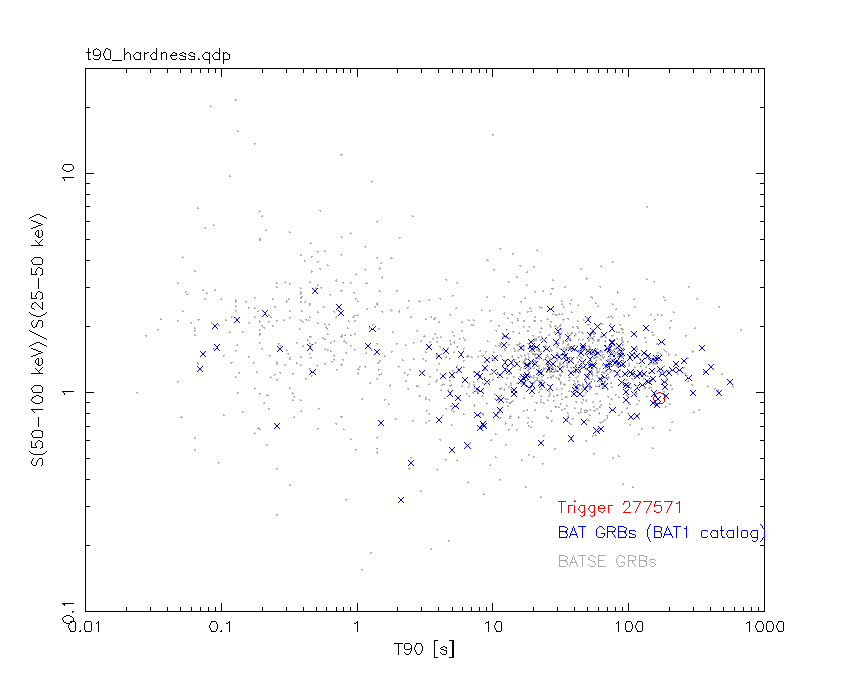
T90                                   = 168 sec.
Hardness ratio (energy fluence ratio) = 0.937716
Color vs. Color plot

Count Ratio  (25-50 keV) / (15-25 keV) = 0.938603
Count Ratio (50-100 keV) / (15-25 keV) = 0.353757
Mask shadow pattern

IMX = -3.775748491186838E-01, IMY = 3.810693254627415E-01
TIME vs. PHA plot around the trigger time

Blue+Cyan dotted lines: Time interval of the scaled map
From 0.000000 to 80.000000
TIME vs. DetID plot around the trigger time
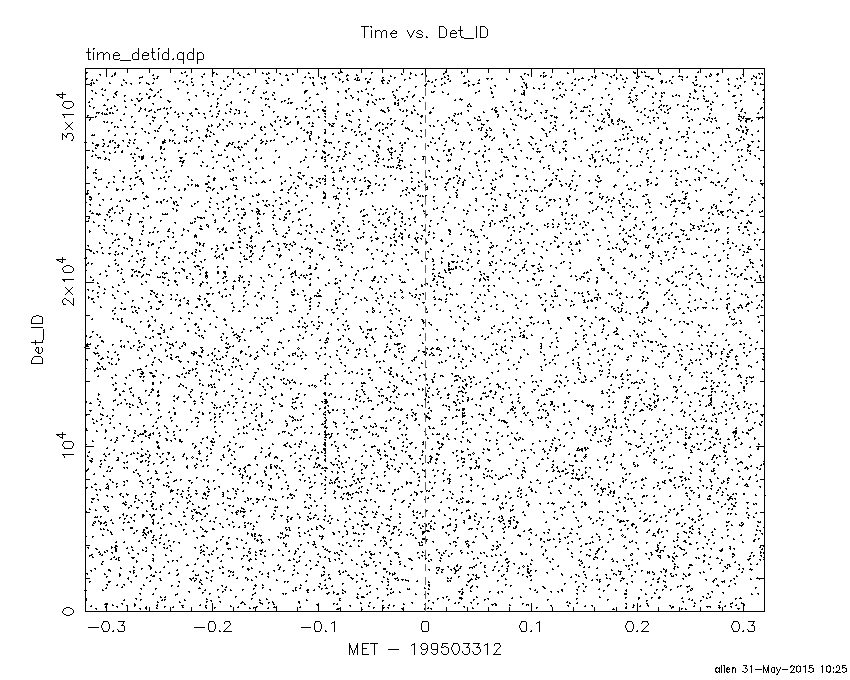
Blue+Cyan dotted lines: Time interval of the scaled map
From 0.000000 to 80.000000
100 us light curve (15-350 keV)

Blue+Cyan dotted lines: Time interval of the scaled map
From 0.000000 to 80.000000
Spacecraft aspect plot

Bright source in the pre-burst/pre-slew/post-slew images
Pre-burst image of 15-350 keV band
Time interval of the image:
-68.899400 -14.000000

# RAcent  DECcent POSerr Theta    Phi  PeakCts   SNR AngSep     Name
#  [deg]    [deg]    ['] [deg]  [deg]                   [']
170.0726 -60.6764    5.2  54.4    6.1  -0.7120  -2.2    7.8	Cen X-3
186.6466 -62.7915    3.4  46.4    7.4   0.4812   3.4    1.3	GX 301-2
244.9865 -15.6498    0.7  33.3  112.8   2.5203  16.9    0.7	Sco X-1
256.0406 -38.0378    6.1   9.2  100.7   0.1366   1.9   11.9	4U 1700-377
256.4687 -36.4640    6.5  10.2  108.2   0.1252   1.8    2.9	GX 349+2
262.9638 -24.8462    2.8  19.7  144.3   0.2961   4.1    6.5	GX 1+4
264.9079 -44.4990    6.5   0.1 -107.8   0.1353   1.8    7.7	4U 1735-44
268.3784  -1.3931    3.9  43.2  154.5   0.5190   3.0    3.6	SW J1753.5-0127
270.2846 -25.0082    3.2  20.0  164.0   0.2570   3.6    4.3	GX 5-1
270.2610 -25.6669    2.1  19.3  164.3   0.3888   5.5    5.1	GRS 1758-258
274.0020 -14.0223    4.2  31.5  166.6   0.2493   2.8    0.9	GX 17+2
275.7825 -30.4037    8.4  16.5 -175.4   0.1047   1.4    7.7	H1820-303
285.1982 -24.9073    3.1  25.6 -163.8   0.2826   3.7    8.9	HT1900.1-2455
262.8254 -33.7720   11.5  10.8  140.6   0.0674   1.0    9.0	GX 354-0
200.6671 -73.8915    2.5  40.6   -8.2   0.4640   4.6 ------	UNKNOWN
Pre-slew background subtracted image of 15-350 keV band
Time interval of the image:
-14.000000 88.500600

# RAcent  DECcent POSerr Theta    Phi  PeakCts   SNR AngSep     Name
#  [deg]    [deg]    ['] [deg]  [deg]                   [']
170.5226 -60.5721    6.7  54.2    6.3  -1.1810  -1.7    6.8	Cen X-3
186.6077 -62.8732    6.1  46.3    7.3  -0.5741  -1.9    6.3	GX 301-2
244.9457 -15.6584    5.0  33.3  112.8   0.7439   2.3    2.2	Sco X-1
255.9804 -38.0247    7.6   9.2  100.6  -0.2405  -1.5   10.8	4U 1700-377
256.3840 -36.2273    8.8  10.4  108.7   0.2001   1.3   12.0	GX 349+2
262.9382 -24.5816    5.0  20.0  144.3   0.3754   2.3   10.6	GX 1+4
264.8160 -44.6556    0.0   0.2  -42.0  -0.1104  -0.7   12.7	4U 1735-44
268.3270  -1.5038   18.8  43.1  154.4  -0.2216  -0.6    3.9	SW J1753.5-0127
270.1106 -25.0714   12.0  19.9  163.6   0.1541   1.0    9.4	GX 5-1
270.2370 -25.5537    4.8  19.4  164.2  -0.4084  -2.6   11.9	GRS 1758-258
273.8850 -13.9815    5.4  31.5  166.3  -0.4159  -2.1    7.8	GX 17+2
275.9032 -30.1942   14.1  16.8 -175.4   0.1294   0.8   10.4	H1820-303
285.1395 -24.7965    3.6  25.7 -164.0  -0.5186  -3.2    9.3	HT1900.1-2455
262.9510 -33.6408    7.0  10.9  141.2   0.2390   1.6   11.8	GX 354-0
152.7522 -66.2105    2.4  57.8   -4.6   4.6604   4.8 ------	UNKNOWN
297.6872 -32.4180    1.4  28.2 -134.7   1.6197   8.4 ------	UNKNOWN
Post-slew image of 15-350 keV band
Time interval of the image:
141.700600 963.120100

# RAcent  DECcent POSerr Theta    Phi  PeakCts   SNR AngSep     Name
#  [deg]    [deg]    ['] [deg]  [deg]                   [']
256.2049 -37.7716    0.0  34.1   77.0   1.1934   1.3   11.2	4U 1700-377
256.2976 -36.2549    0.0  34.2   79.8   0.6089   0.7   12.1	GX 349+2
262.9912 -24.7783    4.4  31.3  103.0   2.1919   2.6    2.2	GX 1+4
264.8481 -44.5802    4.2  28.2   62.8   1.6981   2.7    9.0	4U 1735-44
268.5241  -1.2971    0.0  41.5  140.6  -3.2367  -2.5   13.2	SW J1753.5-0127
270.3462 -25.0315    2.0  25.0  108.0   3.3683   5.7    4.4	GX 5-1
270.3664 -25.8342    3.9  24.7  106.3   1.6614   3.0    6.5	GRS 1758-258
274.0250 -14.0818    3.8  28.3  132.7   1.7012   3.0    2.9	GX 17+2
275.9228 -30.2834    2.8  18.7   98.6   1.8974   4.1    5.0	H1820-303
284.8696 -24.7797    0.0  13.6  128.8   0.5349   1.4   12.4	HT1900.1-2455
288.8026  10.9449    0.7  44.2  175.4  13.1616  15.7    0.3	GRS 1915+105
262.9692 -33.7689    2.7  29.0   85.6   3.0812   4.3    4.1	GX 354-0
277.3700 -23.7370    1.4  19.9  118.6   3.5027   8.2 ------	UNKNOWN
281.5876 -15.6923    2.7  22.2  142.9   1.8518   4.2 ------	UNKNOWN
294.8318 -27.1098    2.7   5.8  161.9   1.9676   4.3 ------	UNKNOWN
352.2650 -83.0309    2.6  53.8    0.9   6.0454   4.4 ------	UNKNOWN
328.3097   5.7376    2.8  48.0 -129.0  11.2854   4.0 ------	UNKNOWN
343.1421 -22.9957    3.4  41.0  -83.4   9.4834   3.4 ------	UNKNOWN
Plot creation:
Sun May 31 10:25:35 EDT 2015