Click here for the BAT GCN circular template
Image
Pre-slew 15.0-350.0 keV image (Event data)
#   RAcent    DECcent   POSerr    Theta     Phi              Peak Cts       SNR   Name
  328.0207   -38.8517   0.0154    25.3780   -58.7521         0.1124605     12.464 TRIG_00277582

Foreground time interval of the image:
 -0.208   0.328 (delta_t =   0.536 [sec])
Background time interval of the image:
-165.267  -0.208 (delta_t = 165.059 [sec])
Lightcurves
Notes:
- 1) The mask-weighted light curves are using the flight position.
- 2) Multiple plots of different time binning/intervals are shown to cover all scenarios of short/long GRBs, rate/image triggers, and real/false positives.
- 3) For all the mask-weighted lightcurves, the y-axis units are counts/sec/det where a det is 0.4 x 0.4 = 0.16 sq cm.
- 4) The verticle lines correspond to following: green dotted lines are T50 interval, black dotted lines are T90 interval, blue solid line(s) is a spacecraft slew start time, and orange solid line(s) is a spacecraft slew end time.
- 5) Time of each bin is in the middle of the bin.
1 s binning
From T0-310 s to T0+310 s
From T100_start - 20 s to T100_end + 30 s
Full time interval

64 ms binning
Full time interval
From T100_start to T100_end

From T0-5 sec to T0+5 sec
16 ms binning
From T100_start-5 s to T100_start+5 s
Blue+Cyan dotted lines: Time interval of the scaled map
From 0.000000 to 0.384000
8 ms binning
From T100_start-3 s to T100_start+3 s
Blue+Cyan dotted lines: Time interval of the scaled map
From 0.000000 to 0.384000
2 ms binning
From T100_start-1 s to T100_start+1 s

Blue+Cyan dotted lines: Time interval of the scaled map
From 0.000000 to 0.384000
SN=5 or 10 sec. binning (whichever binning is satisfied first)
SN=5 or 10 sec. binning (T < 200 sec)
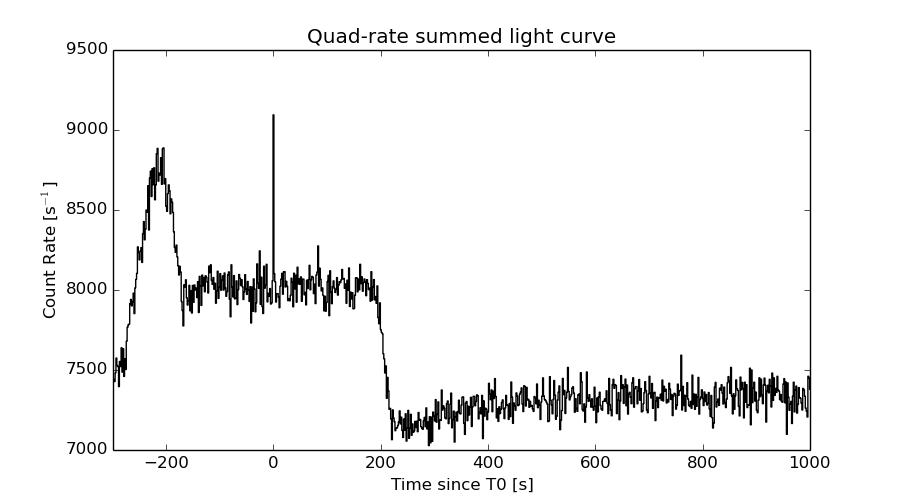
Quad-rate summed light curves (from T0-300s to T0+1000s)
Spectral Evolution

Spectra
Notes:
- 1) The fitting includes the systematic errors.
- 2) When the burst includes telescope slew time periods, the fitting uses an average response file made from multiple 5-s response files through out the slew time plus single time preiod for the non-slew times, and weighted by the total counts in the corresponding time period using addrmf. An average response file is needed becuase a spectral fit using the pre-slew DRM will introduce some errors in both a spectral shape and a normalization if the PHA file contains a lot of the slew/post-slew time interval.
- 3) For fits to more complicated models (e.g. a power-law over a cutoff power-law), the BAT team has decided to require a chi-square improvement of more than 6 for each extra dof.
Time averaged spectrum fit using the average DRM
Power-law model
Time interval is from   -0.208 sec. to    0.328 sec.

Spectral model in power-law:
------------------------------------------------------------
Parameters  : value       lower 90%   higher 90%
Photon index: 1.64518     ( -0.220136   0.227075 )
Norm@50keV  : 1.30708E-02    ( -0.00190965   0.00187761 )
------------------------------------------------------------
#Fit statistic : Chi-Squared =          65.18 using 59 PHA bins.
# Reduced chi-squared =          1.144 for     57 degrees of freedom
# Null hypothesis probability =   2.135354e-01

Photon flux (15-150 keV)    in 0.536 sec: 1.70402 ( -0.226196  0.226268 ) ph/cm2/s
Energy fluence (15-150 keV)             : 6.51867e-08 ( -1.00305e-08  1.02027e-08 ) ergs/cm2
Cutoff power-law model

Time interval is from   -0.208 sec. to    0.328 sec.
Spectral model in the cutoff power-law:
------------------------------------------------------------
Parameters  : value       lower 90%   higher 90%
Photon index: 1.09655     ( -1.24382   0.722239 )
Epeak [keV] : 72.6969      ( -23.6655 -72.7552 )
Norm@50keV  : 2.66321E-02    ( -0.0150491   0.110485 )
------------------------------------------------------------
#Fit statistic : Chi-Squared =          64.24 using 59 PHA bins.
# Reduced chi-squared =          1.147 for     56 degrees of freedom
# Null hypothesis probability =   2.101636e-01

Photon flux (15-150 keV)    in 0.536 sec: 1.67832 ( -0.23202  0.23101 ) ph/cm2/s
Energy fluence (15-150 keV)             : 6.17783e-08 ( -1.18519e-08  1.18054e-08 ) ergs/cm2
Band function
Time interval is from   -0.208 sec. to    0.328 sec.

Spectral model in the Band function:
------------------------------------------------------------
Parameters  : value       lower 90%   higher 90%
alpha       : 0.255771   ( -2.97737   -0.282016 )
beta        : -2.00384    ( 2.00708   0.433586 )
Epeak [keV] : 40.9500      ( -19.1553 76.4173 )
Norm@50keV   : 0.210464    ( -0.243753   494.714 )
------------------------------------------------------------
#Fit statistic : Chi-Squared =          62.10 using 59 PHA bins.
# Reduced chi-squared =          1.129 for     55 degrees of freedom
# Null hypothesis probability =   2.379284e-01

Photon flux (15-150 keV)    in 0.536 sec:  (    ) ph/cm2/s
Energy fluence (15-150 keV)             : 6.20157e-08 ( -6.2012e-08  -1.05502e-08 ) ergs/cm2
Single BB

Spectral model blackbody:
------------------------------------------------------------
Parameters  : value    Lower 90%  Upper 90%
kT [keV]    : 11.5309  (-1.65178  2.02258)
R^2/D10^2   : 0.496582  (-0.22287   0.378216)
(R is the radius in km and D10 is the distance to the source in units of 10 kpc)
------------------------------------------------------------
#Fit statistic : Chi-Squared =          72.88 using 59 PHA bins.
# Reduced chi-squared =          1.279 for     57 degrees of freedom
# Null hypothesis probability =   7.644059e-02

Energy  Fluence     90% Error
[keV]   [erg/cm2]   [erg/cm2]
15- 25  7.453e-09   1.808e-09
25- 50  2.236e-08   4.079e-09
50-150  1.739e-08   5.837e-09
15-150  4.720e-08   8.533e-09
Thermal bremsstrahlung (OTTB)

Spectral model: thermal bremsstrahlung
------------------------------------------------------------
Parameters  : value         Lower 90%    Upper 90%
kT [keV]    : 143.784       (-62.77      -141.861)
Norm        : 7.10785       (-1.03293     1.36555)
------------------------------------------------------------
#Fit statistic : Chi-Squared =          64.28 using 59 PHA bins.
# Reduced chi-squared =          1.128 for     57 degrees of freedom
# Null hypothesis probability =   2.369168e-01

Energy  Fluence     90% Error
[keV]   [erg/cm2]   [erg/cm2]
15- 25  9.818e-09   5.443e-09
25- 50  1.809e-08   9.684e-09
50-150  3.507e-08   2.116e-08
15-150  6.297e-08   3.241e-08
Double BB

------------------------------------------------------------
Parameters  : value         Lower 90%    Upper 90%
kT1 [keV]   : 9.09957        (-2.49976      2.3682)
R1^2/D10^2  : 1.00972        (      )
kT2 [keV]   : 59.4687        (-39.1855      -59.9657)
R2^2/D10^2  : 1.43390E-03    (-0.00129331   0.0371288)
------------------------------------------------------------
#Fit statistic : Chi-Squared =          61.39 using 59 PHA bins.
#Fit statistic : Chi-Squared =          61.04 using 59 PHA bins.
# Reduced chi-squared =          1.116 for     55 degrees of freedom
# Reduced chi-squared =          1.110 for     55 degrees of freedom
# Null hypothesis probability =   2.577680e-01
# Null hypothesis probability =   2.678359e-01

Energy  Fluence     90% Error
[keV]   [erg/cm2]   [erg/cm2]
15- 25  9.223e-09   5.245e-09
25- 50  2.026e-08   9.275e-09
50-150  3.267e-08   1.948e-08
15-150  6.215e-08   2.748e-08
Peak spectrum fit
Power-law model

Time interval is from   -0.438 sec. to    0.562 sec.

Spectral model in power-law:
------------------------------------------------------------
Parameters  : value       lower 90%   higher 90%
Photon index: 1.83598     ( -0.235974   0.248678 )
Norm@50keV  : 7.90359E-03    ( -0.00134905   0.00131953 )
------------------------------------------------------------
#Fit statistic : Chi-Squared =          64.60 using 59 PHA bins.
# Reduced chi-squared =          1.133 for     57 degrees of freedom
# Null hypothesis probability =   2.283204e-01

Photon flux (15-150 keV)    in 1 sec: 1.10466 ( -0.15627  0.156279 ) ph/cm2/s
Energy fluence (15-150 keV)             : 7.26902e-08 ( -1.2269e-08  1.25955e-08 ) ergs/cm2
Cutoff power-law model

Time interval is from   -0.438 sec. to    0.562 sec.
Spectral model in the cutoff power-law:
------------------------------------------------------------
Parameters  : value       lower 90%   higher 90%
Photon index: 0.370660     ( -1.91548   1.30856 )
Epeak [keV] : 43.5862      ( -8.99209 43.055 )
Norm@50keV  : 6.03172E-02    ( -0.0604056   0.873753 )
------------------------------------------------------------
#Fit statistic : Chi-Squared =          60.86 using 59 PHA bins.
# Reduced chi-squared =          1.087 for     56 degrees of freedom
# Null hypothesis probability =   3.051910e-01

Photon flux (15-150 keV)    in 1 sec: 1.06235 ( -0.159254  0.16041 ) ph/cm2/s
Energy fluence (15-150 keV)             : 6.23003e-08 ( -1.26643e-08  1.51505e-08 ) ergs/cm2
Band function

Time interval is from   -0.438 sec. to    0.562 sec.

Spectral model in the Band function:
------------------------------------------------------------
Parameters  : value       lower 90%   higher 90%
alpha       : 0.766007   ( -2.00092   -0.792484 )
beta        : -2.46633    ( 2.46804   0.58615 )
Epeak [keV] : 35.8693      ( -12.1172 18.7144 )
Norm@50keV   : 0.379662    ( -0.442388   285.221 )
------------------------------------------------------------
#Fit statistic : Chi-Squared =          59.01 using 59 PHA bins.
# Reduced chi-squared =          1.073 for     55 degrees of freedom
# Null hypothesis probability =   3.312718e-01

Photon flux (15-150 keV)    in 1 sec:  (    ) ph/cm2/s
Energy fluence (15-150 keV)             : 6.67837e-08 ( -6.67767e-08  -1.27896e-08 ) ergs/cm2
Single BB
Spectral model blackbody:
------------------------------------------------------------
Parameters  : value    Lower 90%  Upper 90%
kT [keV]    : 10.0498  (-1.37596  1.63008)
R^2/D10^2   : 0.538984  (-0.235886   0.401496)
(R is the radius in km and D10 is the distance to the source in units of 10 kpc)
------------------------------------------------------------
#Fit statistic : Chi-Squared =          63.82 using 59 PHA bins.
# Reduced chi-squared =          1.120 for     57 degrees of freedom
# Null hypothesis probability =   2.492266e-01

Energy  Fluence     90% Error
[keV]   [erg/cm2]   [erg/cm2]
15- 25  1.110e-08   2.587e-09
25- 50  2.780e-08   5.950e-09
50-150  1.472e-08   5.748e-09
15-150  5.363e-08   1.033e-08
Thermal bremsstrahlung (OTTB)
Spectral model: thermal bremsstrahlung
------------------------------------------------------------
Parameters  : value         Lower 90%    Upper 90%
kT [keV]    : 79.7616       (-28.756      62.8444)
Norm        : 5.27477       (-0.966525     1.27128)
------------------------------------------------------------
#Fit statistic : Chi-Squared =          62.04 using 59 PHA bins.
# Reduced chi-squared =          1.088 for     57 degrees of freedom
# Null hypothesis probability =   3.013758e-01

Energy  Fluence     90% Error
[keV]   [erg/cm2]   [erg/cm2]
15- 25  1.368e-08   2.485e-09
25- 50  2.251e-08   4.005e-09
50-150  3.171e-08   1.689e-08
15-150  6.791e-08   2.300e-08
Double BB
Spectral model: bbodyrad<1> + bbodyrad<2>
------------------------------------------------------------
Parameters  : value         Lower 90%    Upper 90%
kT1 [keV]   : 8.71892        (-3.31648      1.88736)
R1^2/D10^2  : 0.828564        (-0.454269      1.86848)
kT2 [keV]   : 52.4426        (-55.9315      -55.9316)
R2^2/D10^2  : 8.46895E-04    (-0.000625268   0.158582)
------------------------------------------------------------
#Fit statistic : Chi-Squared =          58.59 using 59 PHA bins.
# Reduced chi-squared =          1.065 for     55 degrees of freedom
# Null hypothesis probability =   3.450209e-01

Energy  Fluence     90% Error
[keV]   [erg/cm2]   [erg/cm2]
15- 25  1.230e-08   4.993e-09
25- 50  2.615e-08   9.927e-09
50-150  3.131e-08   1.666e-08
15-150  6.975e-08   2.541e-08
Pre-slew spectrum (Pre-slew PHA with pre-slew DRM)
Power-law model

Spectral model in power-law:
------------------------------------------------------------
Parameters  : value       lower 90%   higher 90%
Photon index: 1.64518     ( -0.220136   0.227075 )
Norm@50keV  : 1.30708E-02    ( -0.00190965   0.00187761 )
------------------------------------------------------------
#Fit statistic : Chi-Squared =          65.18 using 59 PHA bins.
# Reduced chi-squared =          1.144 for     57 degrees of freedom
# Null hypothesis probability =   2.135354e-01

Photon flux (15-150 keV)    in 0.536 sec: 1.70402 ( -0.226196  0.226268 ) ph/cm2/s
Energy fluence (15-150 keV)             : 6.51867e-08 ( -1.00305e-08  1.02027e-08 ) ergs/cm2
Cutoff power-law model

Spectral model in the cutoff power-law:
------------------------------------------------------------
Parameters  : value       lower 90%   higher 90%
Photon index: 1.09655     ( -1.24382   0.722239 )
Epeak [keV] : 72.6969      ( -26.5711 -72.7552 )
Norm@50keV  : 2.66321E-02    ( -0.0150491   0.110485 )
------------------------------------------------------------
#Fit statistic : Chi-Squared =          64.24 using 59 PHA bins.
# Reduced chi-squared =          1.147 for     56 degrees of freedom
# Null hypothesis probability =   2.101636e-01

Photon flux (15-150 keV)    in 0.536 sec: 1.67832 ( -0.23202  0.23101 ) ph/cm2/s
Energy fluence (15-150 keV)             : 6.17783e-08 ( -1.18519e-08  1.18054e-08 ) ergs/cm2
Band function

Spectral model in the Band function:
------------------------------------------------------------
Parameters  : value       lower 90%   higher 90%
alpha       : 0.255771   ( -2.96759   -0.282016 )
beta        : -2.00384    ( 2.00708   0.433586 )
Epeak [keV] : 40.9500      ( -19.1553 76.0419 )
Norm@50keV   : 0.210464    ( -0.243753   494.751 )
------------------------------------------------------------
#Fit statistic : Chi-Squared =          62.10 using 59 PHA bins.
# Reduced chi-squared =          1.129 for     55 degrees of freedom
# Null hypothesis probability =   2.379284e-01

Photon flux (15-150 keV)    in 0.536 sec:  (    ) ph/cm2/s
Energy fluence (15-150 keV)             : 6.20157e-08 ( -6.2012e-08  -1.05502e-08 ) ergs/cm2
S(25-50 keV) vs. S(50-100 keV) plot
S(25-50 keV)  = 1.72e-08
S(50-100 keV) = 2.20e-08
T90 vs. Hardness ratio plot
T90                                   = 0.488000005483627 sec.
Hardness ratio (energy fluence ratio) = 1.27907
Color vs. Color plot

Count Ratio  (25-50 keV) / (15-25 keV) = 1.2541
Count Ratio (50-100 keV) / (15-25 keV) = 0.822309
Mask shadow pattern

IMX = 2.460721638085664E-01, IMY = 4.055484913668132E-01
TIME vs. PHA plot around the trigger time
Blue+Cyan dotted lines: Time interval of the scaled map
From 0.000000 to 0.384000
TIME vs. DetID plot around the trigger time
Blue+Cyan dotted lines: Time interval of the scaled map
From 0.000000 to 0.384000
100 us light curve (15-350 keV)

Blue+Cyan dotted lines: Time interval of the scaled map
From 0.000000 to 0.384000
Spacecraft aspect plot
Bright source in the pre-burst/pre-slew/post-slew images
Pre-burst image of 15-350 keV band
Time interval of the image:
-165.267410 -0.208000

# RAcent  DECcent POSerr Theta    Phi  PeakCts   SNR AngSep     Name
#  [deg]    [deg]    ['] [deg]  [deg]                   [']
256.0689 -37.9349   26.4  34.1   76.8   0.1231   0.4    6.7	4U 1700-377
256.5123 -36.5752    9.1  33.9   79.3  -0.3721  -1.3    9.9	GX 349+2
262.9840 -24.8244    6.9  31.2  103.0   0.4306   1.7    4.9	GX 1+4
264.8647 -44.3334   10.2  28.1   63.3   0.2180   1.1    8.7	4U 1735-44
268.4520  -1.3481   42.3  41.5  140.5  -0.1072  -0.3    8.0	SW J1753.5-0127
270.2889 -25.0590    2.3  25.0  108.0   0.8914   4.9    1.2	GX 5-1
270.4493 -25.8900    0.0  24.6  106.3   0.2653   1.5   11.9	GRS 1758-258
273.9518 -14.0761   13.9  28.3  132.8   0.1556   0.8    3.9	GX 17+2
275.9067 -30.3910    3.3  18.6   98.4   0.5155   3.5    1.7	H1820-303
285.2024 -25.0392    3.8  13.2  128.9  -0.3666  -3.0   11.5	HT1900.1-2455
288.8156  10.9389    1.1  44.2  175.5   2.5021  10.0    1.1	GRS 1915+105
262.9668 -33.7142    3.9  29.0   85.8   0.6536   3.0    7.3	GX 354-0
356.6698 -41.5522    4.3  47.1  -53.2   2.2084   2.7 ------	UNKNOWN
331.0474   0.1642    3.1  45.3 -121.3   2.8143   3.8 ------	UNKNOWN
Pre-slew background subtracted image of 15-350 keV band
Time interval of the image:
-0.208000 0.328000

# RAcent  DECcent POSerr Theta    Phi  PeakCts   SNR AngSep     Name
#  [deg]    [deg]    ['] [deg]  [deg]                   [']
255.8322 -37.7221    7.3  34.4   77.2   0.0228   1.6   10.4	4U 1700-377
256.5819 -36.5655    8.9  33.8   79.3   0.0182   1.3   11.1	GX 349+2
263.1805 -24.7243   11.9  31.1  103.3   0.0114   1.0    9.4	GX 1+4
264.7550 -44.3921  686.3  28.2   63.3   0.0002   0.0    3.5	4U 1735-44
268.2335  -1.4745    7.3  41.5  140.2  -0.0292  -1.6    8.2	SW J1753.5-0127
270.1013 -25.2058    0.0  25.1  107.5  -0.0129  -1.4   12.5	GX 5-1
270.4860 -25.6166    0.0  24.6  107.0  -0.0097  -1.1   12.5	GRS 1758-258
274.0813 -13.9940   13.3  28.3  133.1  -0.0084  -0.9    5.1	GX 17+2
276.0909 -30.4638 2700.0  18.5   98.3   0.0000   0.0   10.4	H1820-303
285.0681 -25.0117    7.2  13.3  128.7   0.0120   1.6    5.7	HT1900.1-2455
288.9120  10.9038    5.5  44.1  175.6   0.0277   2.1    7.1	GRS 1915+105
263.0197 -33.9745    4.2  28.9   85.3   0.0290   2.8    8.5	GX 354-0
272.2113  -0.9007    2.4  39.6  145.6   0.0685   4.8 ------	UNKNOWN
292.7366  11.9320    2.3  44.6 -178.9   0.0667   5.1 ------	UNKNOWN
328.0207 -38.8517    0.9  25.4  -58.8   0.1125  12.5 ------	UNKNOWN
308.1343  24.8955    1.9  58.2 -160.8   0.2572   6.0 ------	UNKNOWN
Post-slew image of 15-350 keV band
Time interval of the image:
228.332590 962.654100

# RAcent  DECcent POSerr Theta    Phi  PeakCts   SNR AngSep     Name
#  [deg]    [deg]    ['] [deg]  [deg]                   [']
285.0202 -25.0517   11.4  38.6  123.0  -0.8540  -1.0    7.9	HT1900.1-2455
284.4977 -29.7187    2.7  36.7  115.9   3.2554   4.2 ------	UNKNOWN
293.9803 -71.5944    2.5  37.0   42.1   2.5632   4.6 ------	UNKNOWN
308.4216 -65.0131    2.6  28.5   42.3   1.6906   4.5 ------	UNKNOWN
 58.4027 -70.7947    2.8  53.8    1.0   4.2481   4.1 ------	UNKNOWN
  8.9490 -18.1822    3.6  41.0  -83.4   5.9665   3.2 ------	UNKNOWN
Plot creation:
Sun May 31 10:23:14 EDT 2015