Click here for the BAT GCN circular template
Image
Pre-slew 15.0-350.0 keV image (Event data)
#   RAcent    DECcent   POSerr    Theta     Phi              Peak Cts       SNR   Name
  312.8135   -78.3819   0.0020    28.2572  -126.9372        20.2641644     98.222 TRIG_00278854

Foreground time interval of the image:
-15.620  12.725 (delta_t =  28.345 [sec])
Background time interval of the image:
-239.776 -15.620 (delta_t = 224.156 [sec])
Lightcurves
Notes:
- 1) The mask-weighted light curves are using the flight position.
- 2) Multiple plots of different time binning/intervals are shown to cover all scenarios of short/long GRBs, rate/image triggers, and real/false positives.
- 3) For all the mask-weighted lightcurves, the y-axis units are counts/sec/det where a det is 0.4 x 0.4 = 0.16 sq cm.
- 4) The verticle lines correspond to following: green dotted lines are T50 interval, black dotted lines are T90 interval, blue solid line(s) is a spacecraft slew start time, and orange solid line(s) is a spacecraft slew end time.
- 5) Time of each bin is in the middle of the bin.
1 s binning
From T0-310 s to T0+310 s

From T100_start - 20 s to T100_end + 30 s

Full time interval

64 ms binning
Full time interval

From T100_start to T100_end

From T0-5 sec to T0+5 sec
16 ms binning
From T100_start-5 s to T100_start+5 s

Blue+Cyan dotted lines: Time interval of the scaled map
From 0.000000 to 1.024000
8 ms binning
From T100_start-3 s to T100_start+3 s

Blue+Cyan dotted lines: Time interval of the scaled map
From 0.000000 to 1.024000
2 ms binning
From T100_start-1 s to T100_start+1 s
Blue+Cyan dotted lines: Time interval of the scaled map
From 0.000000 to 1.024000
SN=5 or 10 sec. binning (whichever binning is satisfied first)
SN=5 or 10 sec. binning (T < 200 sec)

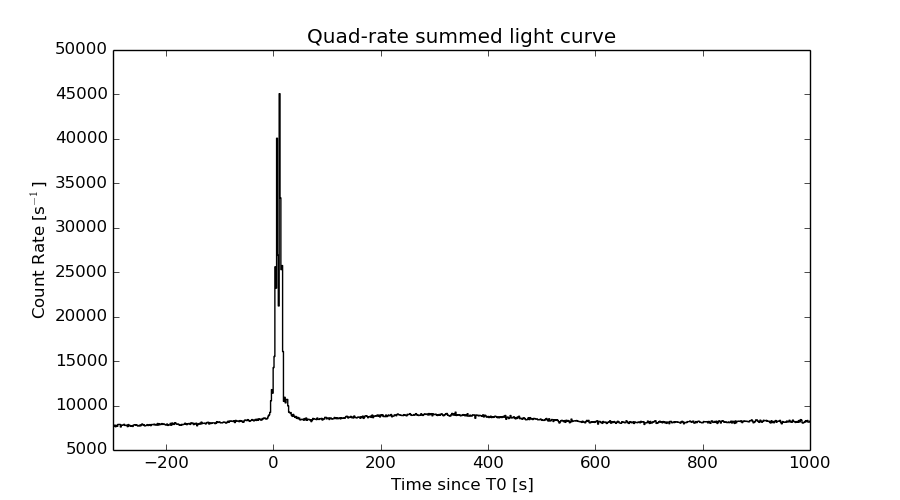
Quad-rate summed light curves (from T0-300s to T0+1000s)
Spectral Evolution

Spectra
Notes:
- 1) The fitting includes the systematic errors.
- 2) When the burst includes telescope slew time periods, the fitting uses an average response file made from multiple 5-s response files through out the slew time plus single time preiod for the non-slew times, and weighted by the total counts in the corresponding time period using addrmf. An average response file is needed becuase a spectral fit using the pre-slew DRM will introduce some errors in both a spectral shape and a normalization if the PHA file contains a lot of the slew/post-slew time interval.
- 3) For fits to more complicated models (e.g. a power-law over a cutoff power-law), the BAT team has decided to require a chi-square improvement of more than 6 for each extra dof.
Time averaged spectrum fit using the average DRM
Power-law model

Time interval is from  -15.620 sec. to   33.116 sec.

Spectral model in power-law:
------------------------------------------------------------
Parameters  : value       lower 90%   higher 90%
Photon index: 1.33558     ( -0.0236716   0.0235742 )
Norm@50keV  : 4.19919E-02    ( -0.000571091   0.000569807 )
------------------------------------------------------------
#Fit statistic : Chi-Squared =          34.05 using 59 PHA bins.
# Reduced chi-squared =         0.5974 for     57 degrees of freedom
# Null hypothesis probability =   9.932111e-01

Photon flux (15-150 keV)    in 48.74 sec: 5.04404 ( -0.0811821  0.081485 ) ph/cm2/s
Energy fluence (15-150 keV)             : 2.00551e-05 ( -2.47738e-07  2.47733e-07 ) ergs/cm2
Cutoff power-law model

Time interval is from  -15.620 sec. to   33.116 sec.
Spectral model in the cutoff power-law:
------------------------------------------------------------
Parameters  : value       lower 90%   higher 90%
Photon index: 1.22021     ( -0.0975765   0.0956264 )
Epeak [keV] : 443.808      ( -170.876 1550.07 )
Norm@50keV  : 4.64592E-02    ( -0.00366776   0.00404599 )
------------------------------------------------------------
#Fit statistic : Chi-Squared =          29.84 using 59 PHA bins.
# Reduced chi-squared =         0.5329 for     56 degrees of freedom
# Null hypothesis probability =   9.984080e-01

Photon flux (15-150 keV)    in 48.74 sec: 4.98770 ( -0.09196  0.09262 ) ph/cm2/s
Energy fluence (15-150 keV)             : 1.99935e-05 ( -2.54764e-07  2.54618e-07 ) ergs/cm2
Band function

Time interval is from  -15.620 sec. to   33.116 sec.

Spectral model in the Band function:
------------------------------------------------------------
Parameters  : value       lower 90%   higher 90%
alpha       : -1.22020   ( -0.58158   4.63812 )
beta        : -10.00000    ( 10   2.57394e-12 )
Epeak [keV] : 443.729      ( -75.5029 1544.27 )
Norm@50keV   : 4.64534E-02    ( -0.00057371   0.00404244 )
------------------------------------------------------------
#Fit statistic : Chi-Squared =          29.84 using 59 PHA bins.
# Reduced chi-squared =         0.5425 for     55 degrees of freedom
# Null hypothesis probability =   9.977737e-01

Photon flux (15-150 keV)    in 48.74 sec:  (    ) ph/cm2/s
Energy fluence (15-150 keV)             : 0 ( 0  0 ) ergs/cm2
Single BB
Spectral model blackbody:
------------------------------------------------------------
Parameters  : value    Lower 90%  Upper 90%
kT [keV]    : 22.5158  (  )
R^2/D10^2   : 0.145138  (   )
(R is the radius in km and D10 is the distance to the source in units of 10 kpc)
------------------------------------------------------------
#Fit statistic : Chi-Squared =        1239.63 using 59 PHA bins.
# Reduced chi-squared =        21.7478 for     57 degrees of freedom
# Null hypothesis probability =  7.356819e-222

Energy  Fluence     90% Error
[keV]   [erg/cm2]   [erg/cm2]
15- 25  6.566e-07   1.950e-08
25- 50  3.519e-06   7.238e-08
50-150  1.333e-05   2.071e-07
15-150  1.751e-05   2.145e-07
Thermal bremsstrahlung (OTTB)
Spectral model: thermal bremsstrahlung
------------------------------------------------------------
Parameters  : value         Lower 90%    Upper 90%
kT [keV]    : 199.363       (      )
Norm        : 22.3393       (     )
------------------------------------------------------------
#Fit statistic : Chi-Squared =         477.82 using 59 PHA bins.
# Reduced chi-squared =         8.3827 for     57 degrees of freedom
# Null hypothesis probability =   8.690097e-68

Energy  Fluence     90% Error
[keV]   [erg/cm2]   [erg/cm2]
15- 25  2.711e-06   4.289e-08
25- 50  5.216e-06   8.286e-08
50-150  1.144e-05   1.803e-07
15-150  1.937e-05   2.924e-07
Double BB

Spectral model: bbodyrad<1> + bbodyrad<2>
------------------------------------------------------------
Parameters  : value         Lower 90%    Upper 90%
kT1 [keV]   : 8.37929        (-0.430136      0.449873)
R1^2/D10^2  : 2.47301        (-0.410245      0.509832)
kT2 [keV]   : 33.3905        (-1.33391      1.51741)
R2^2/D10^2  : 3.27261E-02    (-0.00467476   0.00504884)
------------------------------------------------------------
#Fit statistic : Chi-Squared =          29.94 using 59 PHA bins.
# Reduced chi-squared =         0.5444 for     55 degrees of freedom
# Null hypothesis probability =   9.976699e-01

Energy  Fluence     90% Error
[keV]   [erg/cm2]   [erg/cm2]
15- 25  1.840e-06   1.004e-07
25- 50  4.664e-06   1.209e-07
50-150  1.344e-05   2.486e-07
15-150  1.994e-05   3.461e-07
Peak spectrum fit
Power-law model
Time interval is from   10.848 sec. to   11.848 sec.

Spectral model in power-law:
------------------------------------------------------------
Parameters  : value       lower 90%   higher 90%
Photon index: 1.05891     ( -0.0366613   0.0365548 )
Norm@50keV  : 0.213810    ( -0.00449256   0.00448763 )
------------------------------------------------------------
#Fit statistic : Chi-Squared =          77.78 using 59 PHA bins.
# Reduced chi-squared =          1.365 for     57 degrees of freedom
# Null hypothesis probability =   3.506968e-02

Photon flux (15-150 keV)    in 1 sec: 24.7110 ( -0.539671  0.540201 ) ph/cm2/s
Energy fluence (15-150 keV)             : 2.26564e-06 ( -4.91221e-08  4.91351e-08 ) ergs/cm2
Cutoff power-law model

Time interval is from   10.848 sec. to   11.848 sec.
Spectral model in the cutoff power-law:
------------------------------------------------------------
Parameters  : value       lower 90%   higher 90%
Photon index: 0.678585     ( -0.157576   0.152615 )
Epeak [keV] : 213.491      ( -44.3981 97.7883 )
Norm@50keV  : 0.307298    ( -0.0406572   0.0482328 )
------------------------------------------------------------
#Fit statistic : Chi-Squared =          58.94 using 59 PHA bins.
# Reduced chi-squared =          1.053 for     56 degrees of freedom
# Null hypothesis probability =   3.684315e-01

Photon flux (15-150 keV)    in 1 sec: 24.2474 ( -0.5641  0.566 ) ph/cm2/s
Energy fluence (15-150 keV)             : 2.24265e-06 ( 0  0 ) ergs/cm2
Band function

Time interval is from   10.848 sec. to   11.848 sec.

Spectral model in the Band function:
------------------------------------------------------------
Parameters  : value       lower 90%   higher 90%
alpha       : -0.684847   ( -0.131698   0.0704287 )
beta        : -9.34756    ( 9.37092   19.3709 )
Epeak [keV] : 216.250      ( -20.9001 36.0721 )
Norm@50keV   : 0.305396    ( -0.0290402   0.0311485 )
------------------------------------------------------------
#Fit statistic : Chi-Squared =          58.95 using 59 PHA bins.
# Reduced chi-squared =          1.072 for     55 degrees of freedom
# Null hypothesis probability =   3.332446e-01

Photon flux (15-150 keV)    in 1 sec:  (    ) ph/cm2/s
Energy fluence (15-150 keV)             : 0 ( 0  0 ) ergs/cm2
Single BB
Spectral model blackbody:
------------------------------------------------------------
Parameters  : value    Lower 90%  Upper 90%
kT [keV]    : 22.8021  (  )
R^2/D10^2   : 0.787060  (   )
(R is the radius in km and D10 is the distance to the source in units of 10 kpc)
------------------------------------------------------------
#Fit statistic : Chi-Squared =         373.86 using 59 PHA bins.
# Reduced chi-squared =         6.5589 for     57 degrees of freedom
# Null hypothesis probability =   3.973611e-48

Energy  Fluence     90% Error
[keV]   [erg/cm2]   [erg/cm2]
15- 25  7.447e-08   3.025e-09
25- 50  4.021e-07   1.220e-08
50-150  1.562e-06   4.950e-08
15-150  2.039e-06   4.750e-08
Thermal bremsstrahlung (OTTB)
Spectral model: thermal bremsstrahlung
------------------------------------------------------------
Parameters  : value         Lower 90%    Upper 90%
kT [keV]    : 199.363       (      )
Norm        : 104.277       (     )
------------------------------------------------------------
#Fit statistic : Chi-Squared =         594.00 using 59 PHA bins.
# Reduced chi-squared =         10.421 for     57 degrees of freedom
# Null hypothesis probability =   1.985264e-90

Energy  Fluence     90% Error
[keV]   [erg/cm2]   [erg/cm2]
15- 25  2.597e-07   5.400e-09
25- 50  4.995e-07   1.085e-08
50-150  1.095e-06   2.400e-08
15-150  1.855e-06   4.650e-08
Double BB
Spectral model: bbodyrad<1> + bbodyrad<2>
------------------------------------------------------------
Parameters  : value         Lower 90%    Upper 90%
kT1 [keV]   : 8.56422        (-0.8422      0.925678)
R1^2/D10^2  : 8.58742        (-2.26798      3.32727)
kT2 [keV]   : 33.1977        (-2.20189      2.78696)
R2^2/D10^2  : 0.205015    (-0.048598   0.0538539)
------------------------------------------------------------
#Fit statistic : Chi-Squared =          54.18 using 59 PHA bins.
# Reduced chi-squared =         0.9850 for     55 degrees of freedom
# Null hypothesis probability =   5.060573e-01

Energy  Fluence     90% Error
[keV]   [erg/cm2]   [erg/cm2]
15- 25  1.524e-07   1.390e-08
25- 50  4.468e-07   2.115e-08
50-150  1.657e-06   7.500e-08
15-150  2.256e-06   9.600e-08
Pre-slew spectrum (Pre-slew PHA with pre-slew DRM)
Power-law model

Spectral model in power-law:
------------------------------------------------------------
Parameters  : value       lower 90%   higher 90%
Photon index: 1.26697     ( -0.0249728   0.0248889 )
Norm@50keV  : 4.99485E-02    ( -0.000711228   0.000709875 )
------------------------------------------------------------
#Fit statistic : Chi-Squared =          36.75 using 59 PHA bins.
# Reduced chi-squared =         0.6448 for     57 degrees of freedom
# Null hypothesis probability =   9.829327e-01

Photon flux (15-150 keV)    in 28.34 sec: 5.92424 ( -0.0967953  0.0971047 ) ph/cm2/s
Energy fluence (15-150 keV)             : 1.41043e-05 ( -1.84716e-07  1.84731e-07 ) ergs/cm2
Cutoff power-law model

Spectral model in the cutoff power-law:
------------------------------------------------------------
Parameters  : value       lower 90%   higher 90%
Photon index: 1.13691     ( -0.102847   0.100642 )
Epeak [keV] : 432.240      ( -159.764 1965.7 )
Norm@50keV  : 5.60421E-02    ( -0.00465515   0.00520403 )
------------------------------------------------------------
#Fit statistic : Chi-Squared =          31.91 using 59 PHA bins.
# Reduced chi-squared =         0.5697 for     56 degrees of freedom
# Null hypothesis probability =   9.960507e-01

Photon flux (15-150 keV)    in 28.34 sec: 5.85674 ( -0.10813  0.10881 ) ph/cm2/s
Energy fluence (15-150 keV)             : 1.40577e-05 ( -1.89566e-07  1.89453e-07 ) ergs/cm2
Band function
Spectral model in the Band function:
------------------------------------------------------------
Parameters  : value       lower 90%   higher 90%
alpha       : -1.13690   ( -0.658462   0.625005 )
beta        : -9.99547    ( 9.99011   19.9901 )
Epeak [keV] : 432.164      ( -136.693 500.39 )
Norm@50keV   : 5.60364E-02    ( -0.000735705   0.00521411 )
------------------------------------------------------------
#Fit statistic : Chi-Squared =          31.91 using 59 PHA bins.
# Reduced chi-squared =         0.5801 for     55 degrees of freedom
# Null hypothesis probability =   9.946481e-01

Photon flux (15-150 keV)    in 28.34 sec:  (    ) ph/cm2/s
Energy fluence (15-150 keV)             : 0 ( 0  0 ) ergs/cm2
S(25-50 keV) vs. S(50-100 keV) plot

S(25-50 keV)  = 4.55e-06
S(50-100 keV) = 7.22e-06
T90 vs. Hardness ratio plot

T90                                   = 20.9000000059605 sec.
Hardness ratio (energy fluence ratio) = 1.58681
Color vs. Color plot
Count Ratio  (25-50 keV) / (15-25 keV) = 1.53287
Count Ratio (50-100 keV) / (15-25 keV) = 1.35415
Mask shadow pattern

IMX = -3.229942853789712E-01, IMY = 4.296065986230516E-01
TIME vs. PHA plot around the trigger time

Blue+Cyan dotted lines: Time interval of the scaled map
From 0.000000 to 1.024000
TIME vs. DetID plot around the trigger time

Blue+Cyan dotted lines: Time interval of the scaled map
From 0.000000 to 1.024000
100 us light curve (15-350 keV)
Blue+Cyan dotted lines: Time interval of the scaled map
From 0.000000 to 1.024000
Spacecraft aspect plot

Bright source in the pre-burst/pre-slew/post-slew images
Pre-burst image of 15-350 keV band
Time interval of the image:
-239.776000 -15.620000

# RAcent  DECcent POSerr Theta    Phi  PeakCts   SNR AngSep     Name
#  [deg]    [deg]    ['] [deg]  [deg]                   [']
135.5723 -40.6710   12.7  52.5  -29.2   0.6469   0.9    7.3	Vela X-1
170.5922 -60.5774    9.3  23.3  -26.5   0.2140   1.2    8.6	Cen X-3
186.3294 -62.8007    3.3  15.6  -22.5   0.5970   3.5    9.2	GX 301-2
255.9836 -37.8398    0.6  33.3  132.3   5.8716  19.9    0.3	4U 1700-377
256.6186 -36.4836   10.3  34.7  132.1   0.3620   1.1    9.6	GX 349+2
264.6840 -44.5161    6.1  30.9  149.4   0.4583   1.9    4.7	4U 1735-44
270.0995 -25.7182    4.3  49.4  140.7   2.2709   2.7   11.1	GRS 1758-258
275.9492 -30.3801    3.8  47.6  149.7   1.9779   3.1    1.5	H1820-303
263.0936 -33.7801    3.1  39.5  137.9   1.6295   3.7    6.2	GX 354-0
100.8568 -72.1306    4.3  37.9  -76.4   1.2753   2.7 ------	UNKNOWN
Pre-slew background subtracted image of 15-350 keV band
Time interval of the image:
-15.620000 12.724600

# RAcent  DECcent POSerr Theta    Phi  PeakCts   SNR AngSep     Name
#  [deg]    [deg]    ['] [deg]  [deg]                   [']
135.5914 -40.6457    6.9  52.5  -29.1  -1.0249  -1.7    6.2	Vela X-1
170.0785 -60.5235    9.7  23.5  -26.7   0.2166   1.2    9.2	Cen X-3
186.8264 -62.8329   19.0  15.4  -22.3  -0.1002  -0.6    6.0	GX 301-2
255.8773 -38.0027    0.0  33.1  132.3  -0.0912  -0.3   10.8	4U 1700-377
256.3619 -36.3702    7.9  34.7  131.7  -0.4337  -1.5    4.8	GX 349+2
264.5414 -44.4878    7.5  30.9  149.2   0.3119   1.5    8.9	4U 1735-44
270.2711 -25.6254    7.0  49.6  140.8  -1.1831  -1.6    7.3	GRS 1758-258
275.7591 -30.2970   15.3  47.6  149.4   0.3745   0.8    9.6	H1820-303
262.8141 -33.7397   18.1  39.4  137.6  -0.2155  -0.6   10.4	GX 354-0
177.3180 -34.1619    2.3  40.3   14.7   1.2938   5.1 ------	UNKNOWN
312.8135 -78.3818    0.1  28.3 -126.9  20.2619  98.1 ------	UNKNOWN
 25.2160 -84.9394    2.3  30.6 -104.6   1.3437   5.1 ------	UNKNOWN
351.3965 -64.4088    2.2  46.1 -129.2   3.9482   5.4 ------	UNKNOWN
Post-slew image of 15-350 keV band
Time interval of the image:
64.924600 962.284200

# RAcent  DECcent POSerr Theta    Phi  PeakCts   SNR AngSep     Name
#  [deg]    [deg]    ['] [deg]  [deg]                   [']
170.5075 -60.5390    4.6  39.3   30.0   2.0439   2.5    7.6	Cen X-3
186.5919 -62.7351    3.6  35.3   41.4   2.3722   3.2    2.8	GX 301-2
264.6533 -44.4970   16.1  38.5  123.1   0.8682   0.7    4.8	4U 1735-44
223.7676 -74.4239    2.9  19.2   56.4   1.8542   4.0 ------	UNKNOWN
312.7271 -78.3658    2.4   0.0  115.0   2.1635   4.8 ------	UNKNOWN
 39.5171 -71.9148    4.1  20.8  -59.0   1.3135   2.8 ------	UNKNOWN
 67.6217 -48.7465    5.1  47.1  -53.1   6.6921   2.3 ------	UNKNOWN
Plot creation:
Sun May 31 10:18:52 EDT 2015