Special notes of this burst
Image
Pre-slew 15.0-350.0 keV image (Event data)
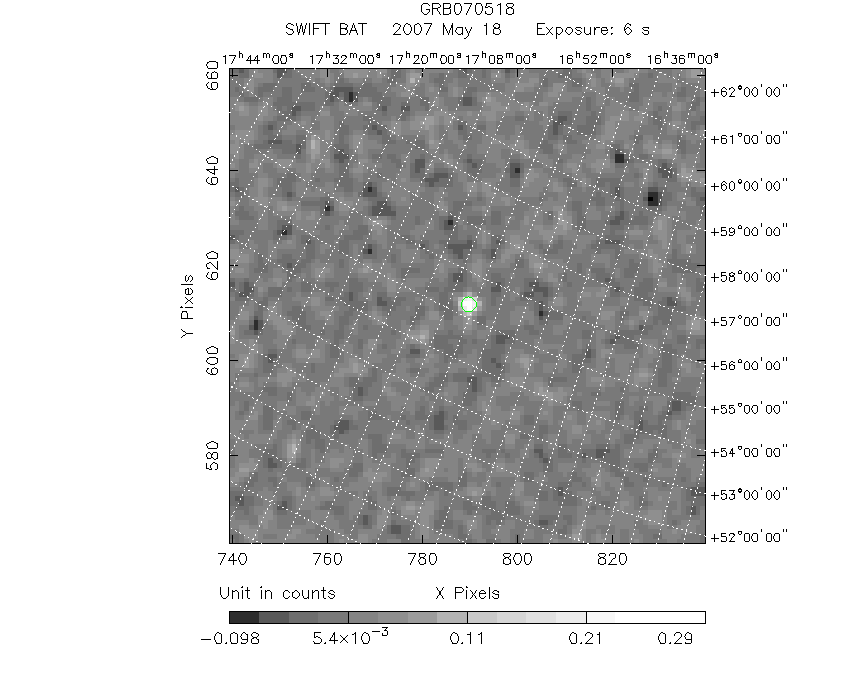
#   RAcent    DECcent   POSerr    Theta     Phi              Peak Cts       SNR   Name
  254.2184    55.2942   0.0141    18.8324   -56.3924         0.3239575     13.579 TRIG_00279592

Foreground time interval of the image:
 -1.784   4.504 (delta_t =   6.288 [sec])
Background time interval of the image:
-239.168  -1.784 (delta_t = 237.384 [sec])
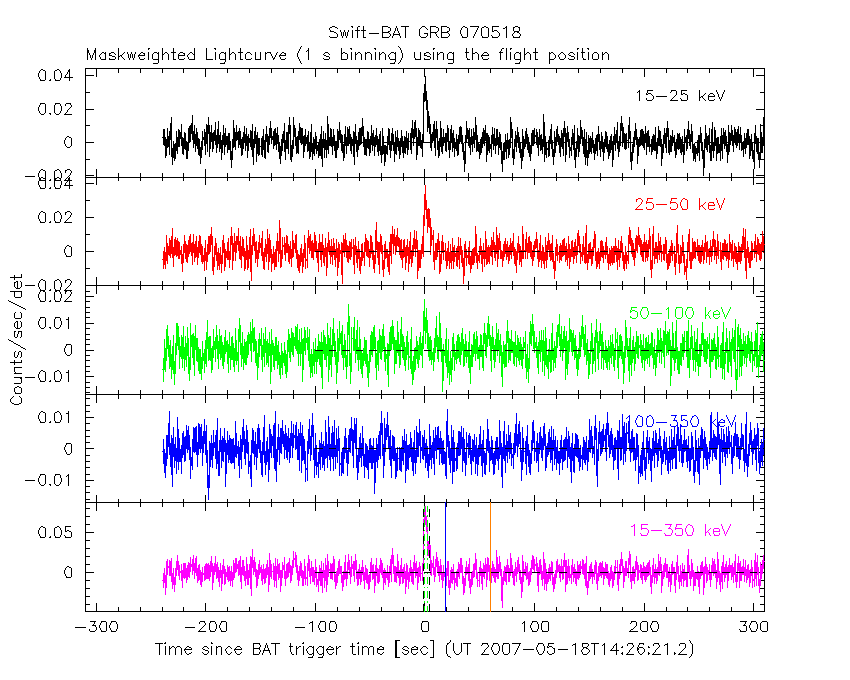
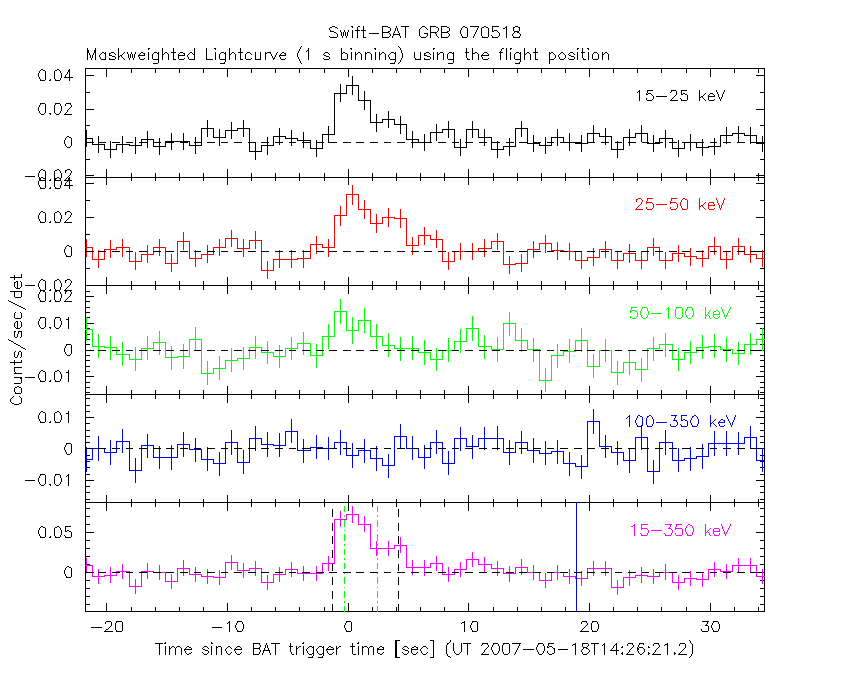
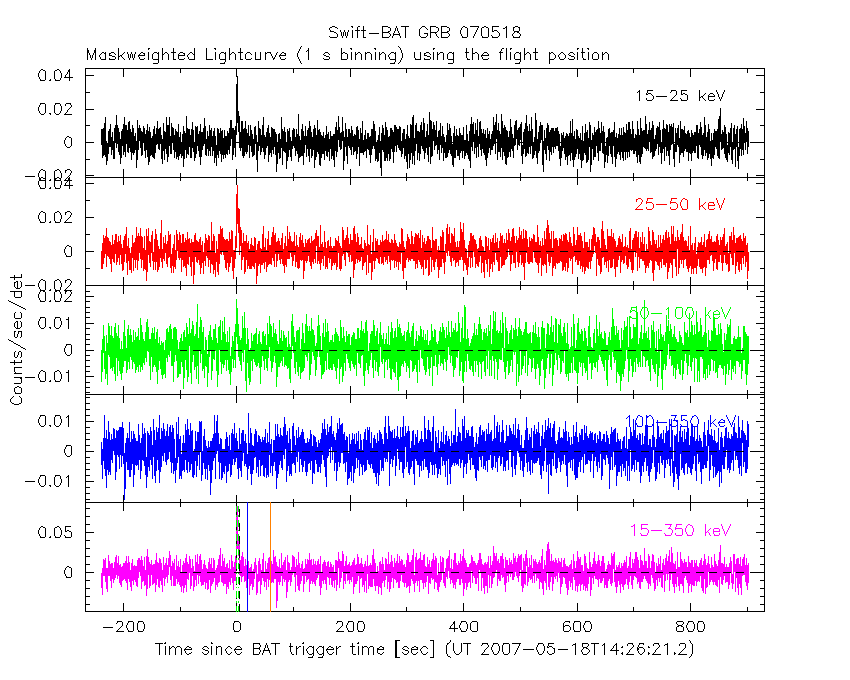
Lightcurves
Notes:
- 1) The mask-weighted light curves are using the flight position.
- 2) Multiple plots of different time binning/intervals are shown to cover all scenarios of short/long GRBs, rate/image triggers, and real/false positives.
- 3) For all the mask-weighted lightcurves, the y-axis units are counts/sec/det where a det is 0.4 x 0.4 = 0.16 sq cm.
- 4) The verticle lines correspond to following: green dotted lines are T50 interval, black dotted lines are T90 interval, blue solid line(s) is a spacecraft slew start time, and orange solid line(s) is a spacecraft slew end time.
- 5) Time of each bin is in the middle of the bin.
1 s binning
From T0-310 s to T0+310 s
From T100_start - 20 s to T100_end + 30 s
Full time interval
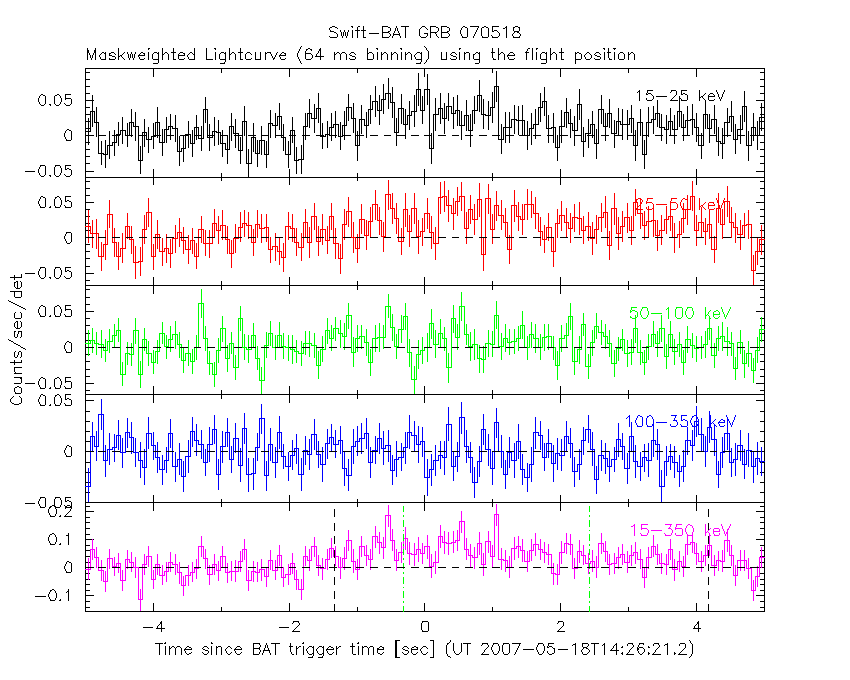
64 ms binning
Full time interval
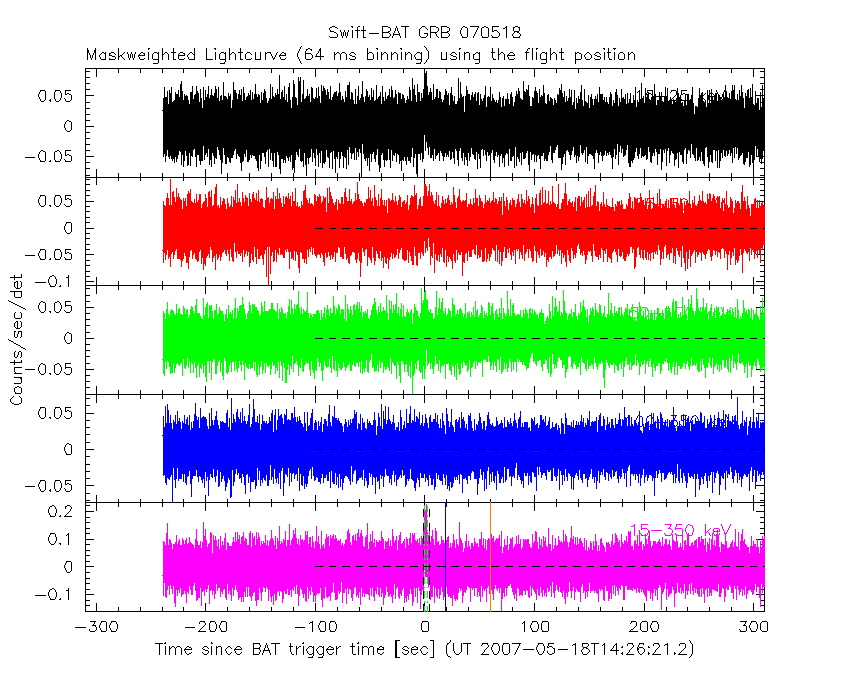
From T100_start to T100_end

From T0-5 sec to T0+5 sec
16 ms binning
From T100_start-5 s to T100_start+5 s
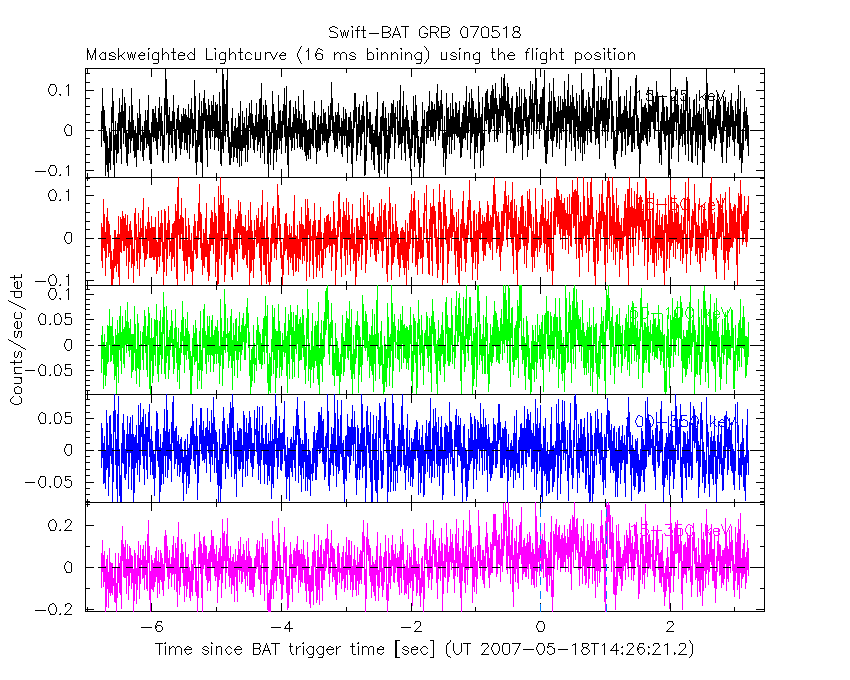
Blue+Cyan dotted lines: Time interval of the scaled map
From 0.000000 to 1.024000
8 ms binning
From T100_start-3 s to T100_start+3 s
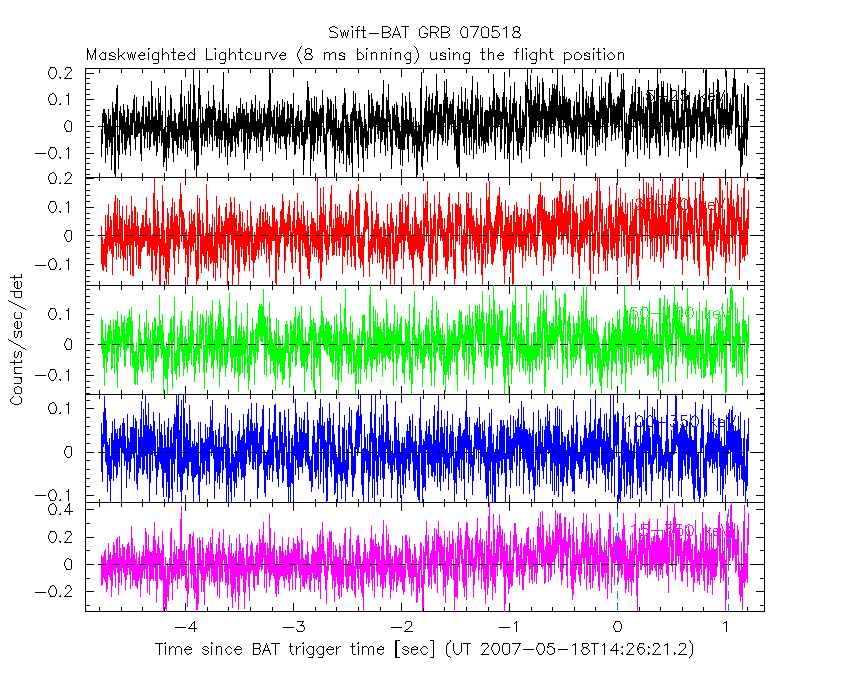
Blue+Cyan dotted lines: Time interval of the scaled map
From 0.000000 to 1.024000
2 ms binning
From T100_start-1 s to T100_start+1 s
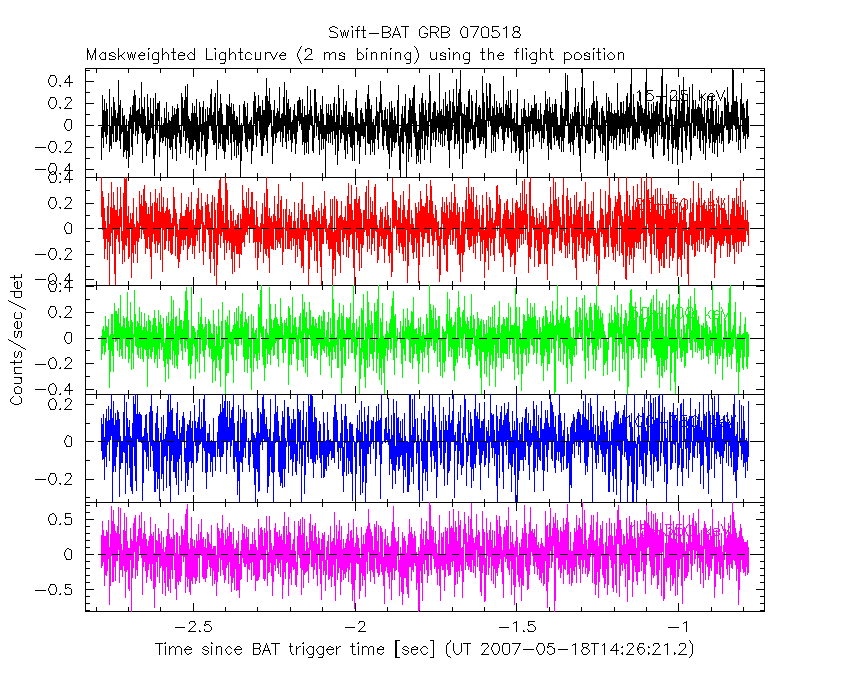
Blue+Cyan dotted lines: Time interval of the scaled map
From 0.000000 to 1.024000
SN=5 or 10 sec. binning (whichever binning is satisfied first)
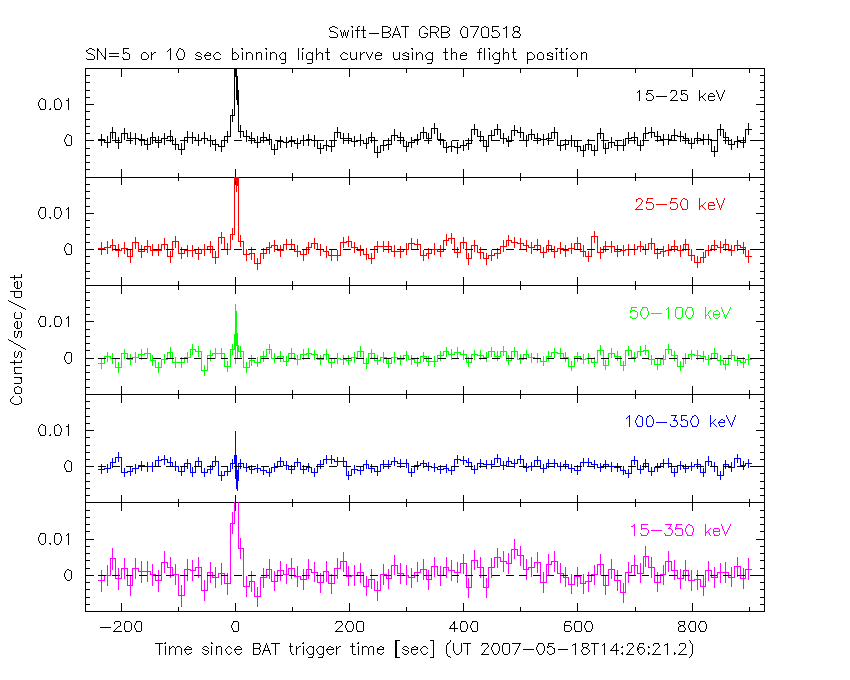
SN=5 or 10 sec. binning (T < 200 sec)

Quad-rate summed light curves (from T0-300s to T0+1000s)

Spectral Evolution
Spectra
Notes:
- 1) The fitting includes the systematic errors.
- 2) When the burst includes telescope slew time periods, the fitting uses an average response file made from multiple 5-s response files through out the slew time plus single time preiod for the non-slew times, and weighted by the total counts in the corresponding time period using addrmf. An average response file is needed becuase a spectral fit using the pre-slew DRM will introduce some errors in both a spectral shape and a normalization if the PHA file contains a lot of the slew/post-slew time interval.
- 3) For fits to more complicated models (e.g. a power-law over a cutoff power-law), the BAT team has decided to require a chi-square improvement of more than 6 for each extra dof.
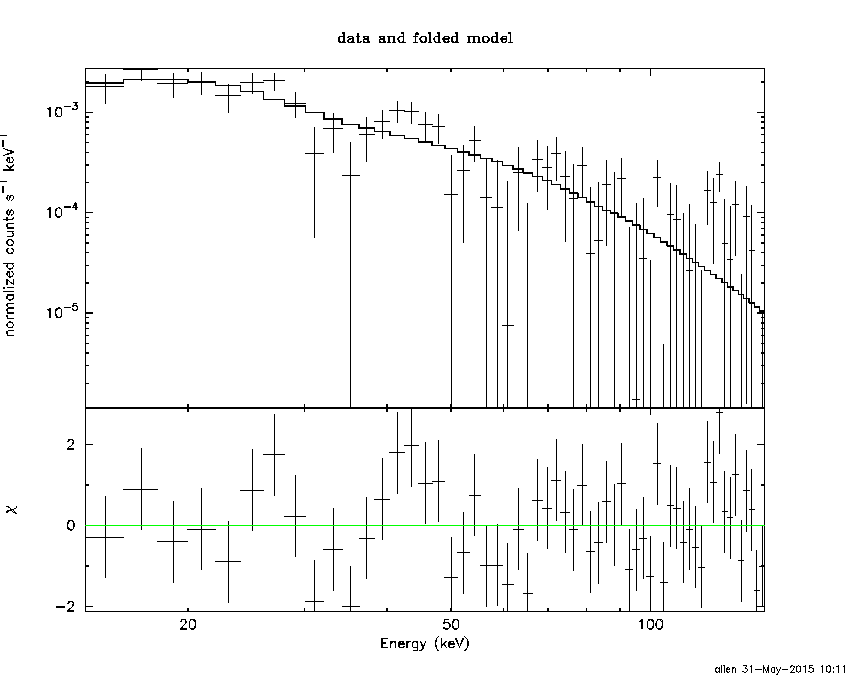
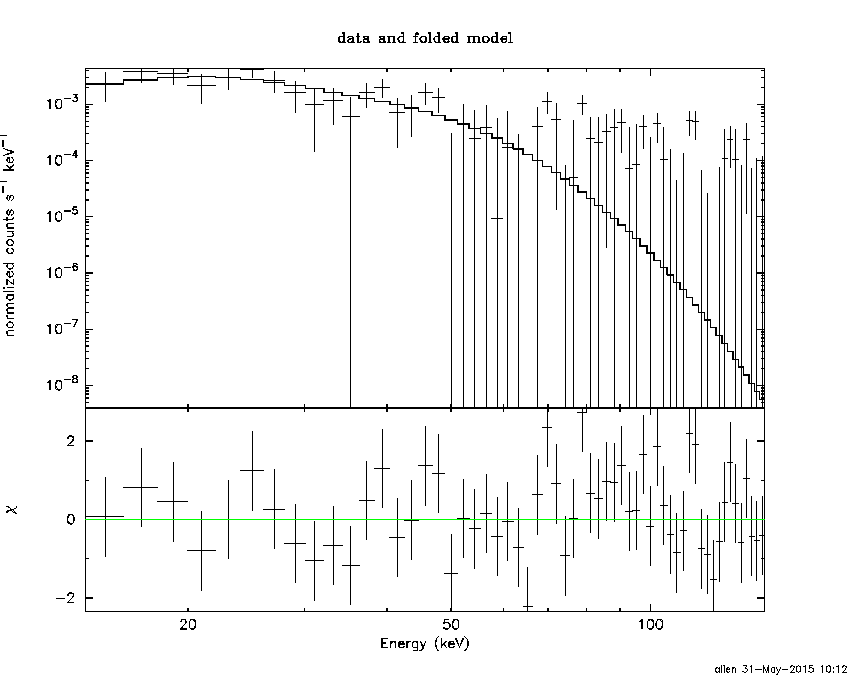
Time averaged spectrum fit using the average DRM
Power-law model
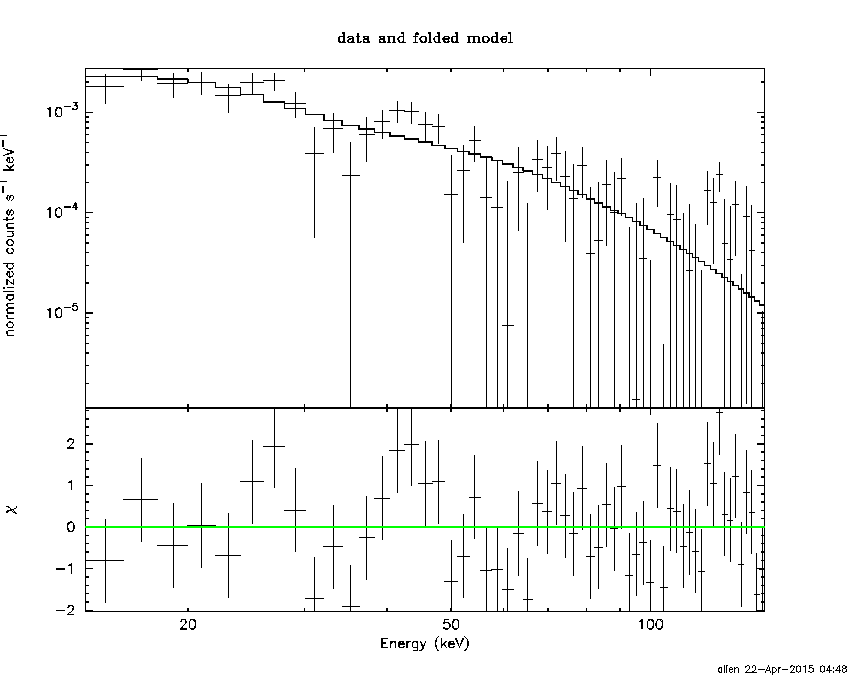
Time interval is from   -1.784 sec. to    4.504 sec.

Spectral model in power-law:
------------------------------------------------------------
Parameters  : value       lower 90%   higher 90%
Photon index: 2.01088     ( -0.220264   0.234422 )
Norm@50keV  : 2.88590E-03    ( -0.000449007   0.000436878 )
------------------------------------------------------------
#Fit statistic : Chi-Squared =          66.44 using 59 PHA bins.
# Reduced chi-squared =          1.166 for     57 degrees of freedom
# Null hypothesis probability =   1.838341e-01

Photon flux (15-150 keV)    in 6.288 sec: 0.435065 ( -0.0499352  0.0499364 ) ph/cm2/s
Energy fluence (15-150 keV)             : 1.67445e-07 ( -2.39201e-08  2.46254e-08 ) ergs/cm2
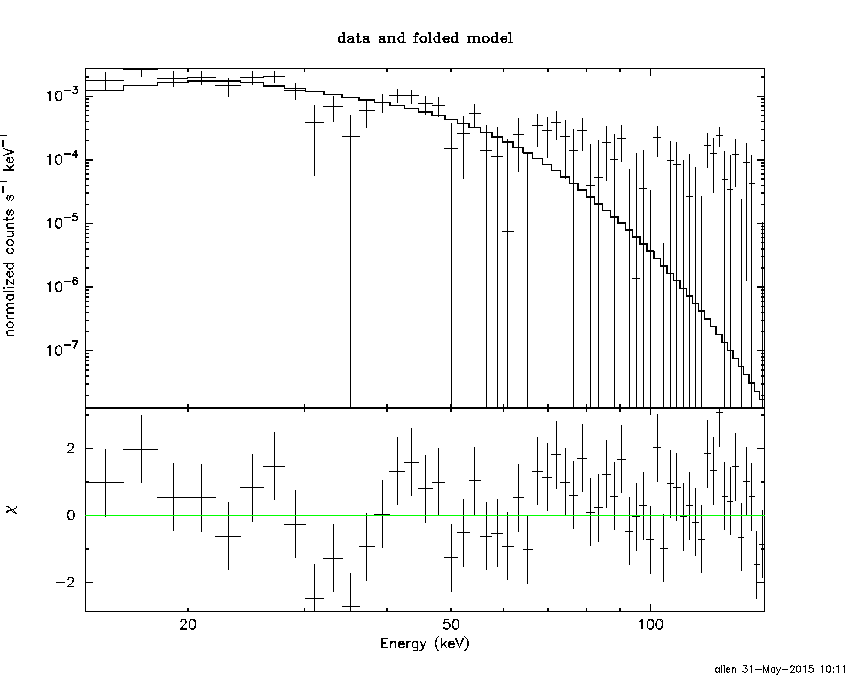
Cutoff power-law model

Time interval is from   -1.784 sec. to    4.504 sec.
Spectral model in the cutoff power-law:
------------------------------------------------------------
Parameters  : value       lower 90%   higher 90%
Photon index: 1.83745     ( -1.08502   0.297222 )
Epeak [keV] : 37.4692      (   )
Norm@50keV  : 3.66387E-03    (     )
------------------------------------------------------------
#Fit statistic : Chi-Squared =          66.32 using 59 PHA bins.
# Reduced chi-squared =          1.184 for     56 degrees of freedom
# Null hypothesis probability =   1.626829e-01

Photon flux (15-150 keV)    in 6.288 sec: 0.432022 ( -0.052245  0.051747 ) ph/cm2/s
Energy fluence (15-150 keV)             : 1.63734e-07 ( -2.98498e-08  2.76471e-08 ) ergs/cm2
Band function
Time interval is from   -1.784 sec. to    4.504 sec.

Spectral model in the Band function:
------------------------------------------------------------
Parameters  : value       lower 90%   higher 90%
alpha       : -0.113151   ( -0.857107   -0.857107 )
beta        : -2.12245    ( -1.50861   0.302247 )
Epeak [keV] : 25.3515      ( -23.6392 177.473 )
Norm@50keV   : 7.40466E-02    ( -0.0720582   826.762 )
------------------------------------------------------------
#Fit statistic : Chi-Squared =          65.85 using 59 PHA bins.
# Reduced chi-squared =          1.197 for     55 degrees of freedom
# Null hypothesis probability =   1.500692e-01

Photon flux (15-150 keV)    in 6.288 sec:  (    ) ph/cm2/s
Energy fluence (15-150 keV)             : 0 ( 0  0 ) ergs/cm2
Single BB
Spectral model blackbody:
------------------------------------------------------------
Parameters  : value    Lower 90%  Upper 90%
kT [keV]    : 9.17404  (-1.19884  1.39252)
R^2/D10^2   : 0.278165  (-0.117539   0.201924)
(R is the radius in km and D10 is the distance to the source in units of 10 kpc)
------------------------------------------------------------
#Fit statistic : Chi-Squared =          81.55 using 59 PHA bins.
# Reduced chi-squared =          1.431 for     57 degrees of freedom
# Null hypothesis probability =   1.812852e-02

Energy  Fluence     90% Error
[keV]   [erg/cm2]   [erg/cm2]
15- 25  2.894e-08   5.744e-09
25- 50  6.336e-08   1.038e-08
50-150  2.562e-08   9.001e-09
15-150  1.179e-07   1.886e-08
Thermal bremsstrahlung (OTTB)
Spectral model: thermal bremsstrahlung
------------------------------------------------------------
Parameters  : value         Lower 90%    Upper 90%
kT [keV]    : 62.3483       (-19.4628      35.2178)
Norm        : 2.23372       (-0.411143     0.513644)
------------------------------------------------------------
#Fit statistic : Chi-Squared =          67.05 using 59 PHA bins.
# Reduced chi-squared =          1.176 for     57 degrees of freedom
# Null hypothesis probability =   1.704412e-01

Energy  Fluence     90% Error
[keV]   [erg/cm2]   [erg/cm2]
15- 25  3.551e-08   5.074e-09
25- 50  5.468e-08   7.920e-09
50-150  6.420e-08   2.233e-08
15-150  1.544e-07   2.584e-08
Double BB

Spectral model: bbodyrad<1> + bbodyrad<2>
------------------------------------------------------------
Parameters  : value         Lower 90%    Upper 90%
kT1 [keV]   : 6.05404        (-2.80462      2.43505)
R1^2/D10^2  : 1.06179        (-0.668362      9.89755)
kT2 [keV]   : 22.2227        (-11.1961      -22.8253)
R2^2/D10^2  : 6.21664E-03    (-0.00545125   0.0775377)
------------------------------------------------------------
#Fit statistic : Chi-Squared =          67.87 using 59 PHA bins.
# Reduced chi-squared =          1.234 for     55 degrees of freedom
# Null hypothesis probability =   1.140778e-01

Energy  Fluence     90% Error
[keV]   [erg/cm2]   [erg/cm2]
15- 25  3.649e-08   1.832e-08
25- 50  5.240e-08   2.571e-08
50-150  7.299e-08   4.259e-08
15-150  1.619e-07   7.900e-08
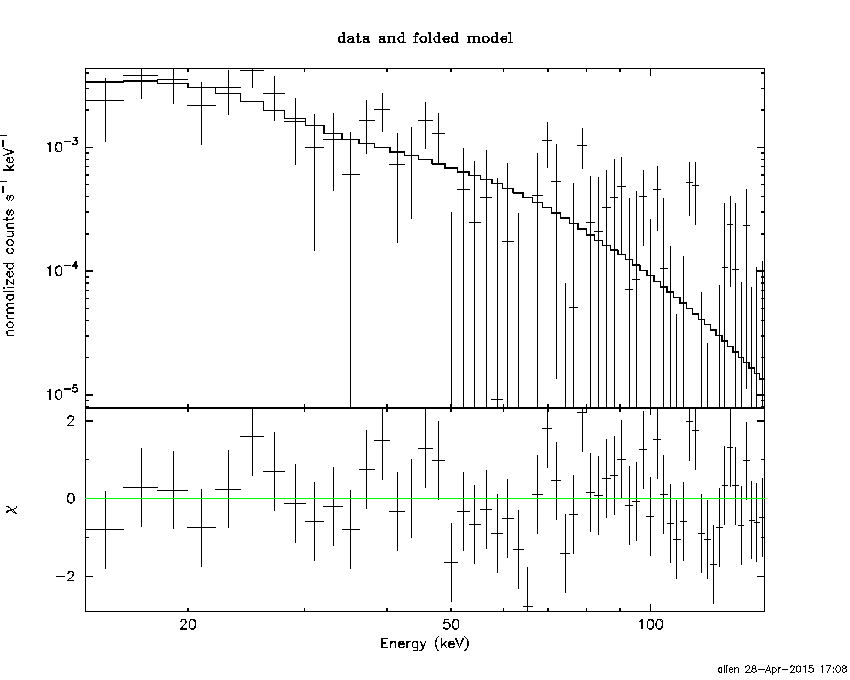
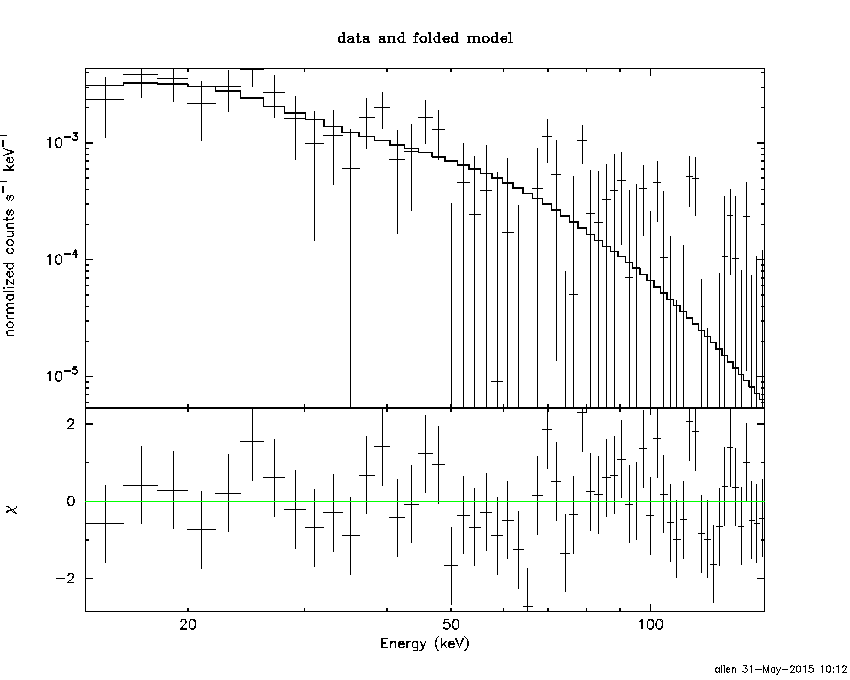
Peak spectrum fit
Power-law model

Time interval is from    0.124 sec. to    1.124 sec.

Spectral model in power-law:
------------------------------------------------------------
Parameters  : value       lower 90%   higher 90%
Photon index: 2.01107     ( -0.344691   0.383347 )
Norm@50keV  : 4.42239E-03    ( -0.00115084   0.00110643 )
------------------------------------------------------------
#Fit statistic : Chi-Squared =          59.73 using 59 PHA bins.
# Reduced chi-squared =          1.048 for     57 degrees of freedom
# Null hypothesis probability =   3.767720e-01

Photon flux (15-150 keV)    in 1 sec: 0.666759 ( -0.124298  0.124312 ) ph/cm2/s
Energy fluence (15-150 keV)             : 4.08076e-08 ( -9.5768e-09  1.00723e-08 ) ergs/cm2
Cutoff power-law model
Time interval is from    0.124 sec. to    1.124 sec.
Spectral model in the cutoff power-law:
------------------------------------------------------------
Parameters  : value       lower 90%   higher 90%
Photon index: 1.80780     ( -2.44749   0.315987 )
Epeak [keV] : 36.3499      (   )
Norm@50keV  : 5.90217E-03    (     )
------------------------------------------------------------
#Fit statistic : Chi-Squared =          59.66 using 59 PHA bins.
# Reduced chi-squared =          1.065 for     56 degrees of freedom
# Null hypothesis probability =   3.441603e-01

Photon flux (15-150 keV)    in 1 sec: 0.662284 ( -0.125045  0.126904 ) ph/cm2/s
Energy fluence (15-150 keV)             : 3.96615e-08 ( -1.23414e-08  1.10316e-08 ) ergs/cm2
Band function

Time interval is from    0.124 sec. to    1.124 sec.

Spectral model in the Band function:
------------------------------------------------------------
Parameters  : value       lower 90%   higher 90%
alpha       : 1.25717   ( -4.69845   -1.31267 )
beta        : -2.27343    ( 2.27532   0.532664 )
Epeak [keV] : 25.8514      ( -25.6969 62.1633 )
Norm@50keV   : 1.14914    ( -1.63485   465.769 )
------------------------------------------------------------
#Fit statistic : Chi-Squared =          58.62 using 59 PHA bins.
# Reduced chi-squared =          1.066 for     55 degrees of freedom
# Null hypothesis probability =   3.442675e-01

Photon flux (15-150 keV)    in 1 sec:  (    ) ph/cm2/s
Energy fluence (15-150 keV)             : 0 ( 0  0 ) ergs/cm2
Single BB
Spectral model blackbody:
------------------------------------------------------------
Parameters  : value    Lower 90%  Upper 90%
kT [keV]    : 8.15087  (-1.49245  1.90893)
R^2/D10^2   : 0.688045  (-0.388737   0.839038)
(R is the radius in km and D10 is the distance to the source in units of 10 kpc)
------------------------------------------------------------
#Fit statistic : Chi-Squared =          63.49 using 59 PHA bins.
# Reduced chi-squared =          1.114 for     57 degrees of freedom
# Null hypothesis probability =   2.583385e-01

Energy  Fluence     90% Error
[keV]   [erg/cm2]   [erg/cm2]
15- 25  8.378e-09   3.115e-09
25- 50  1.514e-08   5.174e-09
50-150  4.227e-09   2.526e-09
15-150  2.775e-08   8.285e-09
Thermal bremsstrahlung (OTTB)
Spectral model: thermal bremsstrahlung
------------------------------------------------------------
Parameters  : value         Lower 90%    Upper 90%
kT [keV]    : 59.0549       (-26.3492      71.1634)
Norm        : 3.52604       (-0.98632     1.50195)
------------------------------------------------------------
#Fit statistic : Chi-Squared =          59.91 using 59 PHA bins.
# Reduced chi-squared =          1.051 for     57 degrees of freedom
# Null hypothesis probability =   3.706741e-01

Energy  Fluence     90% Error
[keV]   [erg/cm2]   [erg/cm2]
15- 25  8.839e-09   2.205e-09
25- 50  1.339e-08   3.738e-09
50-150  1.503e-08   9.053e-09
15-150  3.726e-08   1.294e-08
Double BB

Spectral model: bbodyrad<1> + bbodyrad<2>
------------------------------------------------------------
Parameters  : value         Lower 90%    Upper 90%
kT1 [keV]   : 6.76562        (-1.77835      1.87747)
R1^2/D10^2  : 1.24328        (-0.749713      2.55169)
kT2 [keV]   : 36.0791        (-20.4202      -36.4565)
R2^2/D10^2  : 1.83288E-03    (-0.00176588   0.0274295)
------------------------------------------------------------
#Fit statistic : Chi-Squared =          57.21 using 59 PHA bins.
# Reduced chi-squared =          1.040 for     55 degrees of freedom
# Null hypothesis probability =   3.931619e-01

Energy  Fluence     90% Error
[keV]   [erg/cm2]   [erg/cm2]
15- 25  9.144e-09   4.736e-09
25- 50  1.347e-08   7.825e-09
50-150  1.993e-08   1.244e-08
15-150  4.255e-08   2.008e-08
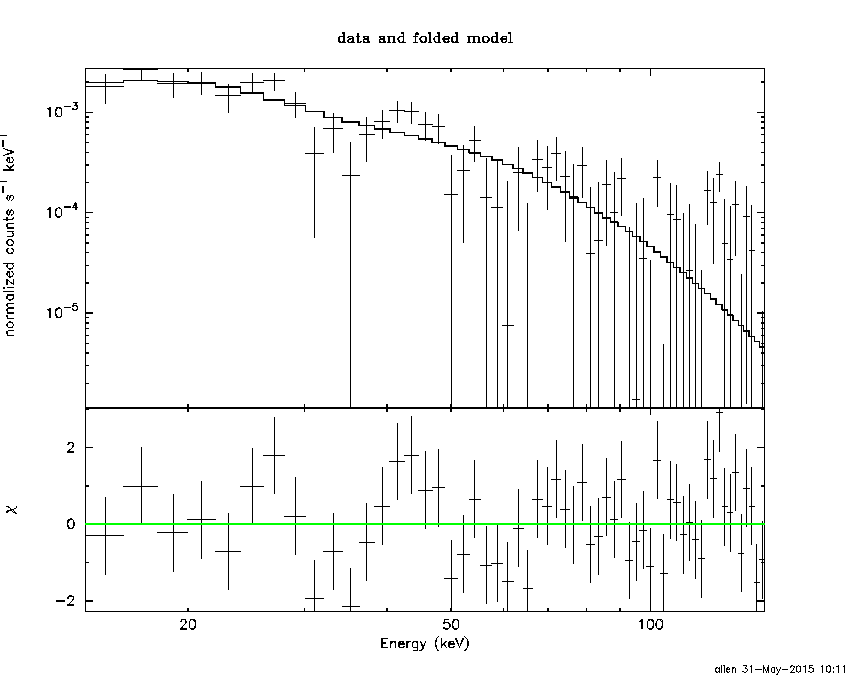
Pre-slew spectrum (Pre-slew PHA with pre-slew DRM)
Power-law model

Spectral model in power-law:
------------------------------------------------------------
Parameters  : value       lower 90%   higher 90%
Photon index: 2.01088     ( -0.220264   0.234422 )
Norm@50keV  : 2.88590E-03    ( -0.000449007   0.000436878 )
------------------------------------------------------------
#Fit statistic : Chi-Squared =          66.44 using 59 PHA bins.
# Reduced chi-squared =          1.166 for     57 degrees of freedom
# Null hypothesis probability =   1.838341e-01

Photon flux (15-150 keV)    in 6.288 sec: 0.435065 ( -0.0499352  0.0499364 ) ph/cm2/s
Energy fluence (15-150 keV)             : 1.67445e-07 ( -2.39201e-08  2.46254e-08 ) ergs/cm2
Cutoff power-law model

Spectral model in the cutoff power-law:
------------------------------------------------------------
Parameters  : value       lower 90%   higher 90%
Photon index: 1.83745     ( -1.08502   0.297338 )
Epeak [keV] : 37.4692      (   )
Norm@50keV  : 3.66387E-03    (     )
------------------------------------------------------------
#Fit statistic : Chi-Squared =          66.32 using 59 PHA bins.
# Reduced chi-squared =          1.184 for     56 degrees of freedom
# Null hypothesis probability =   1.626829e-01

Photon flux (15-150 keV)    in 6.288 sec: 0.432022 ( -0.052245  0.051747 ) ph/cm2/s
Energy fluence (15-150 keV)             : 1.63734e-07 ( -2.98498e-08  2.76471e-08 ) ergs/cm2
Band function

Spectral model in the Band function:
------------------------------------------------------------
Parameters  : value       lower 90%   higher 90%
alpha       : -0.113151   ( -0.857107   -0.857107 )
beta        : -2.12245    ( -1.50861   0.302247 )
Epeak [keV] : 25.3515      ( -23.6392 177.473 )
Norm@50keV   : 7.40466E-02    ( -0.0720582   826.762 )
------------------------------------------------------------
#Fit statistic : Chi-Squared =          65.85 using 59 PHA bins.
# Reduced chi-squared =          1.197 for     55 degrees of freedom
# Null hypothesis probability =   1.500692e-01

Photon flux (15-150 keV)    in 6.288 sec:  (    ) ph/cm2/s
Energy fluence (15-150 keV)             : 0 ( 0  0 ) ergs/cm2
S(25-50 keV) vs. S(50-100 keV) plot

S(25-50 keV)  = 5.06e-08
S(50-100 keV) = 5.02e-08
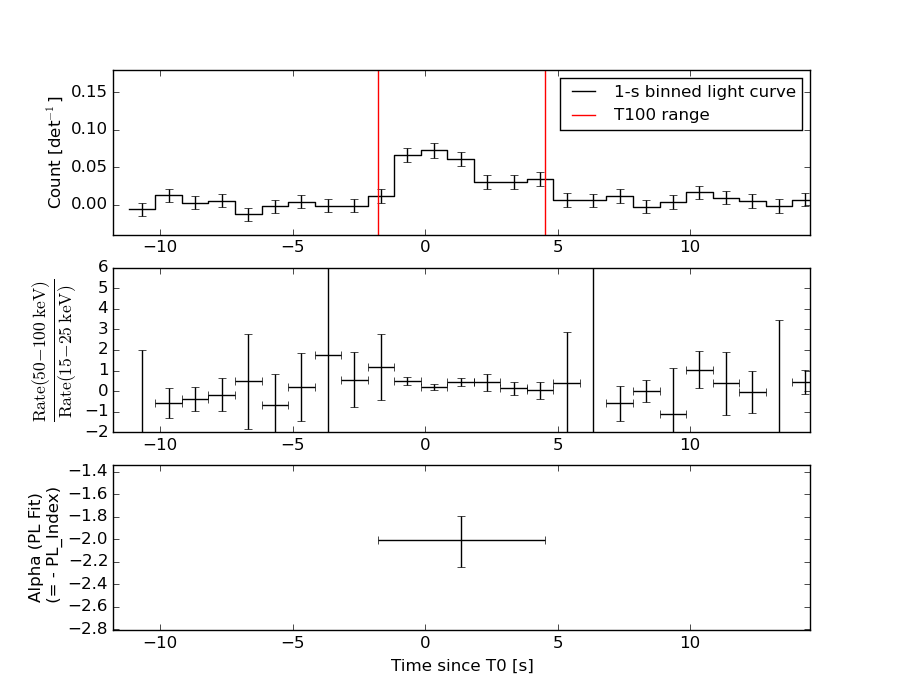
T90 vs. Hardness ratio plot
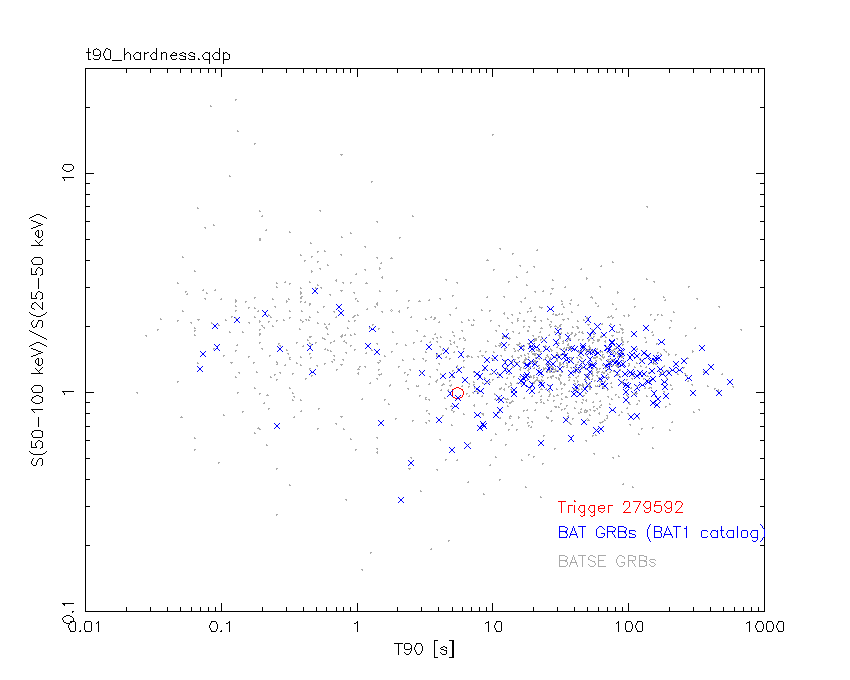
T90                                   = 5.50400000810623 sec.
Hardness ratio (energy fluence ratio) = 0.992095
Color vs. Color plot

Count Ratio  (25-50 keV) / (15-25 keV) = 1.047
Count Ratio (50-100 keV) / (15-25 keV) = 0.380396
Mask shadow pattern
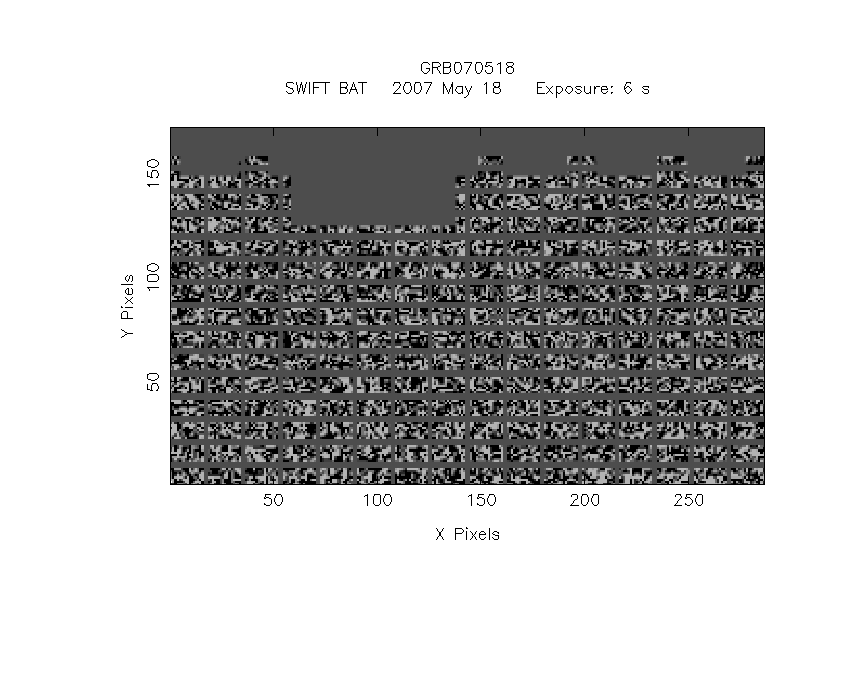
IMX = 1.887765493872842E-01, IMY = 2.840501912307377E-01
TIME vs. PHA plot around the trigger time
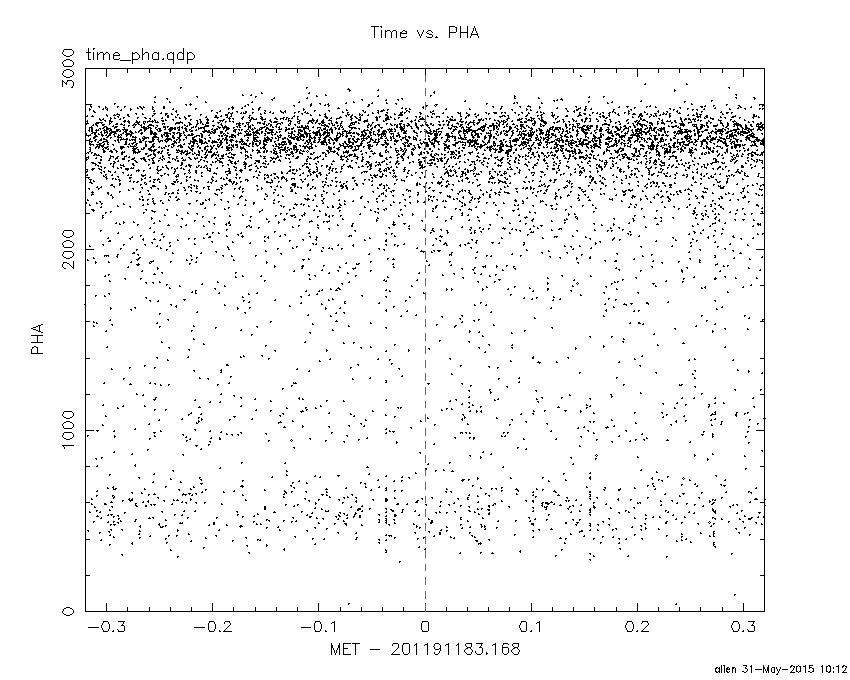
Blue+Cyan dotted lines: Time interval of the scaled map
From 0.000000 to 1.024000
TIME vs. DetID plot around the trigger time
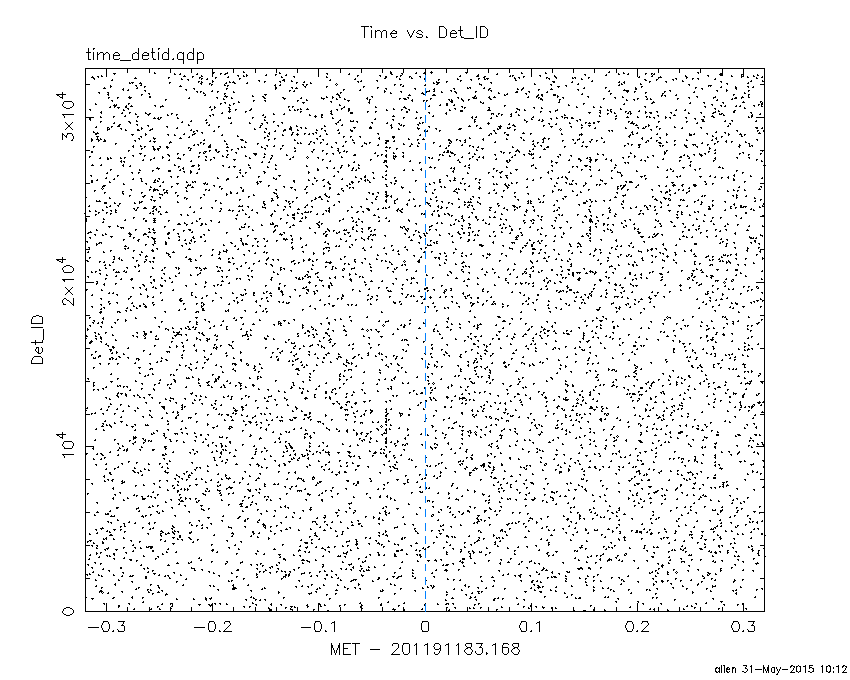
Blue+Cyan dotted lines: Time interval of the scaled map
From 0.000000 to 1.024000
100 us light curve (15-350 keV)
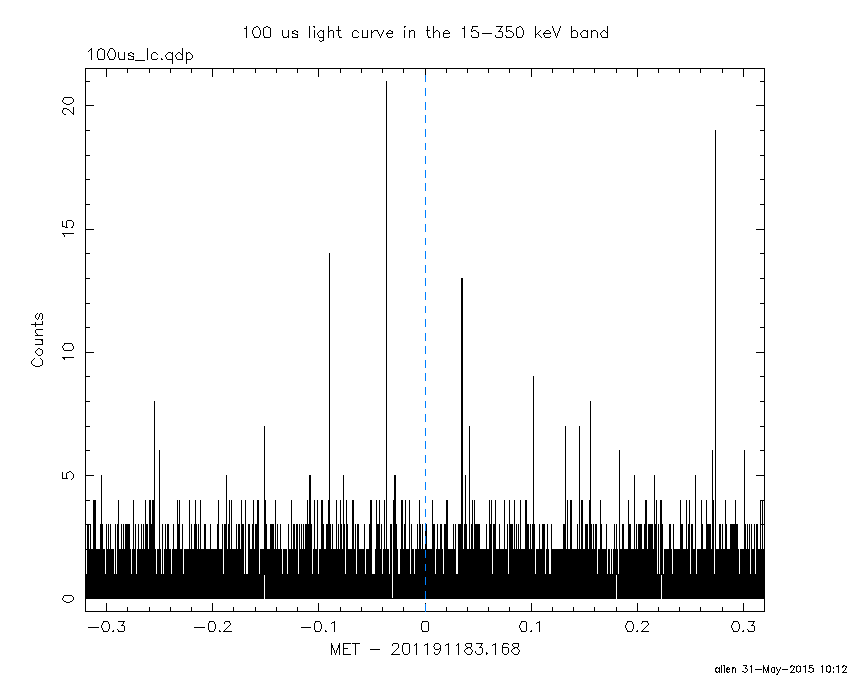
Blue+Cyan dotted lines: Time interval of the scaled map
From 0.000000 to 1.024000
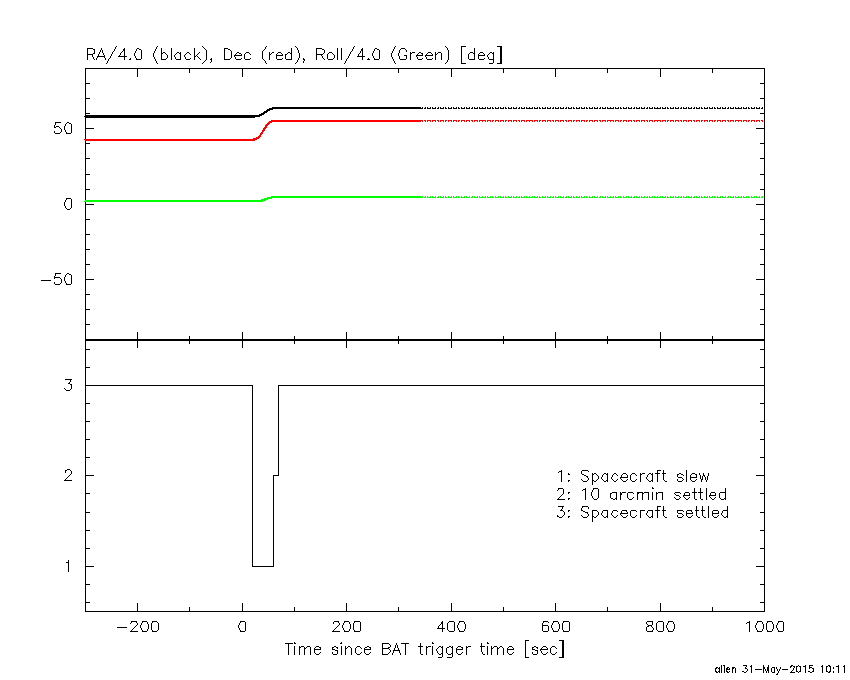
Spacecraft aspect plot
Bright source in the pre-burst/pre-slew/post-slew images
Pre-burst image of 15-350 keV band
Time interval of the image:
-239.168000 -1.784000

# RAcent  DECcent POSerr Theta    Phi  PeakCts   SNR AngSep     Name
#  [deg]    [deg]    ['] [deg]  [deg]                   [']
254.4538  35.3464    0.8  18.6    9.0   2.0904  14.9    0.3	Her X-1
299.5893  35.1892    1.0  51.4  -22.6   4.6493  12.0    0.7	Cyg X-1
308.2507  40.9528    4.2  54.5  -33.1   2.2215   2.8    6.4	Cyg X-3
256.2554   2.7666    2.8  45.3   48.2   2.5585   4.1 ------	UNKNOWN
171.2061  34.2756    2.5  47.6 -176.1   1.3349   4.6 ------	UNKNOWN
160.3497  28.9759    2.9  58.2 -175.5   3.7831   4.0 ------	UNKNOWN
195.0214  52.5157    2.3  26.7 -152.8   0.8067   5.1 ------	UNKNOWN
188.9274  55.4063    2.7  30.5 -147.6   0.7619   4.3 ------	UNKNOWN
305.4118  28.7584    2.1  59.0  -19.3   5.2727   5.5 ------	UNKNOWN
Pre-slew background subtracted image of 15-350 keV band
Time interval of the image:
-1.784000 4.504000

# RAcent  DECcent POSerr Theta    Phi  PeakCts   SNR AngSep     Name
#  [deg]    [deg]    ['] [deg]  [deg]                   [']
254.3138  35.4530    3.7  18.4    8.9   0.0661   3.1    9.7	Her X-1
299.4845  35.2180    6.3  51.3  -22.6  -0.1031  -1.8    5.3	Cyg X-1
308.1996  41.1535    8.4  54.3  -33.3  -0.1499  -1.4   12.7	Cyg X-3
254.2184  55.2942    0.8  18.8  -56.4   0.3240  13.6 ------	UNKNOWN
163.2712  39.1204    2.6  50.9 -166.4   0.2248   4.4 ------	UNKNOWN
Post-slew image of 15-350 keV band
Time interval of the image:
59.532590 902.871500

# RAcent  DECcent POSerr Theta    Phi  PeakCts   SNR AngSep     Name
#  [deg]    [deg]    ['] [deg]  [deg]                   [']
254.4463  35.3370    0.7  19.9   70.9   7.3068  16.8    0.6	Her X-1
288.8049  10.9485    1.9  51.9   26.3  11.3884   6.1    0.4	GRS 1915+105
299.5662  35.1868    0.4  36.8   -4.7  14.9707  26.6    1.5	Cyg X-1
307.9815  40.8713   21.4  37.6  -19.1  -0.2727  -0.5    7.6	Cyg X-3
326.2169  38.3678    8.1  49.6  -30.3   1.2408   1.4    3.5	Cyg X-2
192.3642  30.7666    3.3  49.4  158.2   4.7117   3.5 ------	UNKNOWN
193.6580  40.5401    2.6  41.7  166.8   3.1219   4.5 ------	UNKNOWN
296.0356  29.7430    2.3  39.1    4.7   2.8137   5.1 ------	UNKNOWN
308.0455  37.6301    0.8  39.8  -15.3   8.3946  14.9 ------	UNKNOWN
160.4621  41.7713    4.2  58.7 -169.2   8.1747   2.8 ------	UNKNOWN
Plot creation:
Sun May 31 10:13:03 EDT 2015