Special notes of this burst
Image
Pre-slew 15.0-350.0 keV image (Event data)

#   RAcent    DECcent   POSerr    Theta     Phi              Peak Cts       SNR   Name
  193.2467    74.9824   0.0208    30.0333  -139.1017         0.7066714      9.290 TRIG_00279817

Foreground time interval of the image:
 17.000  65.000 (delta_t =  48.000 [sec])
Background time interval of the image:
-239.000  17.000 (delta_t = 256.000 [sec])
Lightcurves
Notes:
- 1) The mask-weighted light curves are using the flight position.
- 2) Multiple plots of different time binning/intervals are shown to cover all scenarios of short/long GRBs, rate/image triggers, and real/false positives.
- 3) For all the mask-weighted lightcurves, the y-axis units are counts/sec/det where a det is 0.4 x 0.4 = 0.16 sq cm.
- 4) The verticle lines correspond to following: green dotted lines are T50 interval, black dotted lines are T90 interval, blue solid line(s) is a spacecraft slew start time, and orange solid line(s) is a spacecraft slew end time.
- 5) Time of each bin is in the middle of the bin.
1 s binning
From T0-310 s to T0+310 s

From T100_start - 20 s to T100_end + 30 s

Full time interval

64 ms binning
Full time interval

From T100_start to T100_end

From T0-5 sec to T0+5 sec

16 ms binning
From T100_start-5 s to T100_start+5 s

Blue+Cyan dotted lines: Time interval of the scaled map
From 0.000000 to 88.000000
8 ms binning
From T100_start-3 s to T100_start+3 s

Blue+Cyan dotted lines: Time interval of the scaled map
From 0.000000 to 88.000000
2 ms binning
From T100_start-1 s to T100_start+1 s

Blue+Cyan dotted lines: Time interval of the scaled map
From 0.000000 to 88.000000
SN=5 or 10 sec. binning (whichever binning is satisfied first)

SN=5 or 10 sec. binning (T < 200 sec)

Quad-rate summed light curves (from T0-300s to T0+1000s)

Spectral Evolution

Spectra
Notes:
- 1) The fitting includes the systematic errors.
- 2) When the burst includes telescope slew time periods, the fitting uses an average response file made from multiple 5-s response files through out the slew time plus single time preiod for the non-slew times, and weighted by the total counts in the corresponding time period using addrmf. An average response file is needed becuase a spectral fit using the pre-slew DRM will introduce some errors in both a spectral shape and a normalization if the PHA file contains a lot of the slew/post-slew time interval.
- 3) For fits to more complicated models (e.g. a power-law over a cutoff power-law), the BAT team has decided to require a chi-square improvement of more than 6 for each extra dof.
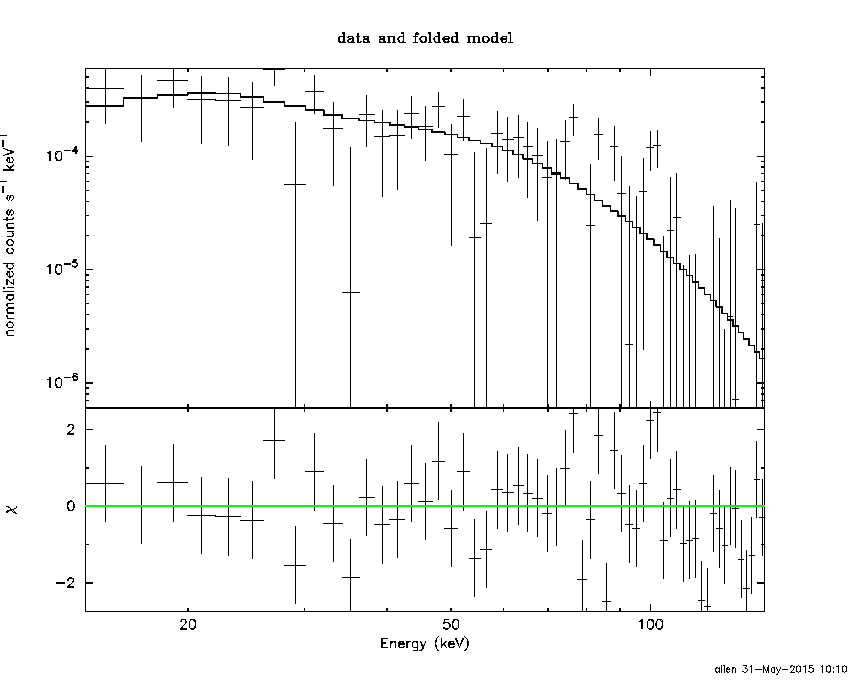
Time averaged spectrum fit using the average DRM
Power-law model

Time interval is from   17.000 sec. to   65.000 sec.

Spectral model in power-law:
------------------------------------------------------------
Parameters  : value       lower 90%   higher 90%
Photon index: 1.68686     ( -0.296093   0.314407 )
Norm@50keV  : 8.56514E-04    ( -0.000174809   0.00017127 )
------------------------------------------------------------
#Fit statistic : Chi-Squared =          82.96 using 59 PHA bins.
# Reduced chi-squared =          1.455 for     57 degrees of freedom
# Null hypothesis probability =   1.398058e-02

Photon flux (15-150 keV)    in 48 sec: 0.113236 ( -0.0208654  0.0208827 ) ph/cm2/s
Energy fluence (15-150 keV)             : 3.81077e-07 ( -8.01586e-08  8.22173e-08 ) ergs/cm2
Cutoff power-law model

Time interval is from   17.000 sec. to   65.000 sec.
Spectral model in the cutoff power-law:
------------------------------------------------------------
Parameters  : value       lower 90%   higher 90%
Photon index: 0.288300     ( -1.64403   1.21349 )
Epeak [keV] : 60.3064      ( -15.1514 68.4385 )
Norm@50keV  : 4.44211E-03    ( -0.00443264   0.023523 )
------------------------------------------------------------
#Fit statistic : Chi-Squared =          78.94 using 59 PHA bins.
# Reduced chi-squared =          1.410 for     56 degrees of freedom
# Null hypothesis probability =   2.338852e-02

Photon flux (15-150 keV)    in 48 sec: 0.108130 ( -0.0212978  0.021386 ) ph/cm2/s
Energy fluence (15-150 keV)             : 3.56677e-07 ( -7.72934e-08  8.30856e-08 ) ergs/cm2
Band function

Time interval is from   17.000 sec. to   65.000 sec.

Spectral model in the Band function:
------------------------------------------------------------
Parameters  : value       lower 90%   higher 90%
alpha       : -0.303747   ( -1.71512   1.23001 )
beta        : -10.0000    ( 10   7.10543e-15 )
Epeak [keV] : 60.8398      ( -15.6986 68.2162 )
Norm@50keV   : 4.32733E-03    ( -0.00432756   0.0236805 )
------------------------------------------------------------
#Fit statistic : Chi-Squared =          78.95 using 59 PHA bins.
# Reduced chi-squared =          1.435 for     55 degrees of freedom
# Null hypothesis probability =   1.884228e-02

Photon flux (15-150 keV)    in 48 sec: 0.111734 ( 6.88827  -0.0264221 ) ph/cm2/s
Energy fluence (15-150 keV)             : 3.66483e-07 ( -3.66147e-07  -8.96501e-08 ) ergs/cm2
Single BB

Spectral model blackbody:
------------------------------------------------------------
Parameters  : value    Lower 90%  Upper 90%
kT [keV]    : 14.3017  (-2.65944  3.19384)
R^2/D10^2   : 1.55829E-02  (-0.0080707   0.0168755)
(R is the radius in km and D10 is the distance to the source in units of 10 kpc)
------------------------------------------------------------
#Fit statistic : Chi-Squared =          81.89 using 59 PHA bins.
# Reduced chi-squared =          1.437 for     57 degrees of freedom
# Null hypothesis probability =   1.703721e-02

Energy  Fluence     90% Error
[keV]   [erg/cm2]   [erg/cm2]
15- 25  3.225e-08   1.187e-08
25- 50  1.225e-07   3.571e-08
50-150  1.667e-07   6.077e-08
15-150  3.214e-07   1.037e-07
Thermal bremsstrahlung (OTTB)

Spectral model: thermal bremsstrahlung
------------------------------------------------------------
Parameters  : value         Lower 90%    Upper 90%
kT [keV]    : 128.154       (-59.3595      -125.596)
Norm        : 0.479861       (-0.0970055     0.128687)
------------------------------------------------------------
#Fit statistic : Chi-Squared =          80.75 using 59 PHA bins.
# Reduced chi-squared =          1.417 for     57 degrees of freedom
# Null hypothesis probability =   2.094446e-02

Energy  Fluence     90% Error
[keV]   [erg/cm2]   [erg/cm2]
15- 25  5.981e-08   3.425e-08
25- 50  1.082e-07   6.026e-08
50-150  1.993e-07   1.302e-07
15-150  3.673e-07   2.222e-07
Double BB

Spectral model: bbodyrad<1> + bbodyrad<2>
------------------------------------------------------------
Parameters  : value         Lower 90%    Upper 90%
kT1 [keV]   : 4.01725        (-2.9629      4.84254)
R1^2/D10^2  : 0.775373        (-0.740722      5.8465)
kT2 [keV]   : 16.9566        (-3.73432      6.14669)
R2^2/D10^2  : 7.63324E-03    (-0.00558302   0.00851579)
------------------------------------------------------------
#Fit statistic : Chi-Squared =          77.08 using 59 PHA bins.
# Reduced chi-squared =          1.401 for     55 degrees of freedom
# Null hypothesis probability =   2.638069e-02

Energy  Fluence     90% Error
[keV]   [erg/cm2]   [erg/cm2]
15- 25  5.603e-08   3.092e-08
25- 50  1.074e-07   5.940e-08
50-150  1.946e-07   1.122e-07
15-150  3.581e-07   1.883e-07
Peak spectrum fit
Power-law model

Time interval is from   40.500 sec. to   41.500 sec.

Spectral model in power-law:
------------------------------------------------------------
Parameters  : value       lower 90%   higher 90%
Photon index: 2.39475     ( -1.27189   2.17692 )
Norm@50keV  : 1.29292E-03    ( -0.00129292   0.00131773 )
------------------------------------------------------------
#Fit statistic : Chi-Squared =          38.32 using 59 PHA bins.
# Reduced chi-squared =         0.6723 for     57 degrees of freedom
# Null hypothesis probability =   9.727926e-01

Photon flux (15-150 keV)    in 1 sec: 0.238488 ( -0.14259  0.14353 ) ph/cm2/s
Energy fluence (15-150 keV)             : 1.25971e-08 ( -8.82948e-09  1.15668e-08 ) ergs/cm2
Cutoff power-law model

Time interval is from   40.500 sec. to   41.500 sec.
Spectral model in the cutoff power-law:
------------------------------------------------------------
Parameters  : value       lower 90%   higher 90%
Photon index: 1.99706     (     )
Epeak [keV] : 22.8021      (   )
Norm@50keV  : 1.60431E-03    (     )
------------------------------------------------------------
#Fit statistic : Chi-Squared =          38.59 using 59 PHA bins.
# Reduced chi-squared =         0.6890 for     56 degrees of freedom
# Null hypothesis probability =   9.633425e-01

Photon flux (15-150 keV)    in 1 sec: 0.238113 ( -0.14095  0.143216 ) ph/cm2/s
Energy fluence (15-150 keV)             : 1.22883e-08 ( -1.22883e-08  1.16599e-08 ) ergs/cm2
Band function

Time interval is from   40.500 sec. to   41.500 sec.

Spectral model in the Band function:
------------------------------------------------------------
Parameters  : value       lower 90%   higher 90%
alpha       : 4.86396   ( -4.86396   -4.86396 )
beta        : -2.61923    ( 2.61923   1.43696 )
Epeak [keV] : 18.9050      ( -18.905 20.1822 )
Norm@50keV   : 1616.13    ( -942.525   1.55615e+07 )
------------------------------------------------------------
#Fit statistic : Chi-Squared =          38.12 using 59 PHA bins.
# Reduced chi-squared =         0.6932 for     55 degrees of freedom
# Null hypothesis probability =   9.595895e-01

Photon flux (15-150 keV)    in 1 sec:  (    ) ph/cm2/s
Energy fluence (15-150 keV)             : 0 ( 0  0 ) ergs/cm2
Single BB

Spectral model blackbody:
------------------------------------------------------------
Parameters  : value    Lower 90%  Upper 90%
kT [keV]    : 6.52913  (-3.54684  6.46934)
R^2/D10^2   : 0.609245  (-0.608921   21.4422)
(R is the radius in km and D10 is the distance to the source in units of 10 kpc)
------------------------------------------------------------
#Fit statistic : Chi-Squared =          38.46 using 59 PHA bins.
# Reduced chi-squared =         0.6747 for     57 degrees of freedom
# Null hypothesis probability =   9.717643e-01

Energy  Fluence     90% Error
[keV]   [erg/cm2]   [erg/cm2]
15- 25  3.859e-09   2.616e-09
25- 50  4.600e-09   3.056e-09
50-150  5.885e-10   5.930e-10
15-150  9.047e-09   6.600e-09
Thermal bremsstrahlung (OTTB)

Spectral model: thermal bremsstrahlung
------------------------------------------------------------
Parameters  : value         Lower 90%    Upper 90%
kT [keV]    : 28.5417       (-28.5417      -28.5417)
Norm        : 1.98153       (-1.98153     13.9403)
------------------------------------------------------------
#Fit statistic : Chi-Squared =          38.37 using 59 PHA bins.
# Reduced chi-squared =         0.6732 for     57 degrees of freedom
# Null hypothesis probability =   9.724368e-01

Energy  Fluence     90% Error
[keV]   [erg/cm2]   [erg/cm2]
15- 25  3.928e-09   2.731e-09
25- 50  4.364e-09   2.984e-09
50-150  2.236e-09   2.425e-09
15-150  1.053e-08   8.045e-09
Double BB

------------------------------------------------------------
#Fit statistic : Chi-Squared =          38.36 using 59 PHA bins.
#Fit statistic : Chi-Squared =          37.74 using 59 PHA bins.
#Fit statistic : Chi-Squared =          37.72 using 59 PHA bins.
#Fit statistic : Chi-Squared =          37.70 using 59 PHA bins.
# Reduced chi-squared =         0.6974 for     55 degrees of freedom
# Reduced chi-squared =         0.6862 for     55 degrees of freedom
# Reduced chi-squared =         0.6859 for     55 degrees of freedom
# Reduced chi-squared =         0.6855 for     55 degrees of freedom
# Null hypothesis probability =   9.570598e-01
# Null hypothesis probability =   9.635081e-01
# Null hypothesis probability =   9.636741e-01
# Null hypothesis probability =   9.638747e-01

Energy  Fluence     90% Error
[keV]   [erg/cm2]   [erg/cm2]
15- 25  3.930e-09   2.883e-09
25- 50  4.467e-09   3.973e-09
50-150  1.102e-09   1.171e-09
15-150  9.499e-09   7.785e-09
Pre-slew spectrum (Pre-slew PHA with pre-slew DRM)
Power-law model

Spectral model in power-law:
------------------------------------------------------------
Parameters  : value       lower 90%   higher 90%
Photon index: 1.68686     ( -0.296093   0.314407 )
Norm@50keV  : 8.56514E-04    ( -0.000174809   0.00017127 )
------------------------------------------------------------
#Fit statistic : Chi-Squared =          82.96 using 59 PHA bins.
# Reduced chi-squared =          1.455 for     57 degrees of freedom
# Null hypothesis probability =   1.398058e-02

Photon flux (15-150 keV)    in 48 sec: 0.113236 ( -0.0208654  0.0208827 ) ph/cm2/s
Energy fluence (15-150 keV)             : 3.81077e-07 ( -8.01586e-08  8.22173e-08 ) ergs/cm2
Cutoff power-law model
Spectral model in the cutoff power-law:
------------------------------------------------------------
Parameters  : value       lower 90%   higher 90%
Photon index: 0.288300     ( -1.64403   1.21349 )
Epeak [keV] : 60.3064      ( -15.1514 68.4385 )
Norm@50keV  : 4.44211E-03    ( -0.00443264   0.023523 )
------------------------------------------------------------
#Fit statistic : Chi-Squared =          78.94 using 59 PHA bins.
# Reduced chi-squared =          1.410 for     56 degrees of freedom
# Null hypothesis probability =   2.338852e-02

Photon flux (15-150 keV)    in 48 sec: 0.108130 ( -0.0212978  0.021386 ) ph/cm2/s
Energy fluence (15-150 keV)             : 3.56677e-07 ( -7.72934e-08  8.30856e-08 ) ergs/cm2
Band function

Spectral model in the Band function:
------------------------------------------------------------
Parameters  : value       lower 90%   higher 90%
alpha       : -0.303747   ( -1.71512   1.23001 )
beta        : -10.0000    ( 10   5.32907e-15 )
Epeak [keV] : 60.8398      ( -15.6986 68.2162 )
Norm@50keV   : 4.32733E-03    ( -0.00432756   0.0236805 )
------------------------------------------------------------
#Fit statistic : Chi-Squared =          78.95 using 59 PHA bins.
# Reduced chi-squared =          1.435 for     55 degrees of freedom
# Null hypothesis probability =   1.884228e-02

Photon flux (15-150 keV)    in 48 sec: 0.111734 ( 6.88827  -0.0264221 ) ph/cm2/s
Energy fluence (15-150 keV)             : 3.66483e-07 ( -3.66147e-07  -8.96501e-08 ) ergs/cm2
S(25-50 keV) vs. S(50-100 keV) plot

S(25-50 keV)  = 1.03e-07
S(50-100 keV) = 1.27e-07
T90 vs. Hardness ratio plot

T90                                   = 48 sec.
Hardness ratio (energy fluence ratio) = 1.23301
Color vs. Color plot

Count Ratio  (25-50 keV) / (15-25 keV) = 1.40272
Count Ratio (50-100 keV) / (15-25 keV) = 1.05238
Mask shadow pattern

IMX = -4.369901669129268E-01, IMY = 3.785099723256006E-01
TIME vs. PHA plot around the trigger time

Blue+Cyan dotted lines: Time interval of the scaled map
From 0.000000 to 88.000000
TIME vs. DetID plot around the trigger time

Blue+Cyan dotted lines: Time interval of the scaled map
From 0.000000 to 88.000000
100 us light curve (15-350 keV)

Blue+Cyan dotted lines: Time interval of the scaled map
From 0.000000 to 88.000000
Spacecraft aspect plot

Bright source in the pre-burst/pre-slew/post-slew images
Pre-burst image of 15-350 keV band
Time interval of the image:
-239.000000 17.000000

# RAcent  DECcent POSerr Theta    Phi  PeakCts   SNR AngSep     Name
#  [deg]    [deg]    ['] [deg]  [deg]                   [']
254.4170  35.3298    0.8  20.0   67.3   2.7174  13.8    2.1	Her X-1
288.7710  10.9553    3.1  51.9   22.8   3.0028   3.8    1.7	GRS 1915+105
299.5847  35.1981    0.5  36.8   -8.3   5.6384  24.8    0.3	Cyg X-1
308.1722  40.8349    6.2  37.7  -22.8  -0.4460  -1.9    7.6	Cyg X-3
326.0246  38.4219    0.0  49.4  -33.8  -0.7433  -1.4    9.2	Cyg X-2
308.0445  37.6203    1.3  39.8  -18.9   2.1668   8.9 ------	UNKNOWN
Pre-slew background subtracted image of 15-350 keV band
Time interval of the image:
17.000000 65.000000

# RAcent  DECcent POSerr Theta    Phi  PeakCts   SNR AngSep     Name
#  [deg]    [deg]    ['] [deg]  [deg]                   [']
254.4705  35.1791   55.7  20.1   67.2   0.0163   0.2    9.8	Her X-1
288.9143  10.9140    9.1  52.0   22.7  -0.4247  -1.3    7.1	GRS 1915+105
299.5744  35.1551    3.0  36.8   -8.2  -0.3273  -3.8    2.9	Cyg X-1
308.0993  41.1117    4.1  37.5  -23.0  -0.2342  -2.8    9.6	Cyg X-3
326.1607  38.2053   11.9  49.7  -33.7  -0.1802  -1.0    7.0	Cyg X-2
171.4607  45.2101    2.3  50.6 -176.9   0.8019   5.1 ------	UNKNOWN
308.4216  38.8659    2.6  39.2  -20.6   0.3988   4.5 ------	UNKNOWN
193.2466  74.9823    1.3  30.0 -139.1   0.7063   9.3 ------	UNKNOWN
335.5364  62.0106    2.5  40.0  -65.9   0.7912   4.7 ------	UNKNOWN
108.8526  77.3601    2.4  45.6 -122.2   1.3191   4.8 ------	UNKNOWN
Post-slew image of 15-350 keV band
Time interval of the image:
147.500590 244.900600

# RAcent  DECcent POSerr Theta    Phi  PeakCts   SNR AngSep     Name
#  [deg]    [deg]    ['] [deg]  [deg]                   [']
 46.7524  66.4354    3.5  37.0  -70.5   0.6918   3.3 ------	UNKNOWN
108.4683  41.7005    2.9  48.7 -130.7   1.7743   4.0 ------	UNKNOWN
Plot creation:
Sun May 31 10:11:20 EDT 2015