batgrbproduct Analysis for Trigger=281993
Analysis Summary
Notes:
- 1) No attempt has been made to eliminate the non-significant decimal places.
- 2) This batgrbproduct analysis is done of the amount of data for this trigger downloaded to date.
- 3) This page will be updated for up to 8 downlinks after the trigger.
======================================================================
                  BAT GRB EVENT DATA PROCESSING REPORT
    Process Script Ver: batgrbproduct v2.45
    Process Start Time (local time): Wed Nov 25 14:32:00 EST 2009
             Host Name: gcn14
   Current Working Dir: /net/raid16/BAT_GRB_process_2009/281993
======================================================================

  Trigger: 00281993      Segment: 000

  BAT Trigger Time: 203201548.16   [s; MET]
      Trigger Stop: 203201550.208   [s; MET]
               UTC: 2007-06-10T20:52:26.146640    [includes UTCF correction]
       Where From?: TDRSS position message

  BAT
    RA: 298.795395293668   Dec: 26.2137864105949  [deg; J2000]

     Catalogged Source?: NO
     Point Source?:      YES
     GRB Indicated?:     YES    [ by BAT flight software ]
     Image S/N Ratio:    7.16
     Image Trigger?:     NO
     Rate S/N Ratio:     10.770329614269  [ if not an image trigger ]
     Image S/N Ratio:    7.16

  Flight Position:   [ source = BAT ]
    RA: 298.795395293668   Dec: 26.2137864105949  [deg; J2000]

  Ground Position:   [ source = BAT pre-slew burst ]
    RA: 298.799324957682   Dec: 26.2552920506668  [deg; J2000]
        { 19h 55m 11.8s , +26d 15' 19.1" }
         +/- 1.82478749405193 [arcmin] (estimated 90% radius based on SNR)
         +/- 0.843690643455537 [arcmin] (formal 1-sigma fit error)
    SNR: 12.8812484622192

  Angular difference between Flight and Ground position is 2.499303 arcmin

  Partial Coding Fraction: 0.5234375    [ including projection effects ]

  Duration
     T90: 5.64799997210503 +/- 0.988380494889452
        Measured from: -0.535999983549118
                   to: 5.11199998855591     [s; relative to TRIGTIME]
     T50: 2.65599995851517 +/- 0.785468034648703
        Measured from: 0.696000009775162
                   to: 3.35199996829033     [s; relative to TRIGTIME]


  Fluence
     Peak Flux  (peak 1 second)
        Measured from: 1.75600001215935
                   to: 2.75600001215935     [s; relative to TRIGTIME]
     Total Fluence
        Measured from: -0.840000003576279
                   to: 5.608000010252     [s; relative to TRIGTIME]

             Band 1     Band 2     Band 3     Band 4
              15-25      25-50     50-100    100-350     keV
 Total     0.171668   0.132179   0.127512   0.032508
           0.018568   0.019189   0.017106   0.015490 [error]
 Peak      0.044275   0.035771   0.021235   0.014340
           0.007450   0.007789   0.006782   0.006162 [error]

     [ fluence units of on-axis counts / fully illuminated detector ]

======================================================================

=== Fluence/Peak Flux Summary (tot_pha/preslew_drm) ===

              Model    Band1    Band2    Band3    Band4    Band5    Total
                       15-25    25-50   50-100  100-350   15-150   15-350   keV
Fluence   Power-law 4.45e-08 7.08e-08 8.52e-08 2.00e-07 2.58e-07 4.02e-07   erg/cm2
              Error 8.97e-09 8.79e-09 1.76e-08 8.77e-08 3.98e-08 1.03e-07   erg/cm2
Peak flux Power-law 4.14e-01 3.04e-01 1.48e-01 1.03e-01 9.14e-01 9.69e-01   ph/cm2/s
              Error 1.20e-01 6.22e-02 5.81e-02 7.90e-02 1.83e-01 2.00e-01   ph/cm2/s

Fluence   Cutoff-PL 4.43e-08 7.09e-08 8.53e-08 1.99e-07 2.58e-07 4.01e-07   erg/cm2
              Error 8.97e-09 8.80e-09 1.76e-08 8.71e-08 3.98e-08 1.03e-07   erg/cm2
Peak flux Cutoff-PL 4.14e-01 3.04e-01 1.48e-01 1.02e-01 9.14e-01 9.68e-01   ph/cm2/s
              Error 1.20e-01 6.22e-02 5.81e-02 7.84e-02 1.83e-01 2.00e-01   ph/cm2/s

Fluence        Band 4.26e-08 7.04e-08 8.79e-08 2.18e-07 2.62e-07 4.19e-07   erg/cm2
              Error 6.09e-09 8.72e-09 1.14e-08 6.15e-08 3.44e-08 5.19e-08   erg/cm2
Peak flux      Band 4.02e-01 3.05e-01 1.53e-01 1.10e-01 9.15e-01 9.93e-01   ph/cm2/s
              Error 9.00e-02 6.09e-02 3.65e-02 4.41e-02 1.83e-01 0.00e+00   ph/cm2/s
=== Time-averaged spectral analysis ===

Model Ph_index Ph_90err Epeak  Epeak_90err Norm     Nomr_90err chi2   dof
PL    1.734    0.253    -      -           4.33e-03 6.32e-04   51.335 57
CPL   1.733    0.254    9999.2 5000.0      4.34e-03 6.37e-04   51.342 56


=== 1-s peak spectral analysis ===

Model Ph_index Ph_90err Epeak  Epeak_90err Norm     Nomr_90err chi2   dof
PL    2.035    0.445    -      -           6.00e-03 1.74e-03   62.836 57
CPL   2.065    0.000      30.3 5000.0      5.30e-03 0.00e+00   62.593 56

Model      : spectral model: simple power-law (PL) and cutoff power-law (CPL)
Ph_index   : photon index: E^-{Ph_index} (minus sign is not included in the index)
Ph_90err   : 90% error of the photon index
Epeak      : Epeak in keV
Epeak_90err: 90% error of Epeak
Norm       : normalization at 50 keV in PL model and at 1 keV in CPL model
Nomr_90err : 90% error of the normalization
chi2       : Chi-Squared
dof        : degree of freedom
=== T90/T50 calculation in the 50-300 keV band (BATSE band) using 64 ms lc ===

T90 in the 50-300 keV band: 6.464000 sec.
T50 in the 50-300 keV band: 2.688000 sec.
=== Table of the duration information ==

        Value   tstart    tstop
T100    6.448   -0.840    5.608
T90     5.648   -0.536    5.112
T50     2.656    0.696    3.352
Peak    1.000    1.756    2.756
Image
Pre-slew 15-350 keV image (Event data; bgd subtracted)

#   RAcent  DECcent POSerr  Theta    Phi     Peak Cts     SNR  Name
  298.7993 +26.2553 0.0149   26.0  110.4       0.4501    12.9  TRIG_00281993
------------------------------------------

Foreground time interval of the image:
203201547.320000 203201553.768000
Background time interval of the image:
203201309.000000 203201547.320000
Lightcurves
Notes:
- 1) All plots contain as much data as has been downloaded to date.
- 2) Multiple plots of different time binning/intervals are shown to cover all scenarios of short/long GRBs, rate/image triggers, and real/false positives.
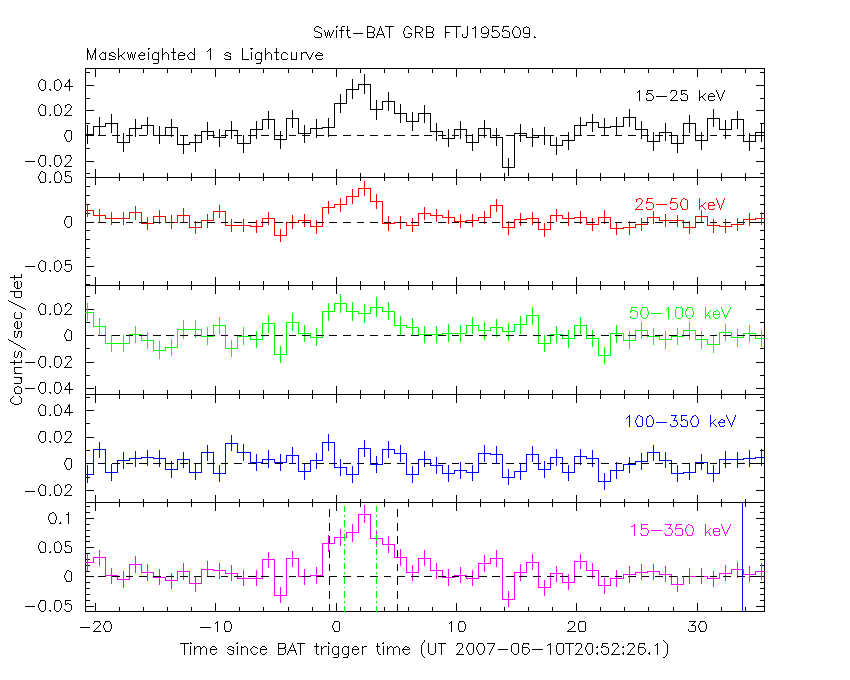
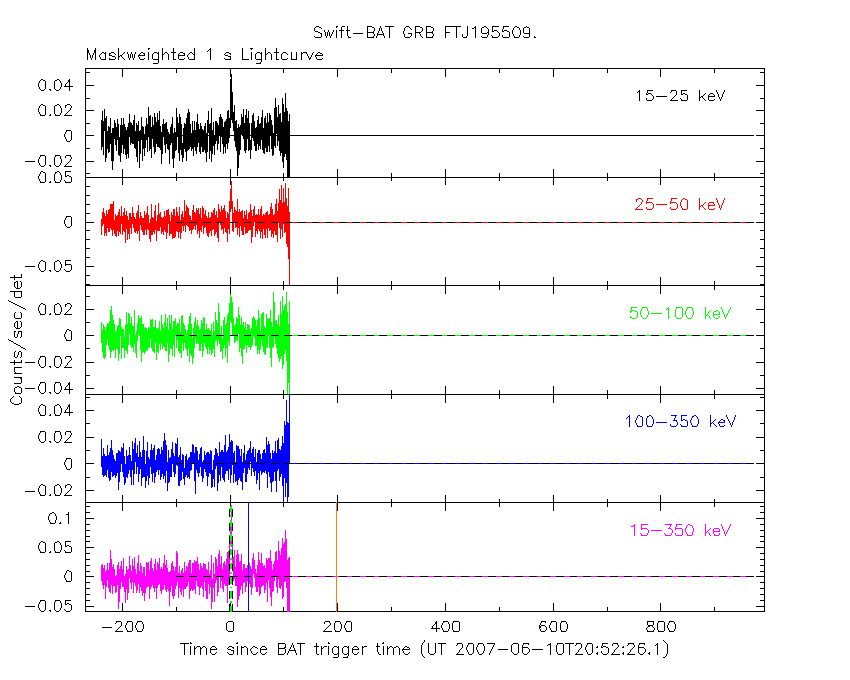
- 3) For all the mask-weighted lightcurves, the y-axis units are counts/sec/det where a det is 0.4 x 0.4 = 0.16 sq cm.
- 4) The verticle lines correspond to following: green dotted lines are T50 interval, black dotted lines are T90 interval, blue solid line(s) is a spacecraft slew start time, and orange solid line(s) is a spacecraft slew end time.
- 5) Time of each bin is in the middle of the bin.
1 s binning
From T0-310 s to T0+310 s
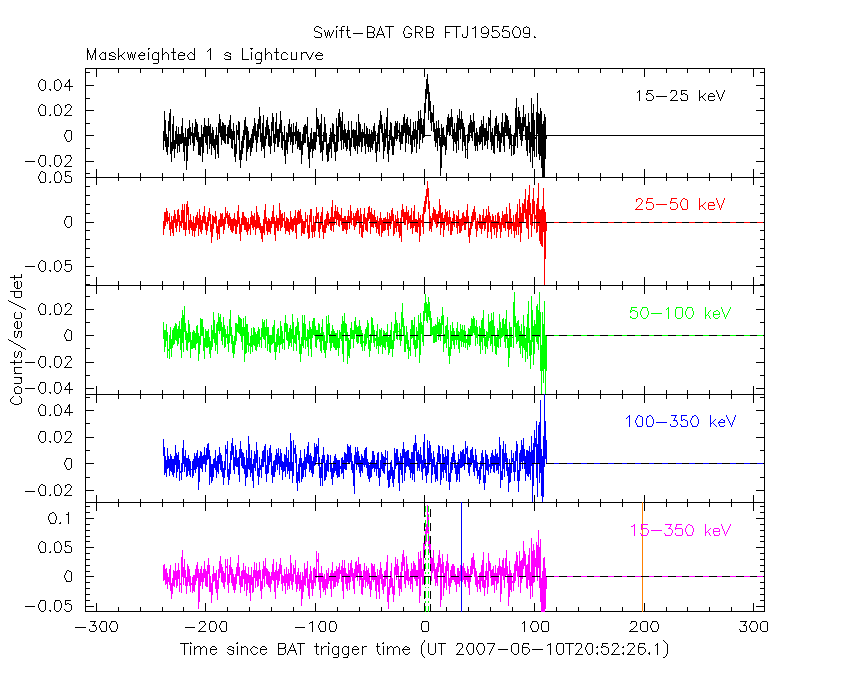
From T100_start - 20 s to T100_end + 30 s
Full time interval
64 ms binning
Full time interval

From T100_start to T100_end
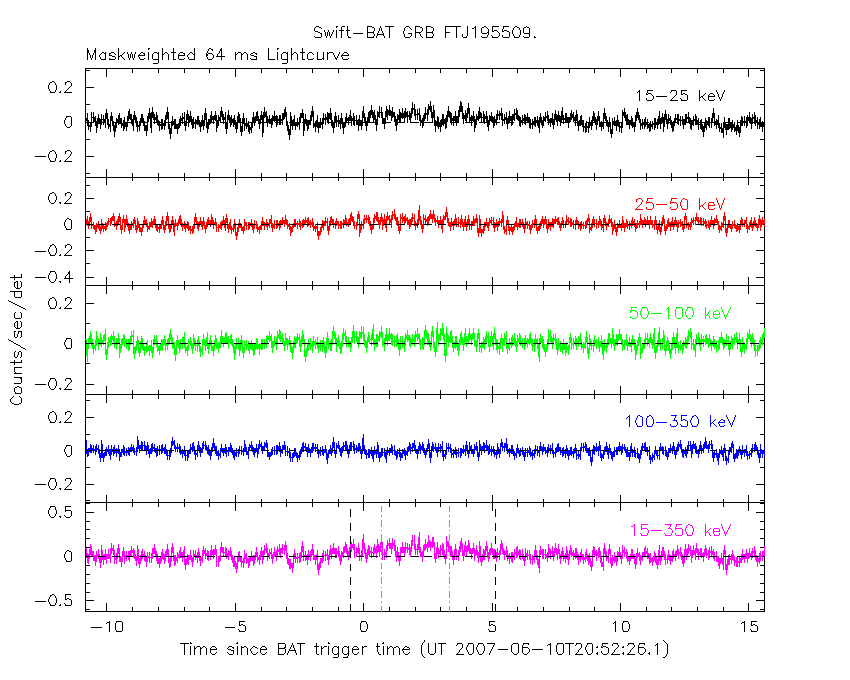
From T0-5 sec to T0+5 sec

16 ms binning
From T100_start-5 s to T100_start+5 s

Blue+Cyan dotted lines: Time interval of the scaled map
From 0.000000 to 2.048000
8 ms binning
From T100_start-3 s to T100_start+3 s
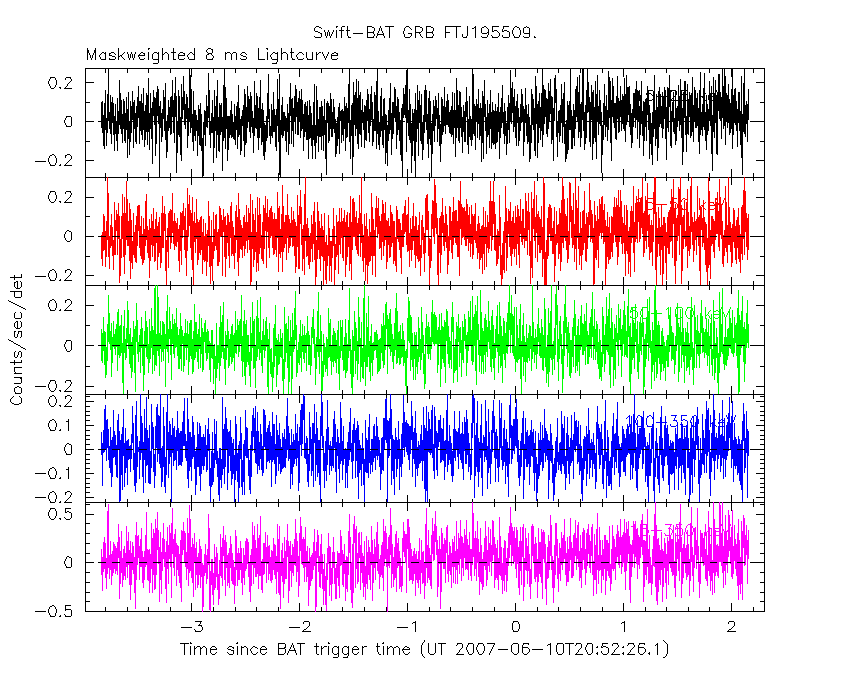
Blue+Cyan dotted lines: Time interval of the scaled map
From 0.000000 to 2.048000
2 ms binning
From T100_start-1 s to T100_start+1 s
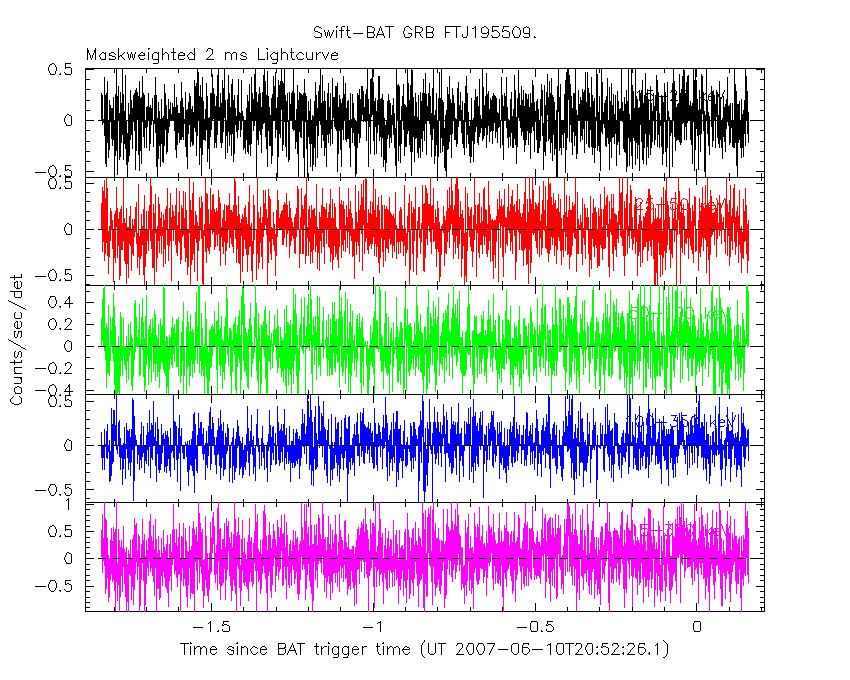
Blue+Cyan dotted lines: Time interval of the scaled map
From 0.000000 to 2.048000
SN=5 or 10 sec. binning (whichever binning is satisfied first)
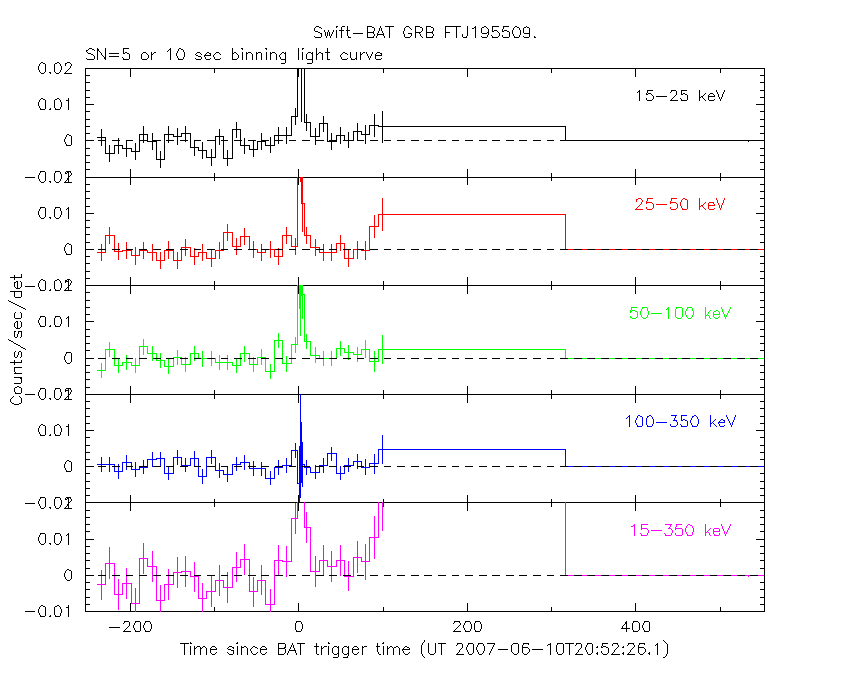
SN=5 or 10 sec. binning (T < 200 sec)

Flight mask-tagged light curves
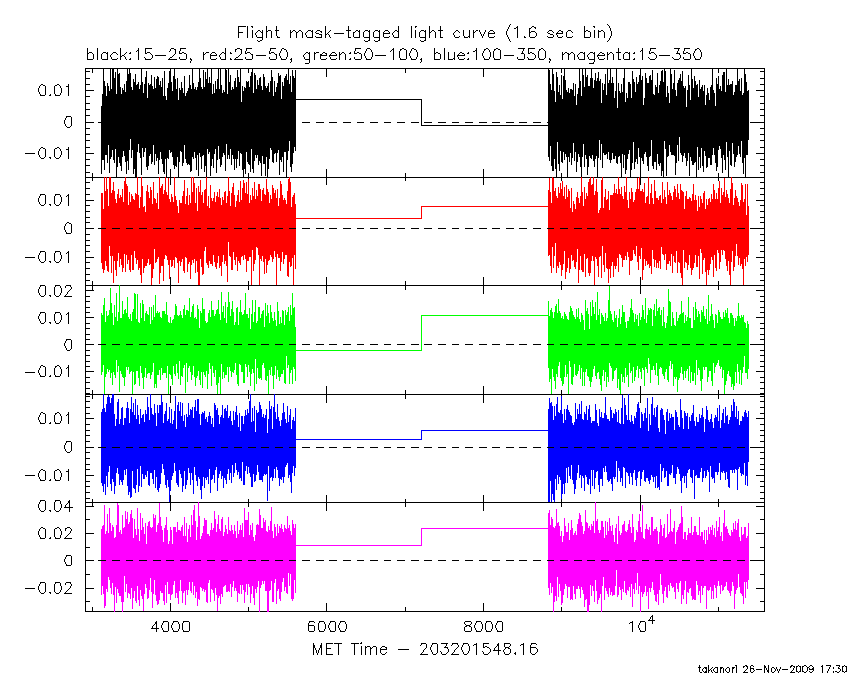
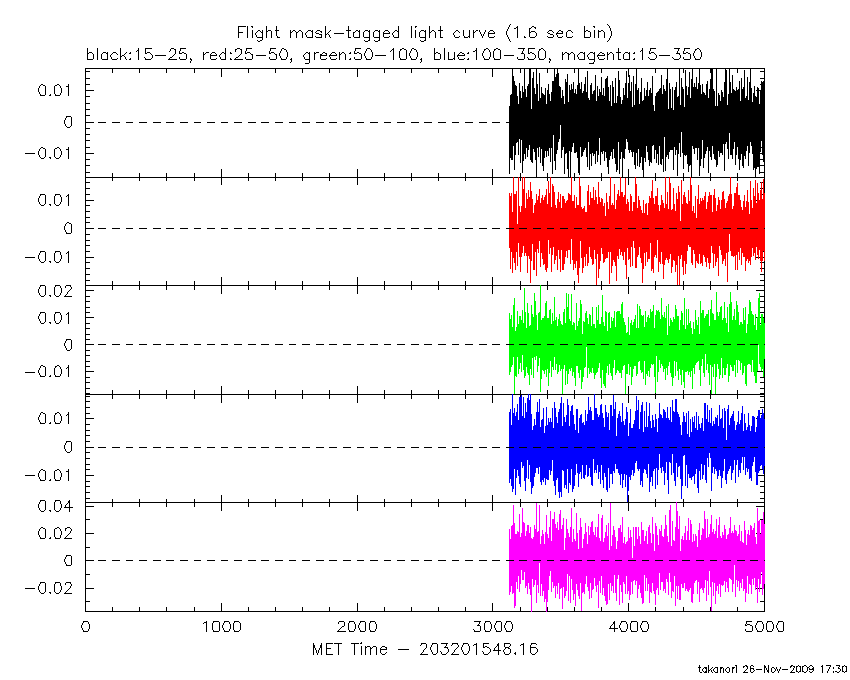
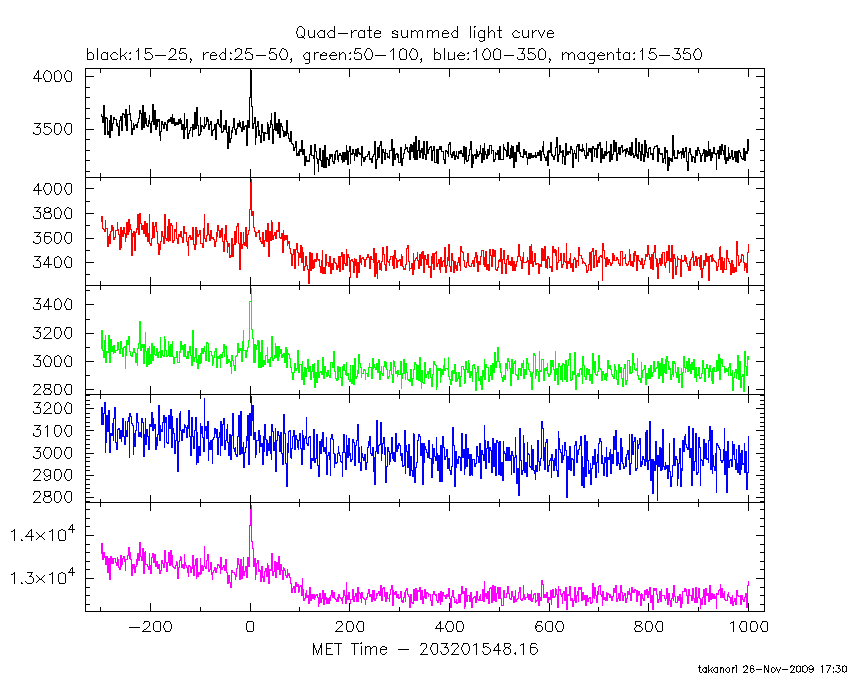
Quad-rate summed light curves (from T0-300 to T0+1000)
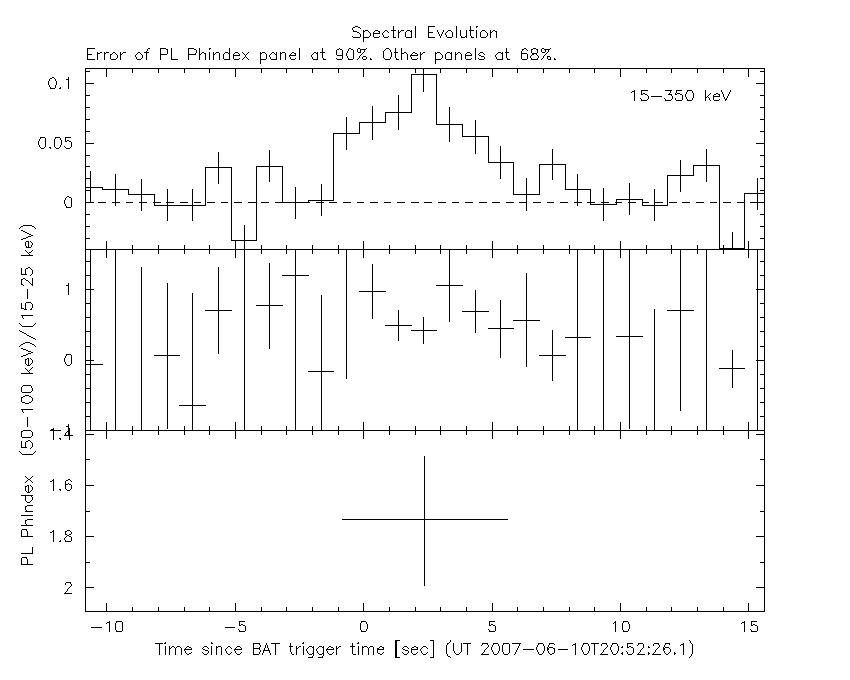
Spectral Evolution
Spectra
Notes:
- 1) The fitting includes the systematic errors.
- 2) For long bursts, a spectral fit of the pre-slew DRM will introduce some errors in both a spectral shape and a normalization if the PHA file contains a lot of the slew/post-slew time interval.
- 3) For fits to more complicated models (e.g. a power-law over a cutoff power-law), the BAT team has decided to require a chi-square improvement of more than 6 for each extra dof.
- 4) For short bursts (T90<1sec), the specrtum is also fit with Blackbody, OTTB, and Double Blackbody.
Time averaged spectrum fit using the pre-slew DRM
Power-law model

Time interval is from   -0.840 sec. to    5.608 sec.

Spectral model in power-law:
------------------------------------------------------------
Parameters  : value       lower 90%   higher 90%
Photon index: 1.73351     ( -0.247407   0.258564 )
Norm@50keV  : 4.333619E-03    ( -6.442703E-04   6.200969E-04) )
------------------------------------------------------------
 Chi-Squared =      51.33490     using    59 PHA bins.
 Reduced chi-squared =     0.9006124     for     57 degrees of freedom
 Null hypothesis probability = 0.687

Photon flux (15-150 keV)    in 6.448 sec: 0.582461 ( -0.072562  0.072609 ) ph/cm2/s
Energy fluence (15-150 keV)             : 2.58061e-07 ( -3.93592e-08  4.03013e-08 ) ergs/cm2
Cutoff power-law model
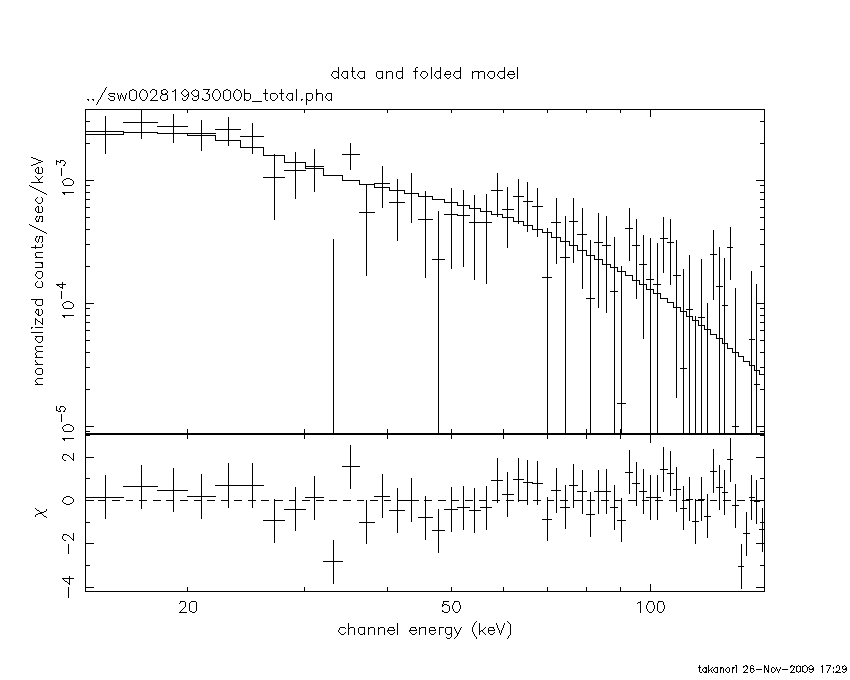
Time interval is from   -0.840 sec. to    5.608 sec.
Spectral model in the cutoff power-law:
------------------------------------------------------------
Parameters  : value       lower 90%   higher 90%
Photon index: 1.73267     ( -0.248344   0.259685 )
Epeak [keV] : 9999.22      ( -9999.21 0.783203 )
Norm@50keV  : 4.339692E-03    ( -6.484787E-04   6.246679E-04) )
------------------------------------------------------------
 Chi-Squared =      51.34221     using    59 PHA bins.
 Reduced chi-squared =     0.9168251     for     56 degrees of freedom
 Null hypothesis probability = 0.652

Photon flux (15-150 keV)    in 6.448 sec: 0.582214 ( -0.072538  0.072584 ) ph/cm2/s
Energy fluence (15-150 keV)             : 2.58088e-07 ( -3.94037e-08  4.02645e-08 ) ergs/cm2
Band function
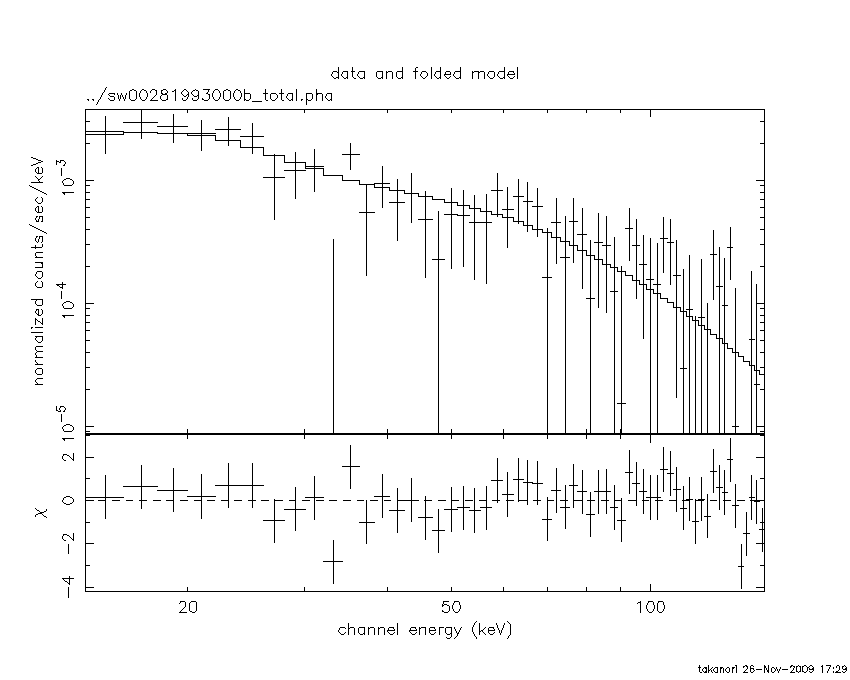
Time interval is from   -0.840 sec. to    5.608 sec.

Spectral model in the Band function:
------------------------------------------------------------
Parameters  : value       lower 90%   higher 90%
alpha       : -1.73264   ( -8.26736   0.248316 )
beta        : -7.38207    ( -2.61793   5.66473 )
Epeak [keV] : 9999.16      ( -9999.07 0.834961 )
Norm@50keV   : 4.339094E-03    ( -6.488701E-04   6.240732E-04) )
------------------------------------------------------------
 Chi-Squared =      51.34223     using    59 PHA bins.
 Reduced chi-squared =     0.9334951     for     55 degrees of freedom
 Null hypothesis probability = 0.615

Photon flux (15-150 keV)    in 6.448 sec: 0.582214 ( -0.072538  0.072583 ) ph/cm2/s
Energy fluence (15-150 keV)             : 2.61731e-07 ( -3.63171e-08  3.24115e-08 ) ergs/cm2
Peak spectrum fit
Power-law model

Time interval is from    1.752 sec. to    2.760 sec.

Spectral model in power-law:
------------------------------------------------------------
Parameters  : value       lower 90%   higher 90%
Photon index: 2.03540     ( -0.416435   0.474525 )
Norm@50keV  : 5.996600E-03    ( -1.802810E-03   1.677157E-03) )
------------------------------------------------------------
 Chi-Squared =      62.83575     using    59 PHA bins.
 Reduced chi-squared =      1.102381     for     57 degrees of freedom
 Null hypothesis probability = 0.277

Photon flux (15-150 keV)    in 1.008 sec: 0.914453 ( -0.182592  0.182597 ) ph/cm2/s
Energy fluence (15-150 keV)             : 5.58312e-08 ( -1.45093e-08  1.54223e-08 ) ergs/cm2
Cutoff power-law model

Time interval is from    1.752 sec. to    2.760 sec.
Spectral model in the cutoff power-law:
------------------------------------------------------------
Parameters  : value       lower 90%   higher 90%
Photon index: 2.06524     (     )
Epeak [keV] : 30.2809      ( -44.7303 9955.26 )
Norm@50keV  : 5.297586E-03    (     )
------------------------------------------------------------
 Chi-Squared =      62.59330     using    59 PHA bins.
 Reduced chi-squared =      1.117737     for     56 degrees of freedom
 Null hypothesis probability = 0.254

Photon flux (15-150 keV)    in 1.008 sec: 0.914071 ( -0.182534  0.182539 ) ph/cm2/s
Energy fluence (15-150 keV)             : 5.58516e-08 ( -1.45631e-08  1.53831e-08 ) ergs/cm2
Band function

Time interval is from    1.752 sec. to    2.760 sec.

Spectral model in the Band function:
------------------------------------------------------------
Parameters  : value       lower 90%   higher 90%
alpha       : -1.52162   ( -3.433228E-04   14.9997 )
beta        : -1.98193    ( -0.474753   0.415688 )
Epeak [keV] : 10.3983      ( -10.2983 9989.60 )
Norm@50keV   : 2.046524E-02    ( -0.245090   0.227902 )
------------------------------------------------------------
 Chi-Squared =      62.87780     using    59 PHA bins.
 Reduced chi-squared =      1.143233     for     55 degrees of freedom
 Null hypothesis probability = 0.217

Photon flux (15-150 keV)    in 1.008 sec: 0.914670 ( -0.182649  0.18259 ) ph/cm2/s
Energy fluence (15-150 keV)             : 5.63051e-08 ( -1.12399e-08  2.16859e-08 ) ergs/cm2
Pre-slew spectrum (Pre-slew PHA with pre-slew DRM)
Power-law model

Spectral model in power-law:
------------------------------------------------------------
Parameters  : value       lower 90%   higher 90%
Photon index: 1.73351     ( -0.247407   0.258564 )
Norm@50keV  : 4.333619E-03    ( -6.442703E-04   6.200969E-04) )
------------------------------------------------------------
 Chi-Squared =      51.33490     using    59 PHA bins.
 Reduced chi-squared =     0.9006124     for     57 degrees of freedom
 Null hypothesis probability = 0.687

Photon flux (15-150 keV)    in 6.448 sec: 0.582461 ( -0.072562  0.072609 ) ph/cm2/s
Energy fluence (15-150 keV)             : 2.58061e-07 ( -3.93592e-08  4.03013e-08 ) ergs/cm2
Cutoff power-law model
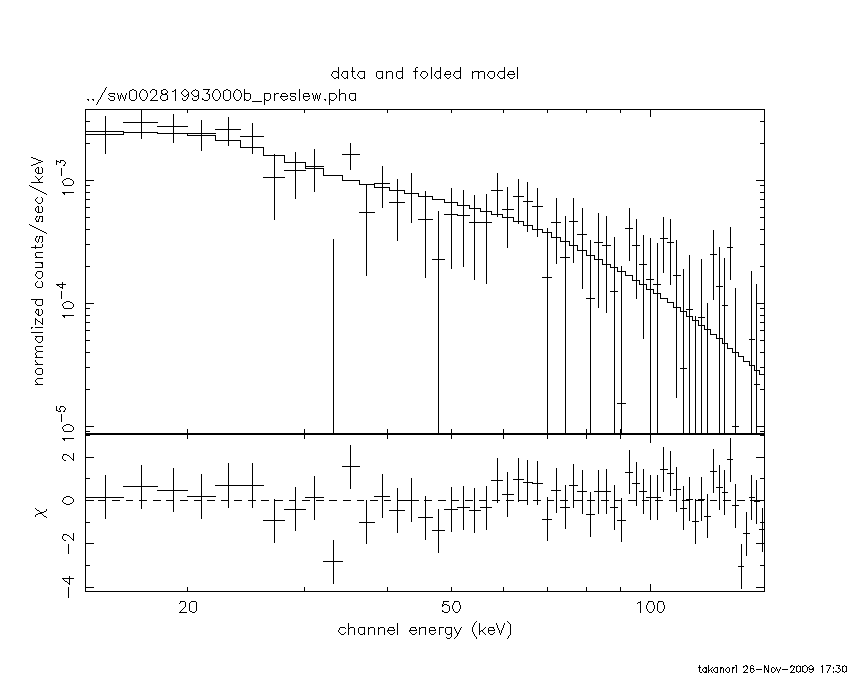
Spectral model in the cutoff power-law:
------------------------------------------------------------
Parameters  : value       lower 90%   higher 90%
Photon index: 1.73267     ( -0.248344   0.259685 )
Epeak [keV] : 9999.22      ( -9999.21 0.783203 )
Norm@50keV  : 4.339692E-03    ( -6.484787E-04   6.246679E-04) )
------------------------------------------------------------
 Chi-Squared =      51.34221     using    59 PHA bins.
 Reduced chi-squared =     0.9168251     for     56 degrees of freedom
 Null hypothesis probability = 0.652

Photon flux (15-150 keV)    in 6.448 sec: 0.582214 ( -0.072538  0.072584 ) ph/cm2/s
Energy fluence (15-150 keV)             : 2.58088e-07 ( -3.94037e-08  4.02645e-08 ) ergs/cm2
Band function

Spectral model in the Band function:
------------------------------------------------------------
Parameters  : value       lower 90%   higher 90%
alpha       : -1.73264   ( -8.26736   0.248316 )
beta        : -7.38207    ( -2.61793   5.66473 )
Epeak [keV] : 9999.16      ( -9999.07 0.834961 )
Norm@50keV   : 4.339094E-03    ( -6.488701E-04   6.240732E-04) )
------------------------------------------------------------
 Chi-Squared =      51.34223     using    59 PHA bins.
 Reduced chi-squared =     0.9334951     for     55 degrees of freedom
 Null hypothesis probability = 0.615

Photon flux (15-150 keV)    in 6.448 sec: 0.582214 ( -0.072538  0.072583 ) ph/cm2/s
Energy fluence (15-150 keV)             : 2.61731e-07 ( -3.63171e-08  3.24115e-08 ) ergs/cm2
S(25-50 keV) vs. S(50-100 keV) plot

S(25-50 keV)  = 7.083e-08
S(50-100 keV) = 8.51736e-08
T90 vs. Hardness ratio plot
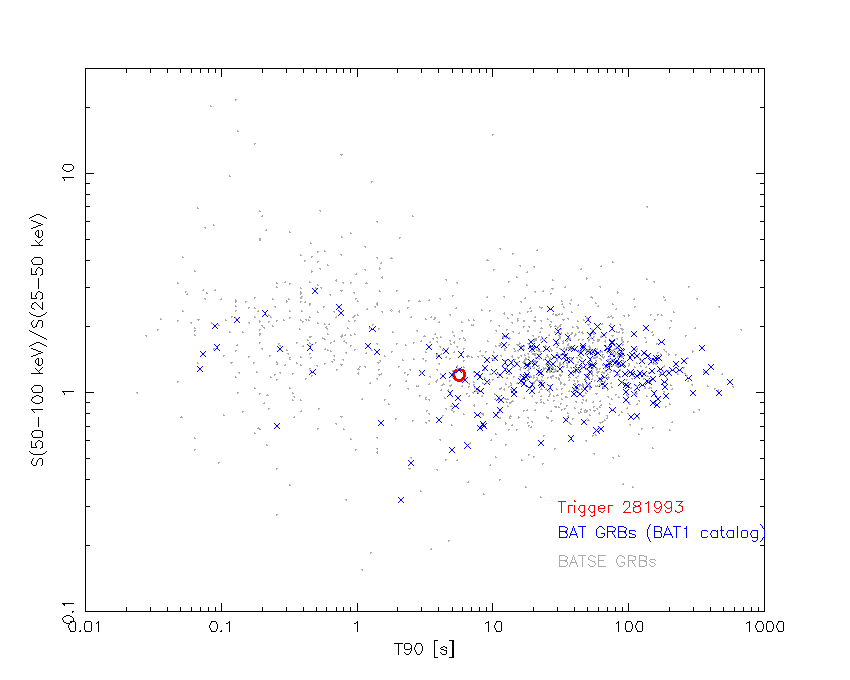
T90            = 5.64799997210503 sec.
Hardness ratio = 1.20251
Color vs. Color plot
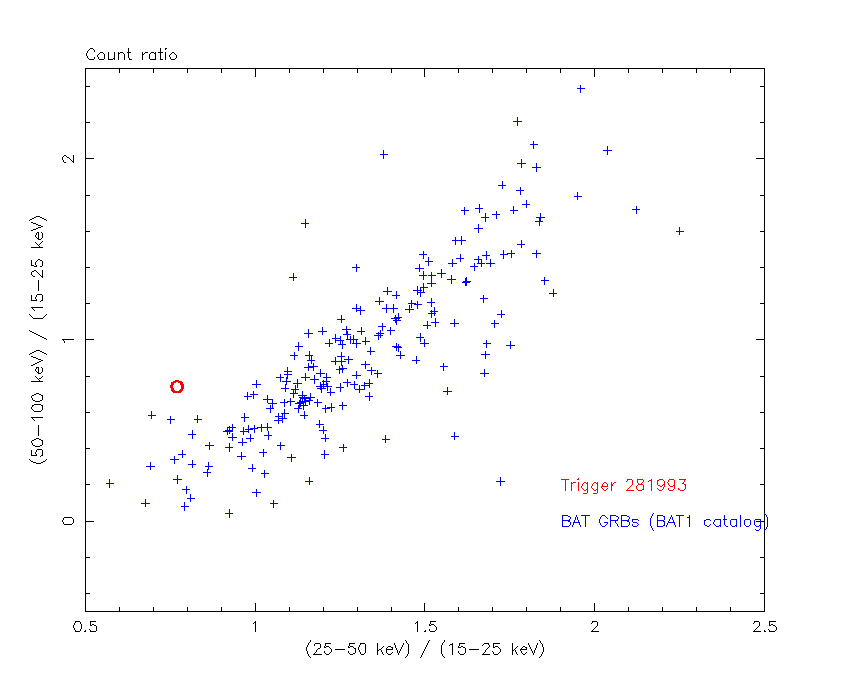
Count ratio  (25-50 keV) / (15-25 keV) = 0.769969
Count ratio (100-50 keV) / (15-25 keV) = 0.742783
DPI of the refined source position

IMX = -1.701727718788256E-01, IMY = -4.576253514904684E-01
TIME vs. PHA plot around the trigger time
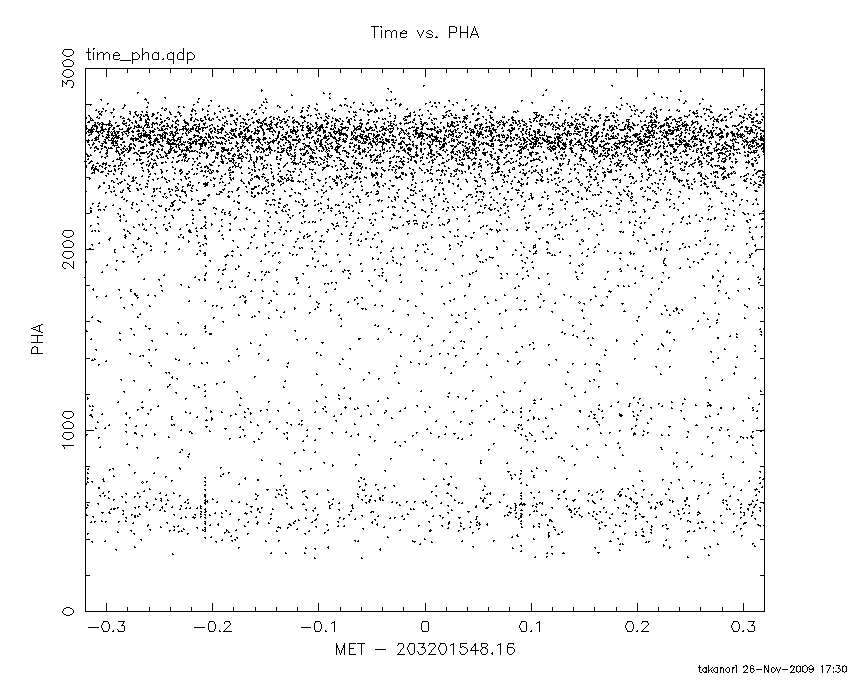
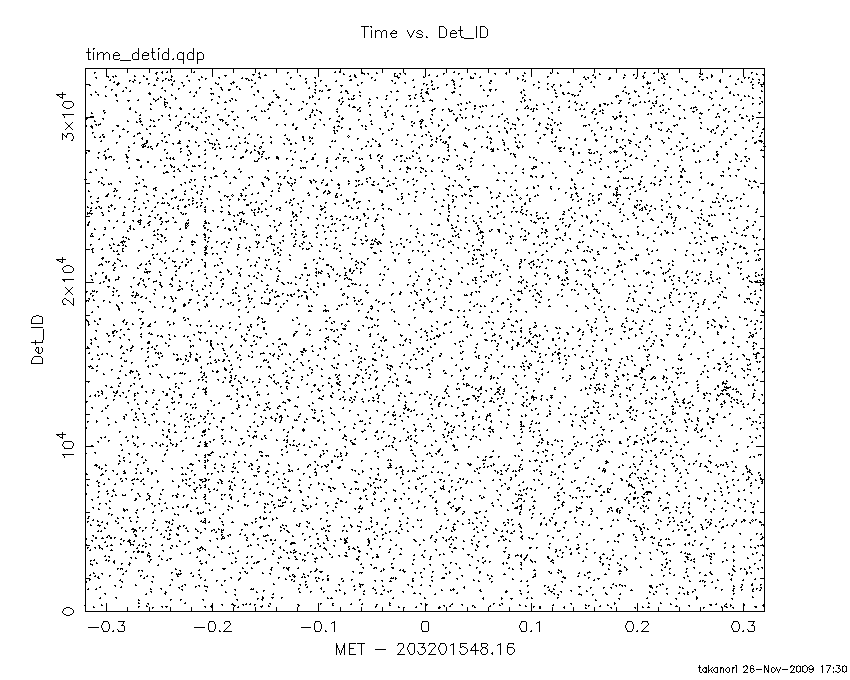
TIME vs. DetID plot around the trigger time
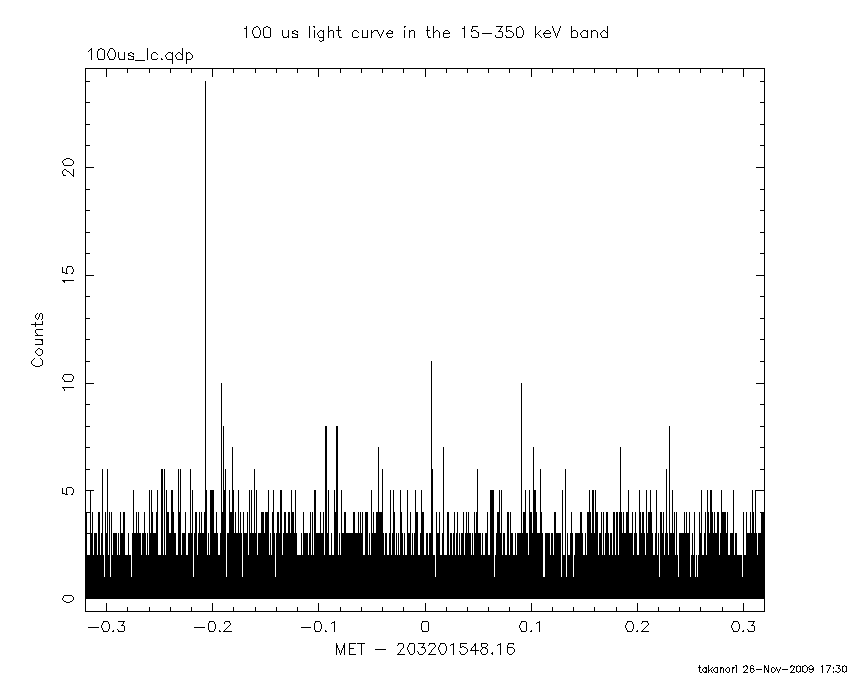
100 us light curve (15-350 keV)
Bright source in the pre-burst/pre-slew/post-slew images
Pre-burst image of 15-350 keV band
Time interval of the image is from -239.160 sec. to   -0.840 sec.

#   RAcent  DECcent POSerr  Theta    Phi     Peak Cts     SNR  Name
  299.5903 +35.2016 0.0000   21.5  129.8       5.0326    24.7  Cyg X-1
  308.1103 +40.9526 0.0000   14.2  146.3       1.8059    10.2  Cyg X-3
  326.1717 +38.3217 0.0000    0.1  113.7       0.3864     2.3  Cyg X-2
   21.2420 +26.9648 0.0750   47.0  -53.1       2.2835     2.6  UNKNOWN
  317.4883 +19.0521 0.0441   20.7   63.9       0.8628     4.3  UNKNOWN
  344.3851  -1.2874 0.0482   43.0   12.8       1.1892     3.9  UNKNOWN
  350.9599  +9.4803 0.0473   36.4   -4.1       0.9551     4.1  UNKNOWN
------------------------------------------
Pre-slew background subtracted image of 15-350 keV band
Time interval of the image is from   -0.840 sec. to    5.608 sec.

#   RAcent  DECcent POSerr  Theta    Phi     Peak Cts     SNR  Name
  299.5903 +35.2016 0.0000   21.5  129.8       0.0433     1.4  Cyg X-1
  308.1103 +40.9526 0.0000   14.2  146.3      -0.0211    -0.9  Cyg X-3
  326.1717 +38.3217 0.0000    0.1  113.7      -0.0022    -0.1  Cyg X-2
   23.2640 +58.2036 0.0403   41.2  -97.9       0.4986     4.8  UNKNOWN
  283.4755 +61.2741 0.0420   34.8 -174.9       0.1420     4.6  UNKNOWN
  298.7989 +26.2542 0.0147   26.0  110.4       0.4555    13.0  UNKNOWN
------------------------------------------
Post-slew image of 15-350 keV band
Time interval of the image is from  198.141 sec. to  962.903 sec.

#   RAcent  DECcent POSerr  Theta    Phi     Peak Cts     SNR  Name
  170.3158 -60.6230 0.0000   46.1   13.5       0.1143     0.2  Cen X-3
  186.6567 -62.7703 0.0000   45.0   24.7       1.8537     2.2  GX 301-2
   55.4385 -36.2228 0.0992   41.1  -98.0       5.0245     2.0  UNKNOWN
  103.0182 -76.7019 0.0528   21.6   -7.9       1.2205     3.7  UNKNOWN
  124.3059 -41.2946 0.0502   56.3  -28.4       9.1314     3.8  UNKNOWN
  256.6986 -61.5628 0.0660   40.1   70.8       3.9349     2.9  UNKNOWN
------------------------------------------


