Special notes of this burst
Image
Pre-slew 15.0-350.0 keV image (Event data)

#   RAcent    DECcent   POSerr    Theta     Phi              Peak Cts       SNR   Name
    2.0009   -29.7573   0.0171    42.9779  -167.2617         0.6837771     11.186 TRIG_00282003

Foreground time interval of the image:
 -8.416   7.584 (delta_t =  16.000 [sec])
Background time interval of the image:
-239.904  -8.416 (delta_t = 231.488 [sec])
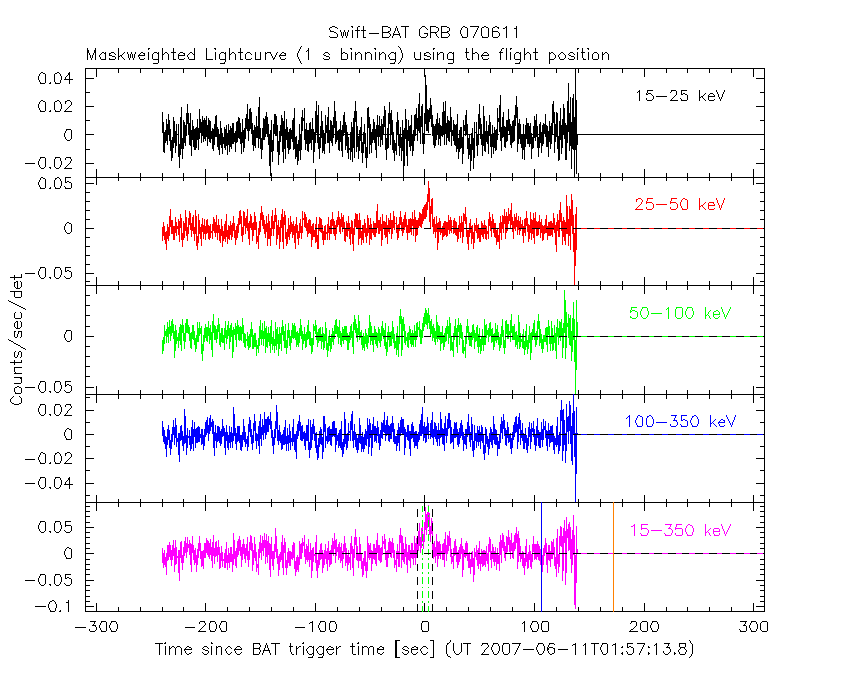
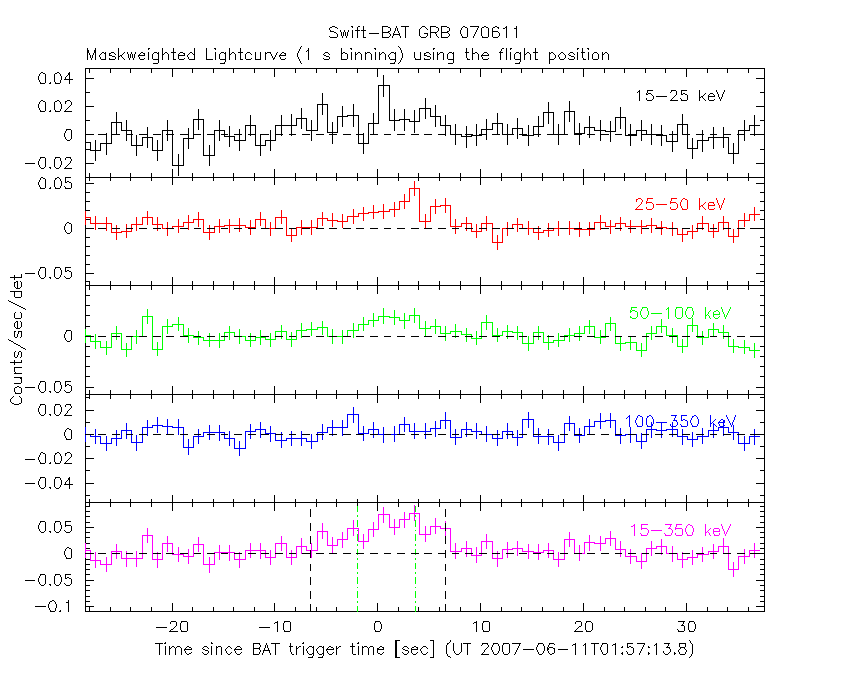
Lightcurves
Notes:
- 1) The mask-weighted light curves are using the flight position.
- 2) Multiple plots of different time binning/intervals are shown to cover all scenarios of short/long GRBs, rate/image triggers, and real/false positives.
- 3) For all the mask-weighted lightcurves, the y-axis units are counts/sec/det where a det is 0.4 x 0.4 = 0.16 sq cm.
- 4) The verticle lines correspond to following: green dotted lines are T50 interval, black dotted lines are T90 interval, blue solid line(s) is a spacecraft slew start time, and orange solid line(s) is a spacecraft slew end time.
- 5) Time of each bin is in the middle of the bin.
1 s binning
From T0-310 s to T0+310 s
From T100_start - 20 s to T100_end + 30 s
Full time interval

64 ms binning
Full time interval

From T100_start to T100_end

From T0-5 sec to T0+5 sec

16 ms binning
From T100_start-5 s to T100_start+5 s

Blue+Cyan dotted lines: Time interval of the scaled map
From 0.000000 to 4.096000
8 ms binning
From T100_start-3 s to T100_start+3 s

Blue+Cyan dotted lines: Time interval of the scaled map
From 0.000000 to 4.096000
2 ms binning
From T100_start-1 s to T100_start+1 s
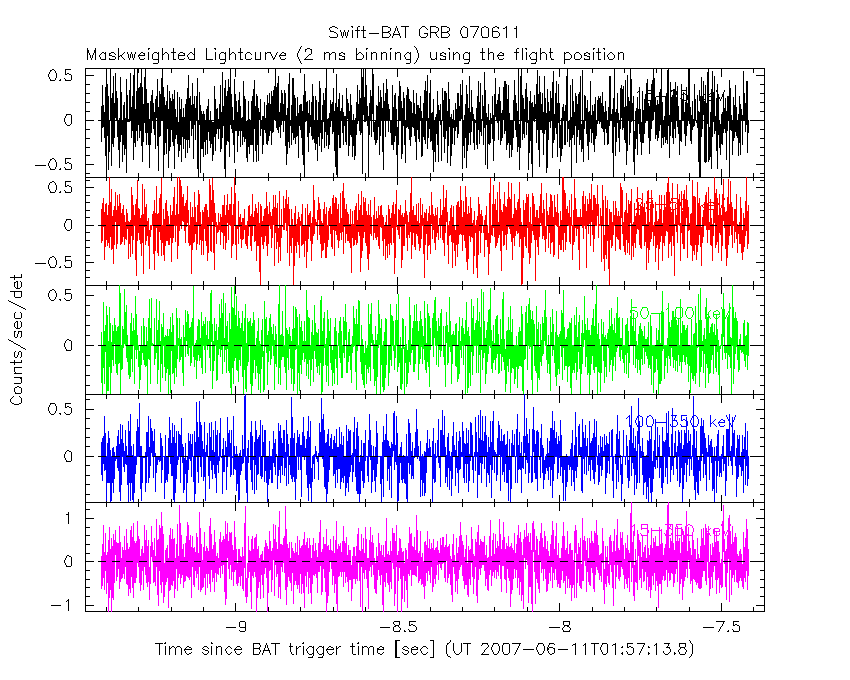
Blue+Cyan dotted lines: Time interval of the scaled map
From 0.000000 to 4.096000
SN=5 or 10 sec. binning (whichever binning is satisfied first)

SN=5 or 10 sec. binning (T < 200 sec)

Quad-rate summed light curves (from T0-300s to T0+1000s)

Spectral Evolution

Spectra
Notes:
- 1) The fitting includes the systematic errors.
- 2) When the burst includes telescope slew time periods, the fitting uses an average response file made from multiple 5-s response files through out the slew time plus single time preiod for the non-slew times, and weighted by the total counts in the corresponding time period using addrmf. An average response file is needed becuase a spectral fit using the pre-slew DRM will introduce some errors in both a spectral shape and a normalization if the PHA file contains a lot of the slew/post-slew time interval.
- 3) For fits to more complicated models (e.g. a power-law over a cutoff power-law), the BAT team has decided to require a chi-square improvement of more than 6 for each extra dof.
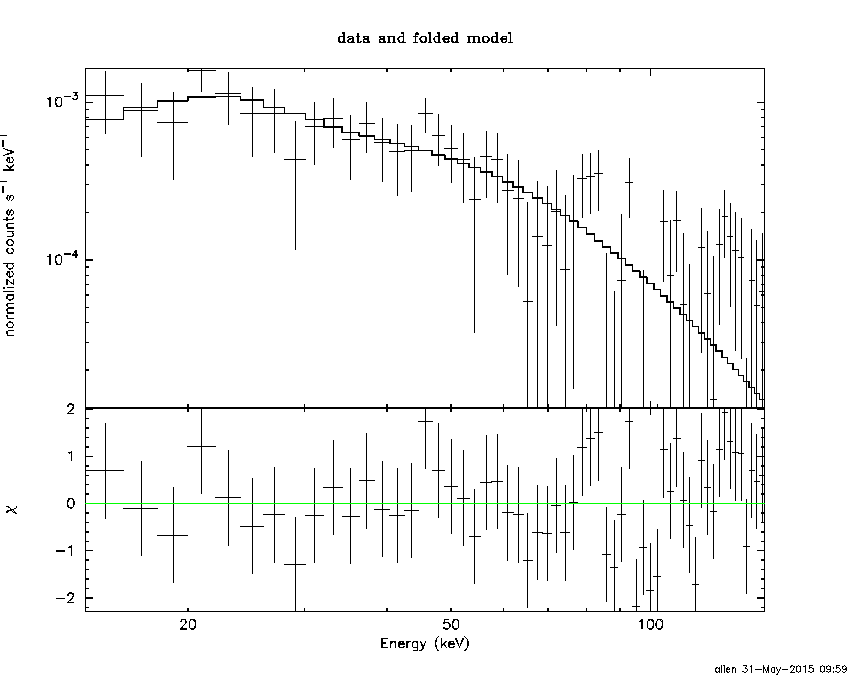
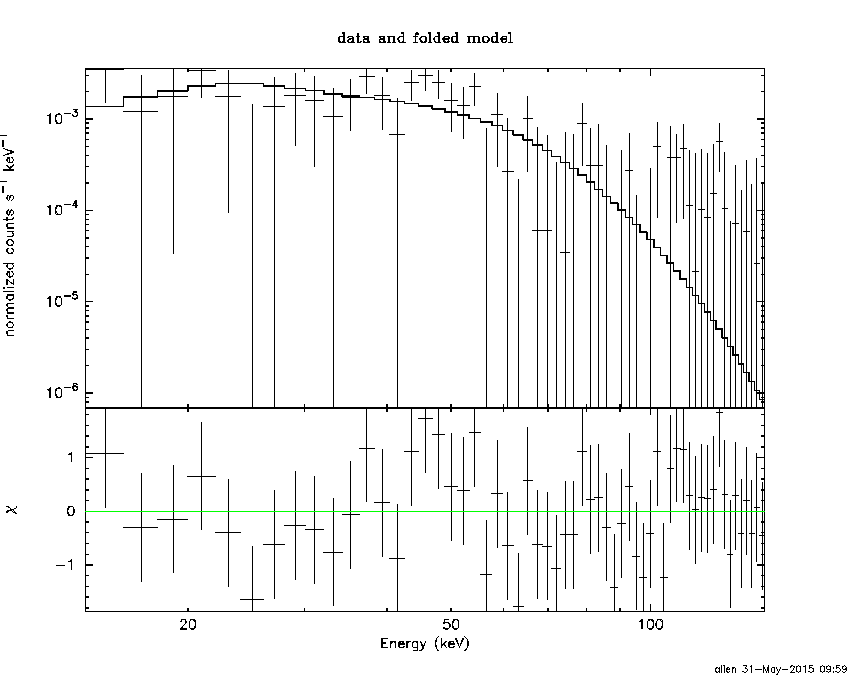
Time averaged spectrum fit using the average DRM
Power-law model

Time interval is from   -8.416 sec. to    7.584 sec.

Spectral model in power-law:
------------------------------------------------------------
Parameters  : value       lower 90%   higher 90%
Photon index: 1.66446     ( -0.23453   0.241775 )
Norm@50keV  : 2.70911E-03    ( -0.000401658   0.00039614 )
------------------------------------------------------------
#Fit statistic : Chi-Squared =          56.22 using 59 PHA bins.
# Reduced chi-squared =         0.9864 for     57 degrees of freedom
# Null hypothesis probability =   5.042203e-01

Photon flux (15-150 keV)    in 16 sec: 0.355449 ( -0.049983  0.0500706 ) ph/cm2/s
Energy fluence (15-150 keV)             : 4.02565e-07 ( -6.23822e-08  6.32387e-08 ) ergs/cm2
Cutoff power-law model

Time interval is from   -8.416 sec. to    7.584 sec.
Spectral model in the cutoff power-law:
------------------------------------------------------------
Parameters  : value       lower 90%   higher 90%
Photon index: 0.746592     ( -1.66528   1.02449 )
Epeak [keV] : 62.8686      ( -12.8883 -62.8318 )
Norm@50keV  : 8.44686E-03    ( -0.0084673   0.0576089 )
------------------------------------------------------------
#Fit statistic : Chi-Squared =          54.61 using 59 PHA bins.
# Reduced chi-squared =         0.9752 for     56 degrees of freedom
# Null hypothesis probability =   5.276111e-01

Photon flux (15-150 keV)    in 16 sec: 0.342901 ( -0.053859  0.053115 ) ph/cm2/s
Energy fluence (15-150 keV)             : 3.72523e-07 ( -7.27584e-08  7.52688e-08 ) ergs/cm2
Band function
Time interval is from   -8.416 sec. to    7.584 sec.

Spectral model in the Band function:
------------------------------------------------------------
Parameters  : value       lower 90%   higher 90%
alpha       : -0.305704   ( 0.274157   0.274157 )
beta        : -2.16350    ( 2.23062   0.623565 )
Epeak [keV] : 52.2524      ( -52.0262 75.7694 )
Norm@50keV   : 1.57430E-02    ( -0.0187655   93.0275 )
------------------------------------------------------------
#Fit statistic : Chi-Squared =          53.57 using 59 PHA bins.
# Reduced chi-squared =         0.9740 for     55 degrees of freedom
# Null hypothesis probability =   5.294473e-01

Photon flux (15-150 keV)    in 16 sec:  (    ) ph/cm2/s
Energy fluence (15-150 keV)             : 3.77979e-07 ( 0  0 ) ergs/cm2
Single BB

Spectral model blackbody:
------------------------------------------------------------
Parameters  : value    Lower 90%  Upper 90%
kT [keV]    : 12.7095  (-1.75268  2.08844)
R^2/D10^2   : 7.28329E-02  (-0.031408   0.0527731)
(R is the radius in km and D10 is the distance to the source in units of 10 kpc)
------------------------------------------------------------
#Fit statistic : Chi-Squared =          59.06 using 59 PHA bins.
# Reduced chi-squared =          1.036 for     57 degrees of freedom
# Null hypothesis probability =   4.001254e-01

Energy  Fluence     90% Error
[keV]   [erg/cm2]   [erg/cm2]
15- 25  3.992e-08   1.030e-08
25- 50  1.341e-07   2.450e-08
50-150  1.352e-07   3.936e-08
15-150  3.092e-07   5.576e-08
Thermal bremsstrahlung (OTTB)

Spectral model: thermal bremsstrahlung
------------------------------------------------------------
Parameters  : value         Lower 90%    Upper 90%
kT [keV]    : 140.860       (-61.4294      -138.93)
Norm        : 1.47684       (-0.229348     0.312782)
------------------------------------------------------------
#Fit statistic : Chi-Squared =          55.07 using 59 PHA bins.
# Reduced chi-squared =         0.9661 for     57 degrees of freedom
# Null hypothesis probability =   5.479257e-01

Energy  Fluence     90% Error
[keV]   [erg/cm2]   [erg/cm2]
15- 25  6.099e-08   3.423e-08
25- 50  1.120e-07   6.059e-08
50-150  2.152e-07   1.302e-07
15-150  3.882e-07   2.220e-07
Double BB

R1^2/D10^2  : 0.115319        (-0.055861      0.0923193)
kT2 [keV]   : 200.000        (      )
R2^2/D10^2  : 2.83572E-05    (-9.07177e-06   1.47304e-05)
------------------------------------------------------------
#Fit statistic : Chi-Squared =          55.61 using 59 PHA bins.
#Fit statistic : Chi-Squared =          52.03 using 59 PHA bins.
#Fit statistic : Chi-Squared =          51.93 using 59 PHA bins.
# Reduced chi-squared =          1.011 for     55 degrees of freedom
# Reduced chi-squared =         0.9460 for     55 degrees of freedom
# Reduced chi-squared =         0.9442 for     55 degrees of freedom
# Null hypothesis probability =   4.518116e-01
# Null hypothesis probability =   5.889084e-01
# Null hypothesis probability =   5.925314e-01

Energy  Fluence     90% Error
[keV]   [erg/cm2]   [erg/cm2]
15- 25  5.628e-08   2.551e-08
25- 50  1.206e-07   4.601e-08
50-150  1.575e-07   7.397e-08
15-150  3.344e-07   1.515e-07
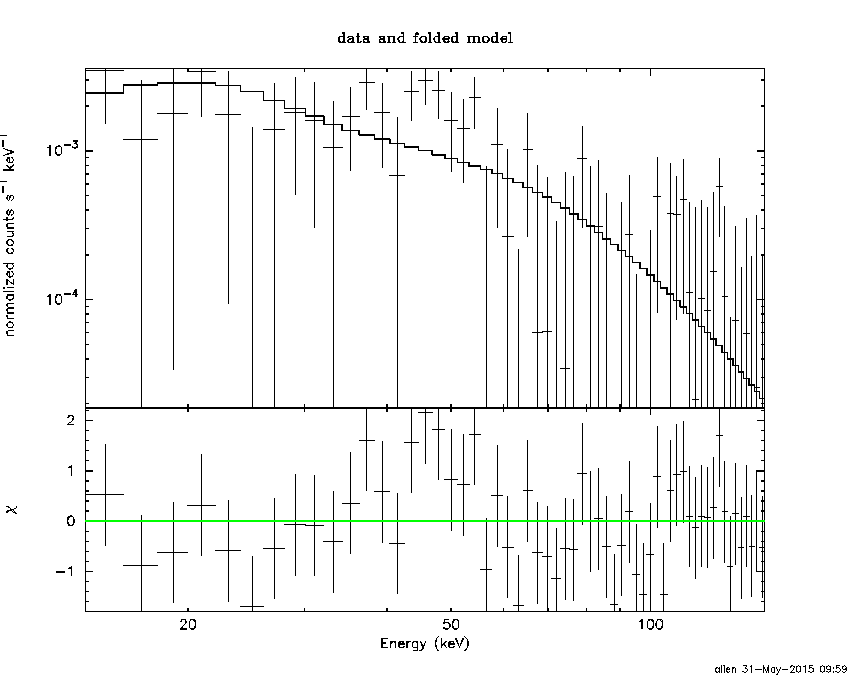
Peak spectrum fit
Power-law model

Time interval is from    2.764 sec. to    3.764 sec.

Spectral model in power-law:
------------------------------------------------------------
Parameters  : value       lower 90%   higher 90%
Photon index: 1.76010     ( -0.388396   0.418114 )
Norm@50keV  : 5.89746E-03    ( -0.00161797   0.00158543 )
------------------------------------------------------------
#Fit statistic : Chi-Squared =          50.05 using 59 PHA bins.
# Reduced chi-squared =         0.8781 for     57 degrees of freedom
# Null hypothesis probability =   7.311864e-01

Photon flux (15-150 keV)    in 1 sec: 0.800448 ( -0.203307  0.203962 ) ph/cm2/s
Energy fluence (15-150 keV)             : 5.43829e-08 ( -1.4959e-08  1.53542e-08 ) ergs/cm2
Cutoff power-law model

Time interval is from    2.764 sec. to    3.764 sec.
Spectral model in the cutoff power-law:
------------------------------------------------------------
Parameters  : value       lower 90%   higher 90%
Photon index: -9.98586     (     )
Epeak [keV] : 45.6085      ( -4.23119 4.48721 )
Norm@50keV  : 6438.65    ( -6586.92   14283.2 )
------------------------------------------------------------
#Fit statistic : Chi-Squared =          37.34 using 59 PHA bins.
# Reduced chi-squared =         0.6667 for     56 degrees of freedom
# Null hypothesis probability =   9.740802e-01

Photon flux (15-150 keV)    in 1 sec: 0.592024 ( -0.132456  0.176323 ) ph/cm2/s
Energy fluence (15-150 keV)             : 3.94822e-08 ( -8.8036e-09  1.01469e-08 ) ergs/cm2
Band function

Time interval is from    2.764 sec. to    3.764 sec.

Spectral model in the Band function:
------------------------------------------------------------
Parameters  : value       lower 90%   higher 90%
alpha       : 4.98824   ( -3.28499   -4.98824 )
beta        : -5.68417    ( 5.68417   6.80255 )
Epeak [keV] : 45.7884      ( -5.43644 6.25472 )
Norm@50keV   : 22.4789    ( -5.02297   29.8114 )
------------------------------------------------------------
#Fit statistic : Chi-Squared =          38.89 using 59 PHA bins.
# Reduced chi-squared =         0.7071 for     55 degrees of freedom
# Null hypothesis probability =   9.508432e-01

Photon flux (15-150 keV)    in 1 sec:  (    ) ph/cm2/s
Energy fluence (15-150 keV)             : 4.48267e-08 ( 0  0 ) ergs/cm2
Single BB
Spectral model blackbody:
------------------------------------------------------------
Parameters  : value    Lower 90%  Upper 90%
kT [keV]    : 12.1276  (-2.05436  2.59998)
R^2/D10^2   : 0.213675  (-0.113361   0.213149)
(R is the radius in km and D10 is the distance to the source in units of 10 kpc)
------------------------------------------------------------
#Fit statistic : Chi-Squared =          41.74 using 59 PHA bins.
# Reduced chi-squared =         0.7323 for     57 degrees of freedom
# Null hypothesis probability =   9.354158e-01

Energy  Fluence     90% Error
[keV]   [erg/cm2]   [erg/cm2]
15- 25  6.652e-09   2.867e-09
25- 50  2.120e-08   8.012e-09
50-150  1.888e-08   9.711e-09
15-150  4.673e-08   1.640e-08
Thermal bremsstrahlung (OTTB)
Spectral model: thermal bremsstrahlung
------------------------------------------------------------
Parameters  : value         Lower 90%    Upper 90%
kT [keV]    : 94.3163       (-46.4884      -94.3163)
Norm        : 3.70244       (-1.04961     1.49831)
------------------------------------------------------------
#Fit statistic : Chi-Squared =          48.05 using 59 PHA bins.
# Reduced chi-squared =         0.8430 for     57 degrees of freedom
# Null hypothesis probability =   7.947549e-01

Energy  Fluence     90% Error
[keV]   [erg/cm2]   [erg/cm2]
15- 25  9.671e-09   4.367e-09
25- 50  1.652e-08   9.810e-09
50-150  2.588e-08   2.085e-08
15-150  5.208e-08   3.312e-08
Double BB

------------------------------------------------------------
Parameters  : value         Lower 90%    Upper 90%
kT1 [keV]   : 0.400210        (-0.485333      2.11303)
R1^2/D10^2  : 7.26078E+13        (      )
kT2 [keV]   : 12.3027        (-2.09897      2.68384)
R2^2/D10^2  : 0.199748    (-0.107349   0.160713)
------------------------------------------------------------
#Fit statistic : Chi-Squared =          40.59 using 59 PHA bins.
#Fit statistic : Chi-Squared =          40.57 using 59 PHA bins.
# Reduced chi-squared =         0.7379 for     55 degrees of freedom
# Reduced chi-squared =         0.7376 for     55 degrees of freedom
# Null hypothesis probability =   9.267021e-01
# Null hypothesis probability =   9.270049e-01

Energy  Fluence     90% Error
[keV]   [erg/cm2]   [erg/cm2]
15- 25  6.447e-09   3.146e-09
25- 50  2.074e-08   9.144e-09
50-150  1.920e-08   1.034e-08
15-150  4.639e-08   1.865e-08
Pre-slew spectrum (Pre-slew PHA with pre-slew DRM)
Power-law model

Spectral model in power-law:
------------------------------------------------------------
Parameters  : value       lower 90%   higher 90%
Photon index: 1.66446     ( -0.23453   0.241775 )
Norm@50keV  : 2.70911E-03    ( -0.000401658   0.00039614 )
------------------------------------------------------------
#Fit statistic : Chi-Squared =          56.22 using 59 PHA bins.
# Reduced chi-squared =         0.9864 for     57 degrees of freedom
# Null hypothesis probability =   5.042203e-01

Photon flux (15-150 keV)    in 16 sec: 0.355449 ( -0.049983  0.0500706 ) ph/cm2/s
Energy fluence (15-150 keV)             : 4.02565e-07 ( -6.23822e-08  6.32387e-08 ) ergs/cm2
Cutoff power-law model

Spectral model in the cutoff power-law:
------------------------------------------------------------
Parameters  : value       lower 90%   higher 90%
Photon index: 0.746592     ( -1.66528   1.02449 )
Epeak [keV] : 62.8686      ( -12.8883 -62.8318 )
Norm@50keV  : 8.44686E-03    ( -0.0084673   0.0576089 )
------------------------------------------------------------
#Fit statistic : Chi-Squared =          54.61 using 59 PHA bins.
# Reduced chi-squared =         0.9752 for     56 degrees of freedom
# Null hypothesis probability =   5.276111e-01

Photon flux (15-150 keV)    in 16 sec: 0.342901 ( -0.053859  0.053115 ) ph/cm2/s
Energy fluence (15-150 keV)             : 3.72523e-07 ( -7.27584e-08  7.52688e-08 ) ergs/cm2
Band function

Spectral model in the Band function:
------------------------------------------------------------
Parameters  : value       lower 90%   higher 90%
alpha       : -0.305704   ( 0.274157   0.274157 )
beta        : -2.16350    ( 2.23062   0.623565 )
Epeak [keV] : 52.2524      ( -52.0262 75.7694 )
Norm@50keV   : 1.57430E-02    ( -0.0187655   126.373 )
------------------------------------------------------------
#Fit statistic : Chi-Squared =          53.57 using 59 PHA bins.
# Reduced chi-squared =         0.9740 for     55 degrees of freedom
# Null hypothesis probability =   5.294473e-01

Photon flux (15-150 keV)    in 16 sec:  (    ) ph/cm2/s
Energy fluence (15-150 keV)             : 3.77979e-07 ( 0  0 ) ergs/cm2
S(25-50 keV) vs. S(50-100 keV) plot

S(25-50 keV)  = 1.07e-07
S(50-100 keV) = 1.35e-07
T90 vs. Hardness ratio plot

T90                                   = 13.1839999854565 sec.
Hardness ratio (energy fluence ratio) = 1.26168
Color vs. Color plot

Count Ratio  (25-50 keV) / (15-25 keV) = 1.43579
Count Ratio (50-100 keV) / (15-25 keV) = 0.83611
Mask shadow pattern

IMX = -9.088612587177003E-01, IMY = 2.054589843588912E-01
TIME vs. PHA plot around the trigger time

Blue+Cyan dotted lines: Time interval of the scaled map
From 0.000000 to 4.096000
TIME vs. DetID plot around the trigger time

Blue+Cyan dotted lines: Time interval of the scaled map
From 0.000000 to 4.096000
100 us light curve (15-350 keV)

Blue+Cyan dotted lines: Time interval of the scaled map
From 0.000000 to 4.096000
Spacecraft aspect plot

Bright source in the pre-burst/pre-slew/post-slew images
Pre-burst image of 15-350 keV band
Time interval of the image:
-239.904000 -8.416000

# RAcent  DECcent POSerr Theta    Phi  PeakCts   SNR AngSep     Name
#  [deg]    [deg]    ['] [deg]  [deg]                   [']
170.0742 -60.5499   12.8  46.2   13.3   0.3043   0.9    8.4	Cen X-3
186.6272 -62.7515    3.8  45.0   24.6   1.1556   3.0    1.4	GX 301-2
  1.1209 -13.6410    2.9  59.1 -166.2   4.2603   4.0 ------	UNKNOWN
Pre-slew background subtracted image of 15-350 keV band
Time interval of the image:
-8.416000 7.584000

# RAcent  DECcent POSerr Theta    Phi  PeakCts   SNR AngSep     Name
#  [deg]    [deg]    ['] [deg]  [deg]                   [']
170.5577 -60.6914    3.8  46.1   13.7   0.2522   3.0    8.2	Cen X-3
186.7375 -62.7900    8.7  45.0   24.7   0.1170   1.3    2.5	GX 301-2
 54.3333 -68.0926    2.2  13.4  -57.5   0.1754   5.3 ------	UNKNOWN
  2.0009 -29.7573    1.0  43.0 -167.3   0.6838  11.2 ------	UNKNOWN
Post-slew image of 15-350 keV band
Time interval of the image:
171.796590 962.147500

# RAcent  DECcent POSerr Theta    Phi  PeakCts   SNR AngSep     Name
#  [deg]    [deg]    ['] [deg]  [deg]                   [']
135.5674 -40.5409    2.4  41.7  -54.8   6.7109   4.8    2.0	Vela X-1
170.2089 -60.7357    8.5  13.2  -38.3   0.5429   1.4    7.5	Cen X-3
186.6616 -62.7639    0.3   7.2   -6.1  13.7925  33.9    0.4	GX 301-2
299.5212 -53.1672    2.1  46.1  149.8   6.1484   5.4 ------	UNKNOWN
231.5846 -72.2980    2.9  12.4  144.2   1.5677   3.9 ------	UNKNOWN
177.4232 -49.3341    3.5  21.6   -7.9   1.3539   3.3 ------	UNKNOWN
  1.4679 -51.2779    4.5  59.1 -166.2   7.7752   2.6 ------	UNKNOWN
131.1149 -61.9045    3.9  25.8  -81.9   1.6940   3.0 ------	UNKNOWN
 98.9291 -55.7147    4.8  41.1  -98.2   6.7751   2.5 ------	UNKNOWN
Plot creation:
Sun May 31 10:00:45 EDT 2015