Click here for the BAT GCN circular template
Image
Pre-slew 15.0-350.0 keV image (Event data)
#   RAcent    DECcent   POSerr    Theta     Phi              Peak Cts       SNR   Name
  121.3528    37.2630   0.0098    39.9715  -108.5032        19.3648902     19.689 TRIG_00282066

Foreground time interval of the image:
 -4.696 417.864 (delta_t = 422.560 [sec])
Background time interval of the image:
-239.000  -4.696 (delta_t = 234.304 [sec])
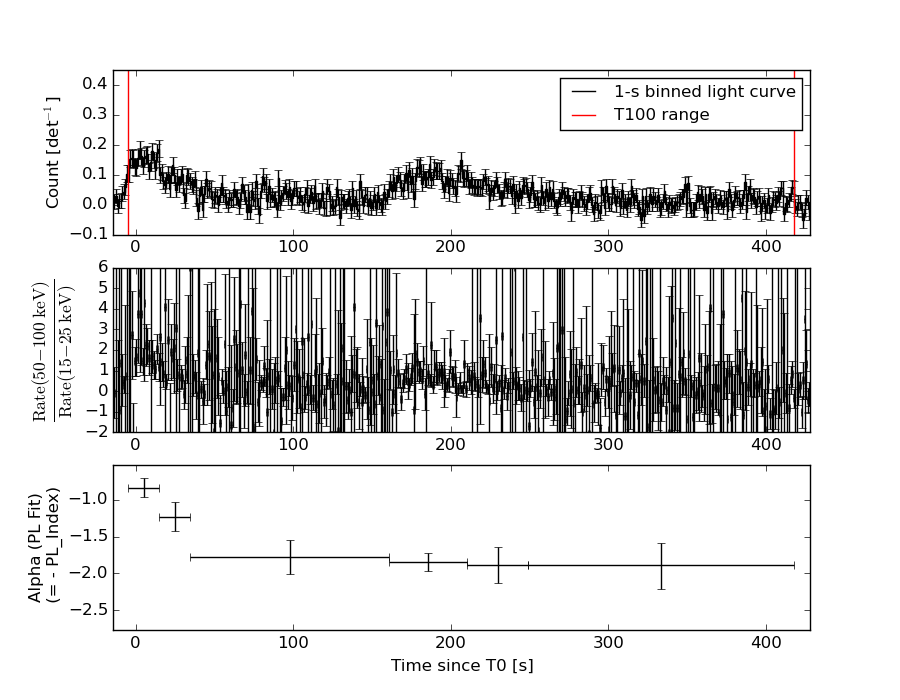
Lightcurves
Notes:
- 1) The mask-weighted light curves are using the flight position.
- 2) Multiple plots of different time binning/intervals are shown to cover all scenarios of short/long GRBs, rate/image triggers, and real/false positives.
- 3) For all the mask-weighted lightcurves, the y-axis units are counts/sec/det where a det is 0.4 x 0.4 = 0.16 sq cm.
- 4) The verticle lines correspond to following: green dotted lines are T50 interval, black dotted lines are T90 interval, blue solid line(s) is a spacecraft slew start time, and orange solid line(s) is a spacecraft slew end time.
- 5) Time of each bin is in the middle of the bin.
1 s binning
From T0-310 s to T0+310 s
From T100_start - 20 s to T100_end + 30 s
Full time interval
64 ms binning
Full time interval
From T100_start to T100_end
From T0-5 sec to T0+5 sec
16 ms binning
From T100_start-5 s to T100_start+5 s
Blue+Cyan dotted lines: Time interval of the scaled map
From 0.000000 to 64.000000
8 ms binning
From T100_start-3 s to T100_start+3 s
Blue+Cyan dotted lines: Time interval of the scaled map
From 0.000000 to 64.000000
2 ms binning
From T100_start-1 s to T100_start+1 s
Blue+Cyan dotted lines: Time interval of the scaled map
From 0.000000 to 64.000000
SN=5 or 10 sec. binning (whichever binning is satisfied first)
SN=5 or 10 sec. binning (T < 200 sec)
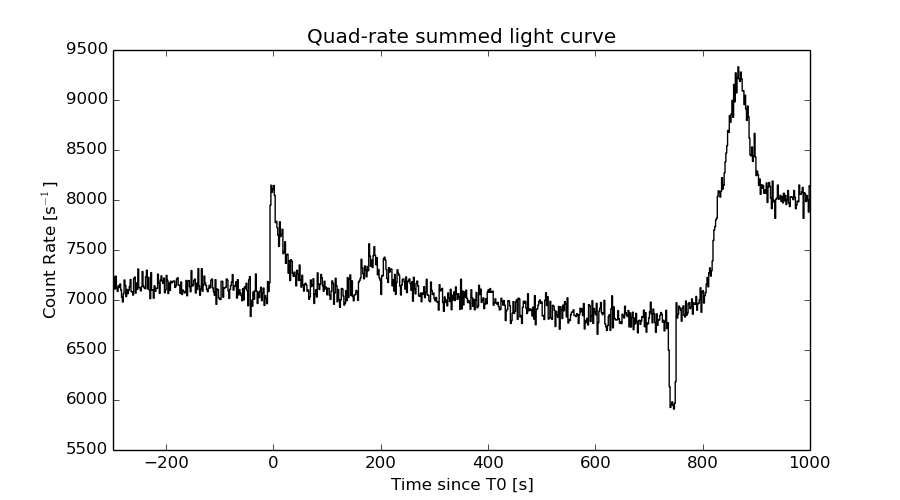
Quad-rate summed light curves (from T0-300s to T0+1000s)
Spectral Evolution
Spectra
Notes:
- 1) The fitting includes the systematic errors.
- 2) When the burst includes telescope slew time periods, the fitting uses an average response file made from multiple 5-s response files through out the slew time plus single time preiod for the non-slew times, and weighted by the total counts in the corresponding time period using addrmf. An average response file is needed becuase a spectral fit using the pre-slew DRM will introduce some errors in both a spectral shape and a normalization if the PHA file contains a lot of the slew/post-slew time interval.
- 3) For fits to more complicated models (e.g. a power-law over a cutoff power-law), the BAT team has decided to require a chi-square improvement of more than 6 for each extra dof.
Time averaged spectrum fit using the average DRM
Power-law model

Time interval is from   -4.696 sec. to  417.864 sec.

Spectral model in power-law:
------------------------------------------------------------
Parameters  : value       lower 90%   higher 90%
Photon index: 1.63995     ( -0.0915319   0.0920371 )
Norm@50keV  : 2.75173E-03    ( -0.000145791   0.000145314 )
------------------------------------------------------------
#Fit statistic : Chi-Squared =          47.69 using 59 PHA bins.
# Reduced chi-squared =         0.8367 for     57 degrees of freedom
# Null hypothesis probability =   8.053735e-01

Photon flux (15-150 keV)    in 422.6 sec: 0.358128 ( -0.0191716  0.0192051 ) ph/cm2/s
Energy fluence (15-150 keV)             : 1.08264e-05 ( -6.06477e-07  6.08975e-07 ) ergs/cm2
Cutoff power-law model
Time interval is from   -4.696 sec. to  417.864 sec.
Spectral model in the cutoff power-law:
------------------------------------------------------------
Parameters  : value       lower 90%   higher 90%
Photon index: 1.43918     ( -0.357111   0.248206 )
Epeak [keV] : 137.694      (   )
Norm@50keV  : 3.48654E-03    (     )
------------------------------------------------------------
#Fit statistic : Chi-Squared =          46.63 using 59 PHA bins.
# Reduced chi-squared =         0.8327 for     56 degrees of freedom
# Null hypothesis probability =   8.095078e-01

Photon flux (15-150 keV)    in 422.6 sec: 0.354543 ( -0.020022  0.020029 ) ph/cm2/s
Energy fluence (15-150 keV)             : 1.0663e-05 ( -6.72399e-07  6.67793e-07 ) ergs/cm2
Band function

Time interval is from   -4.696 sec. to  417.864 sec.

Spectral model in the Band function:
------------------------------------------------------------
Parameters  : value       lower 90%   higher 90%
alpha       : 4.96006   ( -4.67666   -4.96006 )
beta        : -1.73841    ( -0.12122   0.106329 )
Epeak [keV] : 24.6647      ( -3.06101 2.6627 )
Norm@50keV   : 333.766    ( -16.9831   616.893 )
------------------------------------------------------------
#Fit statistic : Chi-Squared =          39.47 using 59 PHA bins.
# Reduced chi-squared =         0.7177 for     55 degrees of freedom
# Null hypothesis probability =   9.433056e-01

Photon flux (15-150 keV)    in 422.6 sec:  (    ) ph/cm2/s
Energy fluence (15-150 keV)             : 0 ( 0  0 ) ergs/cm2
Single BB
Spectral model blackbody:
------------------------------------------------------------
Parameters  : value    Lower 90%  Upper 90%
kT [keV]    : 13.8300  (  )
R^2/D10^2   : 5.12549E-02  (   )
(R is the radius in km and D10 is the distance to the source in units of 10 kpc)
------------------------------------------------------------
#Fit statistic : Chi-Squared =         146.51 using 59 PHA bins.
# Reduced chi-squared =         2.5704 for     57 degrees of freedom
# Null hypothesis probability =   8.112258e-10

Energy  Fluence     90% Error
[keV]   [erg/cm2]   [erg/cm2]
15- 25  8.761e-07   8.431e-08
25- 50  3.219e-06   2.227e-07
50-150  4.028e-06   4.116e-07
15-150  8.123e-06   5.135e-07
Thermal bremsstrahlung (OTTB)
Spectral model: thermal bremsstrahlung
------------------------------------------------------------
Parameters  : value         Lower 90%    Upper 90%
kT [keV]    : 160.469       (-35.8651      -160.274)
Norm        : 1.46664       (-0.0881944     0.0976521)
------------------------------------------------------------
#Fit statistic : Chi-Squared =          47.10 using 59 PHA bins.
# Reduced chi-squared =         0.8263 for     57 degrees of freedom
# Null hypothesis probability =   8.221817e-01

Energy  Fluence     90% Error
[keV]   [erg/cm2]   [erg/cm2]
15- 25  1.582e-06   1.204e-07
25- 50  2.961e-06   2.681e-07
50-150  6.005e-06   1.935e-06
15-150  1.055e-05   2.371e-06
Double BB
Spectral model: bbodyrad<1> + bbodyrad<2>
------------------------------------------------------------
Parameters  : value         Lower 90%    Upper 90%
kT1 [keV]   : 6.98492        (-0.941788      1.04978)
R1^2/D10^2  : 0.428672        (-0.16357      0.28926)
kT2 [keV]   : 27.4229        (-4.39541      6.88303)
R2^2/D10^2  : 3.42154E-03    (-0.00183511   0.003182)
------------------------------------------------------------
#Fit statistic : Chi-Squared =          41.75 using 59 PHA bins.
# Reduced chi-squared =         0.7591 for     55 degrees of freedom
# Null hypothesis probability =   9.060988e-01

Energy  Fluence     90% Error
[keV]   [erg/cm2]   [erg/cm2]
15- 25  1.596e-06   2.715e-07
25- 50  2.997e-06   4.192e-07
50-150  6.143e-06   1.531e-06
15-150  1.074e-05   1.794e-06
Peak spectrum fit
Power-law model

Time interval is from    2.620 sec. to    3.620 sec.

Spectral model in power-law:
------------------------------------------------------------
Parameters  : value       lower 90%   higher 90%
Photon index: 0.616839     ( -0.486739   0.419424 )
Norm@50keV  : 1.17333E-02    ( -0.00346556   0.00325317 )
------------------------------------------------------------
#Fit statistic : Chi-Squared =          47.69 using 59 PHA bins.
# Reduced chi-squared =         0.8367 for     57 degrees of freedom
# Null hypothesis probability =   8.053777e-01

Photon flux (15-150 keV)    in 1 sec: 1.36721 ( -0.345462  0.35457 ) ph/cm2/s
Energy fluence (15-150 keV)             : 1.48844e-07 ( -3.35724e-08  3.35963e-08 ) ergs/cm2
Cutoff power-law model
Time interval is from    2.620 sec. to    3.620 sec.
Spectral model in the cutoff power-law:
------------------------------------------------------------
Parameters  : value       lower 90%   higher 90%
Photon index: -1.39551E-02     ( -4.29074   0.946137 )
Epeak [keV] : 231.963      ( -337.035 -337.035 )
Norm@50keV  : 1.89414E-02    (     )
------------------------------------------------------------
#Fit statistic : Chi-Squared =          47.43 using 59 PHA bins.
# Reduced chi-squared =         0.8470 for     56 degrees of freedom
# Null hypothesis probability =   7.855515e-01

Photon flux (15-150 keV)    in 1 sec: 1.32628 ( -0.370963  0.18896 ) ph/cm2/s
Energy fluence (15-150 keV)             : 1.48595e-07 ( -3.4206e-08  3.3885e-08 ) ergs/cm2
Band function

Time interval is from    2.620 sec. to    3.620 sec.

Spectral model in the Band function:
------------------------------------------------------------
Parameters  : value       lower 90%   higher 90%
alpha       : -0.845395   ( 0.845395   0.845395 )
beta        : -0.616840    ( -0.419434   0.48636 )
Epeak [keV] : 18.8119      ( -18.8119 -18.8119 )
Norm@50keV   : 1.58619E-02    ( -0.00729474   142328 )
------------------------------------------------------------
#Fit statistic : Chi-Squared =          47.69 using 59 PHA bins.
# Reduced chi-squared =         0.8671 for     55 degrees of freedom
# Null hypothesis probability =   7.472871e-01

Photon flux (15-150 keV)    in 1 sec:  (    ) ph/cm2/s
Energy fluence (15-150 keV)             : 0 ( 0  0 ) ergs/cm2
Single BB
Spectral model blackbody:
------------------------------------------------------------
Parameters  : value    Lower 90%  Upper 90%
kT [keV]    : 33.0912  (-8.67543  16.7306)
R^2/D10^2   : 1.65144E-02  (-0.0109729   0.0237353)
(R is the radius in km and D10 is the distance to the source in units of 10 kpc)
------------------------------------------------------------
#Fit statistic : Chi-Squared =          47.92 using 59 PHA bins.
# Reduced chi-squared =         0.8406 for     57 degrees of freedom
# Null hypothesis probability =   7.988050e-01

Energy  Fluence     90% Error
[keV]   [erg/cm2]   [erg/cm2]
15- 25  2.658e-09   1.384e-09
25- 50  1.704e-08   8.739e-09
50-150  1.260e-07   6.396e-08
15-150  1.457e-07   7.425e-08
Thermal bremsstrahlung (OTTB)
Spectral model: thermal bremsstrahlung
------------------------------------------------------------
Parameters  : value         Lower 90%    Upper 90%
kT [keV]    : 200.000       (      )
Norm        : 5.78742       (-1.50159     1.50122)
------------------------------------------------------------
#Fit statistic : Chi-Squared =          61.64 using 59 PHA bins.
# Reduced chi-squared =          1.081 for     57 degrees of freedom
# Null hypothesis probability =   3.137791e-01

Energy  Fluence     90% Error
[keV]   [erg/cm2]   [erg/cm2]
15- 25  1.441e-08   8.670e-09
25- 50  2.772e-08   1.662e-08
50-150  6.079e-08   3.700e-08
15-150  1.029e-07   6.265e-08
Double BB
Spectral model: bbodyrad<1> + bbodyrad<2>
------------------------------------------------------------
Parameters  : value         Lower 90%    Upper 90%
kT1 [keV]   : 5.35621        (-5.14968      -5.14968)
R1^2/D10^2  : 1.39029        (-2.28368      37.5886)
kT2 [keV]   : 36.1678        (-10.5228      -36.2413)
R2^2/D10^2  : 1.24579E-02    (-0.0124786   0.0191238)
------------------------------------------------------------
#Fit statistic : Chi-Squared =          46.65 using 59 PHA bins.
# Reduced chi-squared =         0.8482 for     55 degrees of freedom
# Null hypothesis probability =   7.810061e-01

Energy  Fluence     90% Error
[keV]   [erg/cm2]   [erg/cm2]
15- 25  6.675e-09   4.619e-09
25- 50  1.832e-08   1.010e-08
50-150  1.253e-07   7.335e-08
15-150  1.503e-07   8.300e-08
Pre-slew spectrum (Pre-slew PHA with pre-slew DRM)
Power-law model
Spectral model in power-law:
------------------------------------------------------------
Parameters  : value       lower 90%   higher 90%
Photon index: 1.63995     ( -0.0915319   0.0920371 )
Norm@50keV  : 2.75173E-03    ( -0.000145791   0.000145314 )
------------------------------------------------------------
#Fit statistic : Chi-Squared =          47.69 using 59 PHA bins.
# Reduced chi-squared =         0.8367 for     57 degrees of freedom
# Null hypothesis probability =   8.053735e-01

Photon flux (15-150 keV)    in 422.6 sec: 0.358128 ( -0.0191716  0.0192051 ) ph/cm2/s
Energy fluence (15-150 keV)             : 1.08264e-05 ( -6.06477e-07  6.08975e-07 ) ergs/cm2
Cutoff power-law model

Spectral model in the cutoff power-law:
------------------------------------------------------------
Parameters  : value       lower 90%   higher 90%
Photon index: 1.43918     ( -0.357111   0.248206 )
Epeak [keV] : 137.694      (   )
Norm@50keV  : 3.48654E-03    (     )
------------------------------------------------------------
#Fit statistic : Chi-Squared =          46.63 using 59 PHA bins.
# Reduced chi-squared =         0.8327 for     56 degrees of freedom
# Null hypothesis probability =   8.095078e-01

Photon flux (15-150 keV)    in 422.6 sec: 0.354543 ( -0.020022  0.020029 ) ph/cm2/s
Energy fluence (15-150 keV)             : 1.0663e-05 ( -6.72399e-07  6.67793e-07 ) ergs/cm2
Band function
Spectral model in the Band function:
------------------------------------------------------------
Parameters  : value       lower 90%   higher 90%
alpha       : 4.96006   ( -4.67666   -4.96006 )
beta        : -1.73841    ( -0.12122   0.106329 )
Epeak [keV] : 24.6647      ( -3.06101 2.6627 )
Norm@50keV   : 333.766    ( -16.9831   616.893 )
------------------------------------------------------------
#Fit statistic : Chi-Squared =          39.47 using 59 PHA bins.
# Reduced chi-squared =         0.7177 for     55 degrees of freedom
# Null hypothesis probability =   9.433056e-01

Photon flux (15-150 keV)    in 422.6 sec:  (    ) ph/cm2/s
Energy fluence (15-150 keV)             : 0 ( 0  0 ) ergs/cm2
S(25-50 keV) vs. S(50-100 keV) plot
S(25-50 keV)  = 2.86e-06
S(50-100 keV) = 3.67e-06
T90 vs. Hardness ratio plot
T90                                   = 365.27999997139 sec.
Hardness ratio (energy fluence ratio) = 1.28322
Color vs. Color plot

Count Ratio  (25-50 keV) / (15-25 keV) = 1.29907
Count Ratio (50-100 keV) / (15-25 keV) = 0.969134
Mask shadow pattern
IMX = -2.660250002177185E-01, IMY = 7.949191657710479E-01
TIME vs. PHA plot around the trigger time
Blue+Cyan dotted lines: Time interval of the scaled map
From 0.000000 to 64.000000
TIME vs. DetID plot around the trigger time
Blue+Cyan dotted lines: Time interval of the scaled map
From 0.000000 to 64.000000
100 us light curve (15-350 keV)
Blue+Cyan dotted lines: Time interval of the scaled map
From 0.000000 to 64.000000
Spacecraft aspect plot

Bright source in the pre-burst/pre-slew/post-slew images
Pre-burst image of 15-350 keV band
Time interval of the image:
-239.000000 -4.696000

# RAcent  DECcent POSerr Theta    Phi  PeakCts   SNR AngSep     Name
#  [deg]    [deg]    ['] [deg]  [deg]                   [']
211.8144  28.4434    2.1  35.9   97.9   1.9517   5.5 ------	UNKNOWN
276.8477  63.6733    2.5  49.4   16.2   2.0630   4.6 ------	UNKNOWN
171.2249  -0.4899    2.9  52.6  166.2   2.3368   4.0 ------	UNKNOWN
201.8755  50.2013    2.7  16.8   66.8   0.7206   4.3 ------	UNKNOWN
114.8842  41.8789    3.8  41.1  -98.2   2.6255   3.1 ------	UNKNOWN
Pre-slew background subtracted image of 15-350 keV band
Time interval of the image:
-4.696000 417.864000

# RAcent  DECcent POSerr Theta    Phi  PeakCts   SNR AngSep     Name
#  [deg]    [deg]    ['] [deg]  [deg]                   [']
136.7430  43.0152    2.5  27.1 -112.7   1.9277   4.6 ------	UNKNOWN
 58.1749  70.2846    2.9  49.6  -42.0   5.1622   4.0 ------	UNKNOWN
121.3529  37.2631    0.6  40.0 -108.5  19.3673  19.7 ------	UNKNOWN
Post-slew image of 15-350 keV band
Time interval of the image:
910.300600 963.055700

# RAcent  DECcent POSerr Theta    Phi  PeakCts   SNR AngSep     Name
#  [deg]    [deg]    ['] [deg]  [deg]                   [']
170.3506 -60.5754   18.8  47.0  -52.4  -0.2213  -0.6    3.0	Cen X-3
186.4277 -62.8653    5.9  39.1  -51.8   0.2677   2.0    8.5	GX 301-2
244.9771 -15.6501    0.4  34.3   67.2   4.6936  28.4    0.6	Sco X-1
255.9520 -37.8573    2.4  10.9   87.1   0.3693   4.7    1.8	4U 1700-377
256.4036 -36.4965    4.0  12.3   88.6   0.2280   2.9    4.7	GX 349+2
262.9269 -24.7356    4.2  24.7  101.7   0.2965   2.7    4.5	GX 1+4
264.8191 -44.5973    7.5   7.6  145.4   0.1122   1.5    9.4	4U 1735-44
270.2761 -25.2221    4.8  26.2  116.9   0.2731   2.4    8.6	GX 5-1
270.4381 -25.7011    9.6  25.8  117.6   0.1491   1.4    7.7	GRS 1758-258
274.1325 -14.0146    6.5  38.0  115.7   0.4044   1.8    7.5	GX 17+2
275.7922 -30.5245    0.0  23.8  133.0  -0.1006  -1.0   11.7	H1820-303
284.9244 -25.0597   11.2  33.0  140.2   0.1384   1.0   10.3	HT1900.1-2455
262.9601 -33.9841    8.8  15.8  108.6   0.1061   1.3    9.1	GX 354-0
210.6532 -52.7964    1.9  28.2  -29.8   0.4834   6.2 ------	UNKNOWN
341.6461 -87.5355    2.9  41.1  -98.1   1.5453   3.9 ------	UNKNOWN
Plot creation:
Sun May 31 09:58:39 EDT 2015