Click here for the BAT GCN circular template
Image
Pre-slew 15.0-350.0 keV image (Event data)

#   RAcent    DECcent   POSerr    Theta     Phi              Peak Cts       SNR   Name
  323.8064   -24.8101   0.0054    43.0950    15.5766         3.6867392     35.688 TRIG_00282808

Foreground time interval of the image:
 -5.192  14.213 (delta_t =  19.405 [sec])
Background time interval of the image:
-239.888  -5.192 (delta_t = 234.696 [sec])
Lightcurves
Notes:
- 1) The mask-weighted light curves are using the flight position.
- 2) Multiple plots of different time binning/intervals are shown to cover all scenarios of short/long GRBs, rate/image triggers, and real/false positives.
- 3) For all the mask-weighted lightcurves, the y-axis units are counts/sec/det where a det is 0.4 x 0.4 = 0.16 sq cm.
- 4) The verticle lines correspond to following: green dotted lines are T50 interval, black dotted lines are T90 interval, blue solid line(s) is a spacecraft slew start time, and orange solid line(s) is a spacecraft slew end time.
- 5) Time of each bin is in the middle of the bin.
1 s binning
From T0-310 s to T0+310 s

From T100_start - 20 s to T100_end + 30 s

Full time interval

64 ms binning
Full time interval

From T100_start to T100_end

From T0-5 sec to T0+5 sec

16 ms binning
From T100_start-5 s to T100_start+5 s

Blue+Cyan dotted lines: Time interval of the scaled map
From 0.000000 to 1.024000
8 ms binning
From T100_start-3 s to T100_start+3 s

Blue+Cyan dotted lines: Time interval of the scaled map
From 0.000000 to 1.024000
2 ms binning
From T100_start-1 s to T100_start+1 s

Blue+Cyan dotted lines: Time interval of the scaled map
From 0.000000 to 1.024000
SN=5 or 10 sec. binning (whichever binning is satisfied first)

SN=5 or 10 sec. binning (T < 200 sec)

Quad-rate summed light curves (from T0-300s to T0+1000s)

Spectral Evolution

Spectra
Notes:
- 1) The fitting includes the systematic errors.
- 2) When the burst includes telescope slew time periods, the fitting uses an average response file made from multiple 5-s response files through out the slew time plus single time preiod for the non-slew times, and weighted by the total counts in the corresponding time period using addrmf. An average response file is needed becuase a spectral fit using the pre-slew DRM will introduce some errors in both a spectral shape and a normalization if the PHA file contains a lot of the slew/post-slew time interval.
- 3) For fits to more complicated models (e.g. a power-law over a cutoff power-law), the BAT team has decided to require a chi-square improvement of more than 6 for each extra dof.
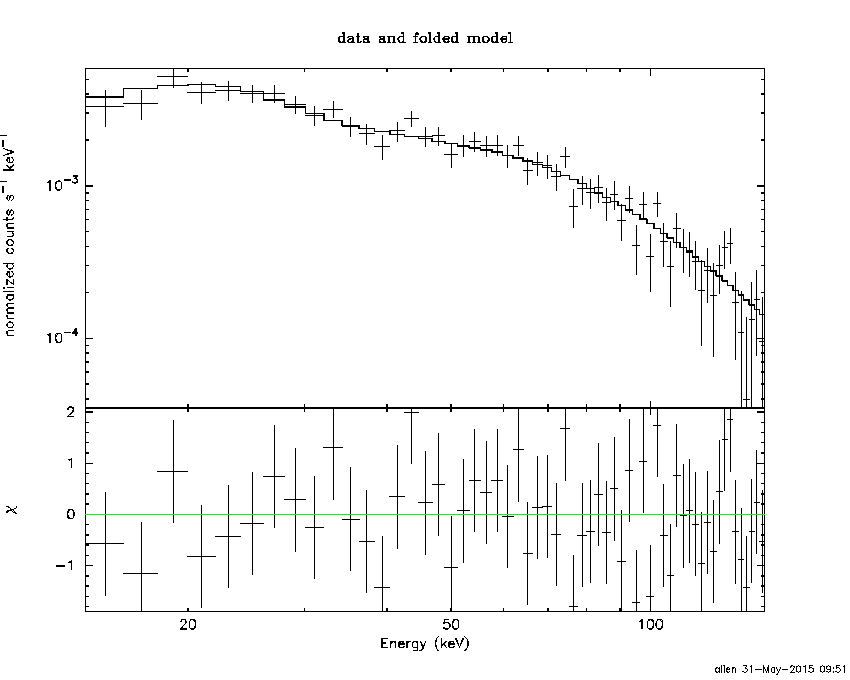
Time averaged spectrum fit using the average DRM
Power-law model

Time interval is from   -5.192 sec. to   36.464 sec.

Spectral model in power-law:
------------------------------------------------------------
Parameters  : value       lower 90%   higher 90%
Photon index: 1.52721     ( -0.0605786   0.0605777 )
Norm@50keV  : 1.11885E-02    ( -0.000362769   0.000362769 )
------------------------------------------------------------
#Fit statistic : Chi-Squared =          41.10 using 59 PHA bins.
# Reduced chi-squared =         0.7210 for     57 degrees of freedom
# Null hypothesis probability =   9.443102e-01

Photon flux (15-150 keV)    in 41.66 sec: 1.40723 ( -0.051429  0.0517115 ) ph/cm2/s
Energy fluence (15-150 keV)             : 4.4028e-06 ( -1.48263e-07  1.48479e-07 ) ergs/cm2
Cutoff power-law model

Time interval is from   -5.192 sec. to   36.464 sec.
Spectral model in the cutoff power-law:
------------------------------------------------------------
Parameters  : value       lower 90%   higher 90%
Photon index: 1.52454     ( -0.205547   0.149659 )
Epeak [keV] : 9997.71      (   )
Norm@50keV  : 1.12204E-02    ( -0.000363818   0.00311636 )
------------------------------------------------------------
#Fit statistic : Chi-Squared =          41.09 using 59 PHA bins.
# Reduced chi-squared =         0.7338 for     56 degrees of freedom
# Null hypothesis probability =   9.322691e-01

Photon flux (15-150 keV)    in 41.66 sec: 1.40357 ( -0.054  0.05466 ) ph/cm2/s
Energy fluence (15-150 keV)             : 4.40859e-06 ( -1.4306e-07  1.43894e-07 ) ergs/cm2
Band function

Time interval is from   -5.192 sec. to   36.464 sec.

Spectral model in the Band function:
------------------------------------------------------------
Parameters  : value       lower 90%   higher 90%
alpha       : 2.95023   ( -3.17603   -3.17603 )
beta        : -1.53892    ( -0.0662528   0.0627059 )
Epeak [keV] : 22.7952      ( -22.8668 68.9638 )
Norm@50keV   : 52.7005    ( -52.7002   1774.41 )
------------------------------------------------------------
#Fit statistic : Chi-Squared =          40.52 using 59 PHA bins.
# Reduced chi-squared =         0.7366 for     55 degrees of freedom
# Null hypothesis probability =   9.278613e-01

Photon flux (15-150 keV)    in 41.66 sec:  (    ) ph/cm2/s
Energy fluence (15-150 keV)             : 0 ( 0  0 ) ergs/cm2
Single BB

Spectral model blackbody:
------------------------------------------------------------
Parameters  : value    Lower 90%  Upper 90%
kT [keV]    : 17.1737  (  )
R^2/D10^2   : 9.50973E-02  (   )
(R is the radius in km and D10 is the distance to the source in units of 10 kpc)
------------------------------------------------------------
#Fit statistic : Chi-Squared =         290.37 using 59 PHA bins.
# Reduced chi-squared =         5.0941 for     57 degrees of freedom
# Null hypothesis probability =   5.399913e-33

Energy  Fluence     90% Error
[keV]   [erg/cm2]   [erg/cm2]
15- 25  2.373e-07   1.710e-08
25- 50  1.058e-06   4.749e-08
50-150  2.236e-06   1.304e-07
15-150  3.532e-06   1.433e-07
Thermal bremsstrahlung (OTTB)

Spectral model: thermal bremsstrahlung
------------------------------------------------------------
Parameters  : value         Lower 90%    Upper 90%
kT [keV]    : 200.000       (      )
Norm        : 5.75336       (-0.186849     0.186846)
------------------------------------------------------------
#Fit statistic : Chi-Squared =          49.40 using 59 PHA bins.
# Reduced chi-squared =         0.8667 for     57 degrees of freedom
# Null hypothesis probability =   7.526518e-01

Energy  Fluence     90% Error
[keV]   [erg/cm2]   [erg/cm2]
15- 25  5.969e-07   2.500e-08
25- 50  1.148e-06   4.395e-08
50-150  2.518e-06   9.061e-08
15-150  4.263e-06   1.608e-07
Double BB

Spectral model: bbodyrad<1> + bbodyrad<2>
------------------------------------------------------------
Parameters  : value         Lower 90%    Upper 90%
kT1 [keV]   : 7.33376        (-0.789872      0.859784)
R1^2/D10^2  : 1.28574        (-0.413333      0.665544)
kT2 [keV]   : 29.8780        (-3.10778      4.18706)
R2^2/D10^2  : 1.13206E-02    (-0.00411277   0.0054429)
------------------------------------------------------------
#Fit statistic : Chi-Squared =          44.68 using 59 PHA bins.
# Reduced chi-squared =         0.8124 for     55 degrees of freedom
# Null hypothesis probability =   8.385182e-01

Energy  Fluence     90% Error
[keV]   [erg/cm2]   [erg/cm2]
15- 25  5.505e-07   6.228e-08
25- 50  1.132e-06   7.936e-08
50-150  2.710e-06   2.531e-07
15-150  4.392e-06   3.037e-07
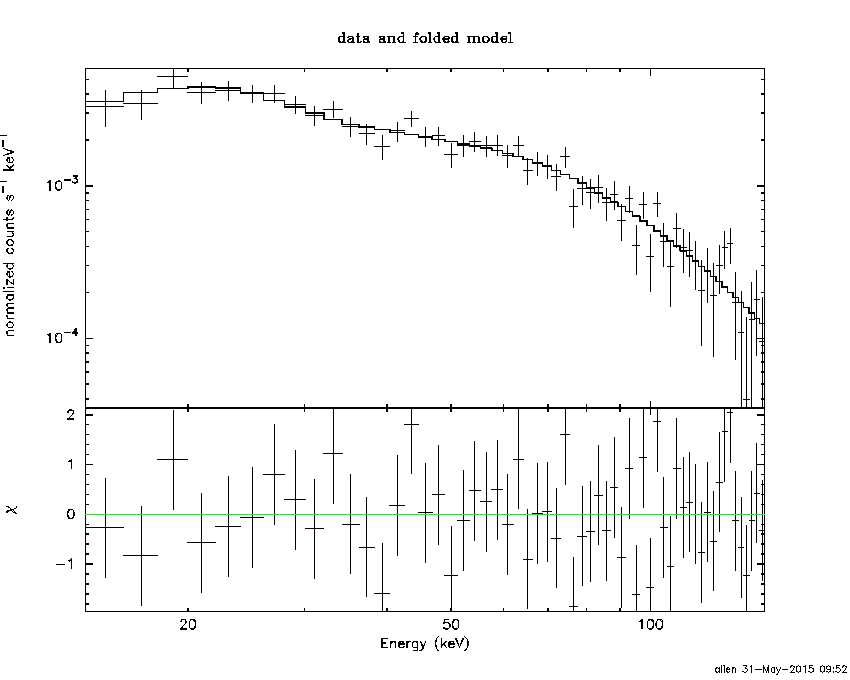
Peak spectrum fit
Power-law model

Time interval is from   21.576 sec. to   22.576 sec.

Spectral model in power-law:
------------------------------------------------------------
Parameters  : value       lower 90%   higher 90%
Photon index: 1.37605     ( -0.200676   0.198219 )
Norm@50keV  : 2.05433E-02    ( -0.00229029   0.00229018 )
------------------------------------------------------------
#Fit statistic : Chi-Squared =          61.17 using 59 PHA bins.
# Reduced chi-squared =          1.073 for     57 degrees of freedom
# Null hypothesis probability =   3.287866e-01

Photon flux (15-150 keV)    in 1 sec: 2.48852 ( -0.29525  0.296632 ) ph/cm2/s
Energy fluence (15-150 keV)             : 1.995e-07 ( -2.38572e-08  2.39944e-08 ) ergs/cm2
Cutoff power-law model

Time interval is from   21.576 sec. to   22.576 sec.
Spectral model in the cutoff power-law:
------------------------------------------------------------
Parameters  : value       lower 90%   higher 90%
Photon index: 2.08306     (     )
Epeak [keV] : 31.7077      (   )
Norm@50keV  : 7.20369E-03    (     )
------------------------------------------------------------
#Fit statistic : Chi-Squared =          59.84 using 59 PHA bins.
# Reduced chi-squared =          1.069 for     56 degrees of freedom
# Null hypothesis probability =   3.381495e-01

Photon flux (15-150 keV)    in 1 sec: 2.48865 ( -0.2956  0.29194 ) ph/cm2/s
Energy fluence (15-150 keV)             : 1.99248e-07 ( -2.3587e-08  2.4272e-08 ) ergs/cm2
Band function

Time interval is from   21.576 sec. to   22.576 sec.

Spectral model in the Band function:
------------------------------------------------------------
Parameters  : value       lower 90%   higher 90%
alpha       : 4.34190   ( -4.34224   -4.34224 )
beta        : -1.39722    ( -0.213872   0.210074 )
Epeak [keV] : 22.0787      ( -22.074 91.9852 )
Norm@50keV   : 1241.77    ( -1244.24   1.644e+06 )
------------------------------------------------------------
#Fit statistic : Chi-Squared =          60.97 using 59 PHA bins.
# Reduced chi-squared =          1.109 for     55 degrees of freedom
# Null hypothesis probability =   2.699191e-01

Photon flux (15-150 keV)    in 1 sec:  (    ) ph/cm2/s
Energy fluence (15-150 keV)             : 0 ( 0  0 ) ergs/cm2
Single BB

Spectral model blackbody:
------------------------------------------------------------
Parameters  : value    Lower 90%  Upper 90%
kT [keV]    : 17.3542  (-3.02232  3.90789)
R^2/D10^2   : 0.169841  (-0.0840802   0.160224)
(R is the radius in km and D10 is the distance to the source in units of 10 kpc)
------------------------------------------------------------
#Fit statistic : Chi-Squared =          90.59 using 59 PHA bins.
# Reduced chi-squared =          1.589 for     57 degrees of freedom
# Null hypothesis probability =   3.076050e-03

Energy  Fluence     90% Error
[keV]   [erg/cm2]   [erg/cm2]
15- 25  1.036e-08   2.616e-09
25- 50  4.658e-08   8.455e-09
50-150  1.008e-07   2.183e-08
15-150  1.577e-07   2.360e-08
Thermal bremsstrahlung (OTTB)

Spectral model: thermal bremsstrahlung
------------------------------------------------------------
Parameters  : value         Lower 90%    Upper 90%
kT [keV]    : 200.000       (      )
Norm        : 10.3936       (-1.16911     1.16888)
------------------------------------------------------------
#Fit statistic : Chi-Squared =          64.87 using 59 PHA bins.
# Reduced chi-squared =          1.138 for     57 degrees of freedom
# Null hypothesis probability =   2.214594e-01

Energy  Fluence     90% Error
[keV]   [erg/cm2]   [erg/cm2]
15- 25  2.588e-08   1.047e-08
25- 50  4.979e-08   2.746e-08
50-150  1.092e-07   6.006e-08
15-150  1.849e-07   1.012e-07
Double BB

Spectral model: bbodyrad<1> + bbodyrad<2>
------------------------------------------------------------
Parameters  : value         Lower 90%    Upper 90%
kT1 [keV]   : 8.31854        (-1.8303      2.15317)
R1^2/D10^2  : 1.59876        (-0.866982      1.49121)
kT2 [keV]   : 43.0707        (-13.8625      53.8464)
R2^2/D10^2  : 7.38820E-03    (-0.00626307   0.0169679)
------------------------------------------------------------
#Fit statistic : Chi-Squared =          57.95 using 59 PHA bins.
# Reduced chi-squared =          1.054 for     55 degrees of freedom
# Null hypothesis probability =   3.671297e-01

Energy  Fluence     90% Error
[keV]   [erg/cm2]   [erg/cm2]
15- 25  2.224e-08   9.716e-09
25- 50  5.014e-08   2.310e-08
50-150  1.333e-07   6.899e-08
15-150  2.056e-07   9.163e-08
Pre-slew spectrum (Pre-slew PHA with pre-slew DRM)
Power-law model
Spectral model in power-law:
------------------------------------------------------------
Parameters  : value       lower 90%   higher 90%
Photon index: 1.39329     ( -0.0733776   0.0731443 )
Norm@50keV  : 1.33088E-02    ( -0.000546594   0.000546489 )
------------------------------------------------------------
#Fit statistic : Chi-Squared =          47.74 using 59 PHA bins.
# Reduced chi-squared =         0.8375 for     57 degrees of freedom
# Null hypothesis probability =   8.039803e-01

Photon flux (15-150 keV)    in 19.4 sec: 1.61831 ( -0.0727026  0.0729249 ) ph/cm2/s
Energy fluence (15-150 keV)             : 2.49825e-06 ( -1.07439e-07  1.07576e-07 ) ergs/cm2
Cutoff power-law model
Spectral model in the cutoff power-law:
------------------------------------------------------------
Parameters  : value       lower 90%   higher 90%
Photon index: 1.18703     ( -0.299942   0.237305 )
Epeak [keV] : 221.841      (   )
Norm@50keV  : 1.65164E-02    (     )
------------------------------------------------------------
#Fit statistic : Chi-Squared =          46.20 using 59 PHA bins.
# Reduced chi-squared =         0.8249 for     56 degrees of freedom
# Null hypothesis probability =   8.219129e-01

Photon flux (15-150 keV)    in 19.4 sec: 1.59945 ( -0.07676  0.07698 ) ph/cm2/s
Energy fluence (15-150 keV)             : 2.47573e-06 ( -1.13199e-07  1.12675e-07 ) ergs/cm2
Band function

Spectral model in the Band function:
------------------------------------------------------------
Parameters  : value       lower 90%   higher 90%
alpha       : -1.01298   ( 0.939642   0.939642 )
beta        : -1.50912    ( 1.49735   0.149084 )
Epeak [keV] : 123.401      ( -111.349 -111.349 )
Norm@50keV   : 2.07257E-02    ( -0.00748773   0 )
------------------------------------------------------------
#Fit statistic : Chi-Squared =          45.78 using 59 PHA bins.
# Reduced chi-squared =         0.8324 for     55 degrees of freedom
# Null hypothesis probability =   8.075011e-01

Photon flux (15-150 keV)    in 19.4 sec:  (    ) ph/cm2/s
Energy fluence (15-150 keV)             : 0 ( 0  0 ) ergs/cm2
S(25-50 keV) vs. S(50-100 keV) plot

S(25-50 keV)  = 1.10e-06
S(50-100 keV) = 1.53e-06
T90 vs. Hardness ratio plot

T90                                   = 33.2639999985695 sec.
Hardness ratio (energy fluence ratio) = 1.39091
Color vs. Color plot

Count Ratio  (25-50 keV) / (15-25 keV) = 1.40562
Count Ratio (50-100 keV) / (15-25 keV) = 1.14829
Mask shadow pattern
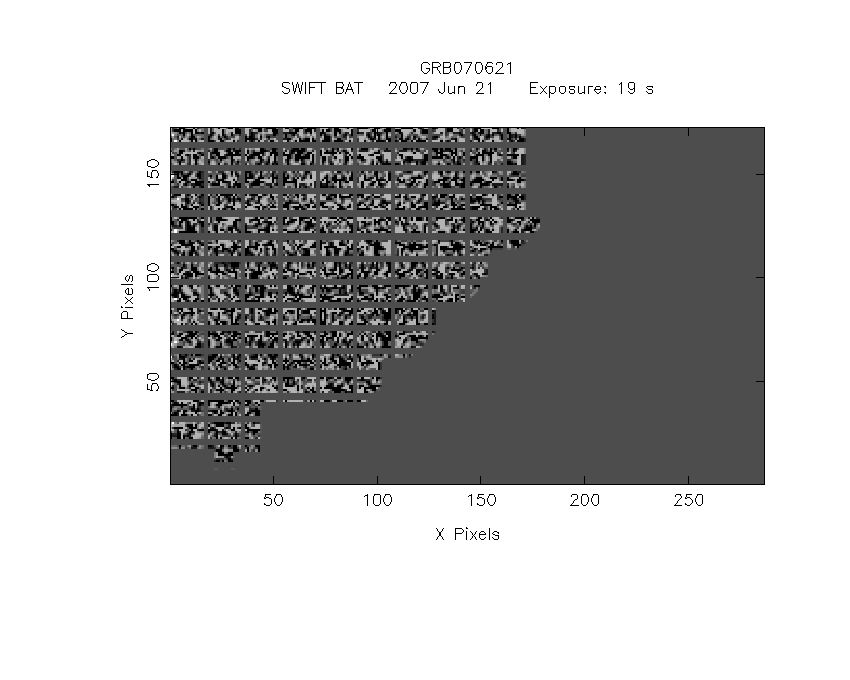
IMX = 9.012552681999916E-01, IMY = -2.512377228390137E-01
TIME vs. PHA plot around the trigger time

Blue+Cyan dotted lines: Time interval of the scaled map
From 0.000000 to 1.024000
TIME vs. DetID plot around the trigger time

Blue+Cyan dotted lines: Time interval of the scaled map
From 0.000000 to 1.024000
100 us light curve (15-350 keV)

Blue+Cyan dotted lines: Time interval of the scaled map
From 0.000000 to 1.024000
Spacecraft aspect plot

Bright source in the pre-burst/pre-slew/post-slew images
Pre-burst image of 15-350 keV band
Time interval of the image:
-239.888000 -5.192000

# RAcent  DECcent POSerr Theta    Phi  PeakCts   SNR AngSep     Name
#  [deg]    [deg]    ['] [deg]  [deg]                   [']
244.9851 -15.6459    0.6  45.3  134.0  14.4210  17.8    0.5	Sco X-1
254.4921  35.3338    1.9  46.6 -151.2   2.2869   6.3    1.8	Her X-1
263.0979 -24.7261   23.1  34.8  108.6   0.2066   0.5    5.0	GX 1+4
268.3133  -1.4640    3.3  19.6  150.9   0.5966   3.5    3.4	SW J1753.5-0127
270.2895 -25.0606    3.1  30.8   99.1   1.2255   3.7    1.2	GX 5-1
270.4501 -25.7635    6.5  31.2   98.1   0.5956   1.8    8.1	GRS 1758-258
273.9867 -14.0392    3.0  20.0  109.5   0.7685   3.8    1.1	GX 17+2
275.7676 -30.3660    5.7  33.0   86.2   0.8117   2.0    8.1	H1820-303
284.9669 -24.7344    0.0  25.5   72.9   0.2556   1.1   11.8	HT1900.1-2455
288.8105  10.9379    1.2  10.4 -107.8   1.6579   9.4    0.8	GRS 1915+105
299.5962  35.1874    0.8  36.3  -96.8   7.0646  15.3    0.9	Cyg X-1
308.7556  -4.8922    2.5  21.6   -8.2   0.7505   4.6 ------	UNKNOWN
300.5345  40.0729    4.2  41.1  -98.3   2.6104   2.8 ------	UNKNOWN
Pre-slew background subtracted image of 15-350 keV band
Time interval of the image:
-5.192000 14.212600

# RAcent  DECcent POSerr Theta    Phi  PeakCts   SNR AngSep     Name
#  [deg]    [deg]    ['] [deg]  [deg]                   [']
244.9879 -15.7162    6.5  45.3  133.9   0.3837   1.8    4.6	Sco X-1
254.4144  35.4595    4.0  46.7 -151.2   0.2731   2.9    7.3	Her X-1
262.9299 -24.6832    4.7  34.9  108.8   0.2705   2.4    5.7	GX 1+4
268.4859  -1.5564    5.8  19.5  150.5   0.1037   2.0    9.4	SW J1753.5-0127
270.2291 -24.8827    0.0  30.6   99.4   0.1354   1.5   12.2	GX 5-1
270.4251 -25.8102    3.8  31.3   98.1  -0.2799  -3.0    7.8	GRS 1758-258
273.8157 -14.1125   24.3  20.2  109.7  -0.0287  -0.5   12.0	GX 17+2
275.9272 -30.3697   41.2  33.0   86.0   0.0310   0.3    0.2	H1820-303
285.0280 -24.9086   51.1  25.6   72.8   0.0159   0.2    0.8	HT1900.1-2455
288.7271  10.8722    6.0  10.3 -108.2   0.0889   1.9    6.1	GRS 1915+105
299.8119  35.2807    0.0  36.4  -96.5  -0.0087  -0.1   11.9	Cyg X-1
323.8064 -24.8101    0.3  43.1   15.6   3.6870  35.7 ------	UNKNOWN
342.5633 -19.1773    2.7  57.2    0.3   1.3324   4.2 ------	UNKNOWN
Post-slew image of 15-350 keV band
Time interval of the image:
98.212590 962.124300

# RAcent  DECcent POSerr Theta    Phi  PeakCts   SNR AngSep     Name
#  [deg]    [deg]    ['] [deg]  [deg]                   [']
285.1602 -24.8125    4.5  34.9   91.9   2.4455   2.5    9.4	HT1900.1-2455
288.8732  10.9677    4.4  49.4  142.5   4.9082   2.6    4.6	GRS 1915+105
278.6713 -37.6331    4.3  40.2   70.6   4.6530   2.7 ------	UNKNOWN
310.1228  25.6130    2.0  52.2  174.6   7.0258   5.8 ------	UNKNOWN
355.0551 -42.0637    2.5  31.0  -38.3   2.3838   4.6 ------	UNKNOWN
327.4936  34.0831    3.6  59.1 -166.2   9.8530   3.2 ------	UNKNOWN
346.3600  -8.8099    3.1  26.9 -112.6   1.8509   3.7 ------	UNKNOWN
 26.5825 -61.8752    3.4  55.5  -20.4   5.3830   3.4 ------	UNKNOWN
 13.4612 -49.4526    4.0  45.5  -33.9   2.3371   2.9 ------	UNKNOWN
 17.5297 -35.6829    5.0  47.1  -53.3   5.5260   2.3 ------	UNKNOWN
  2.7793  -7.3969    4.3  41.1  -98.2   7.6237   2.7  473.9	UNKNOWN
Plot creation:
Sun May 31 09:52:48 EDT 2015