Click here for the BAT GCN circular template
Image
Pre-slew 15.0-350.0 keV image (Event data)
#   RAcent    DECcent   POSerr    Theta     Phi              Peak Cts       SNR   Name
  354.7082    66.2577   0.0123    42.4919   174.4289         2.2258866     15.599 TRIG_00283791

Foreground time interval of the image:
 -2.499  72.101 (delta_t =  74.600 [sec])
Background time interval of the image:
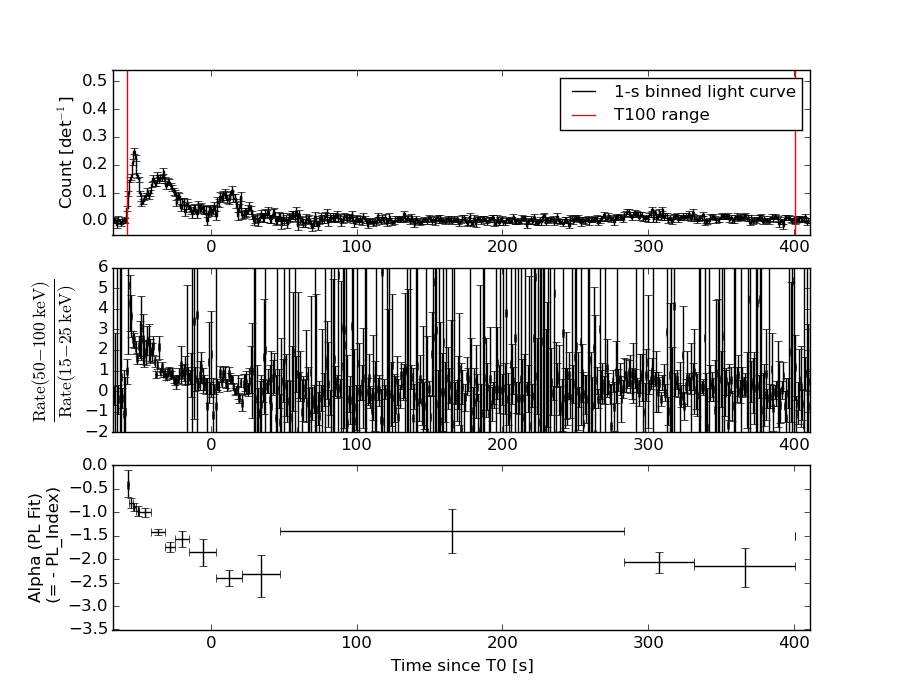
Lightcurves
Notes:
- 1) The mask-weighted light curves are using the flight position.
- 2) Multiple plots of different time binning/intervals are shown to cover all scenarios of short/long GRBs, rate/image triggers, and real/false positives.
- 3) For all the mask-weighted lightcurves, the y-axis units are counts/sec/det where a det is 0.4 x 0.4 = 0.16 sq cm.
- 4) The verticle lines correspond to following: green dotted lines are T50 interval, black dotted lines are T90 interval, blue solid line(s) is a spacecraft slew start time, and orange solid line(s) is a spacecraft slew end time.
- 5) Time of each bin is in the middle of the bin.
1 s binning
From T0-310 s to T0+310 s
From T100_start - 20 s to T100_end + 30 s
Full time interval

64 ms binning
Full time interval
From T100_start to T100_end

From T0-5 sec to T0+5 sec
16 ms binning
From T100_start-5 s to T100_start+5 s

Blue+Cyan dotted lines: Time interval of the scaled map
From 0.000000 to 64.000000
8 ms binning
From T100_start-3 s to T100_start+3 s

Blue+Cyan dotted lines: Time interval of the scaled map
From 0.000000 to 64.000000
2 ms binning
From T100_start-1 s to T100_start+1 s

Blue+Cyan dotted lines: Time interval of the scaled map
From 0.000000 to 64.000000
SN=5 or 10 sec. binning (whichever binning is satisfied first)
SN=5 or 10 sec. binning (T < 200 sec)

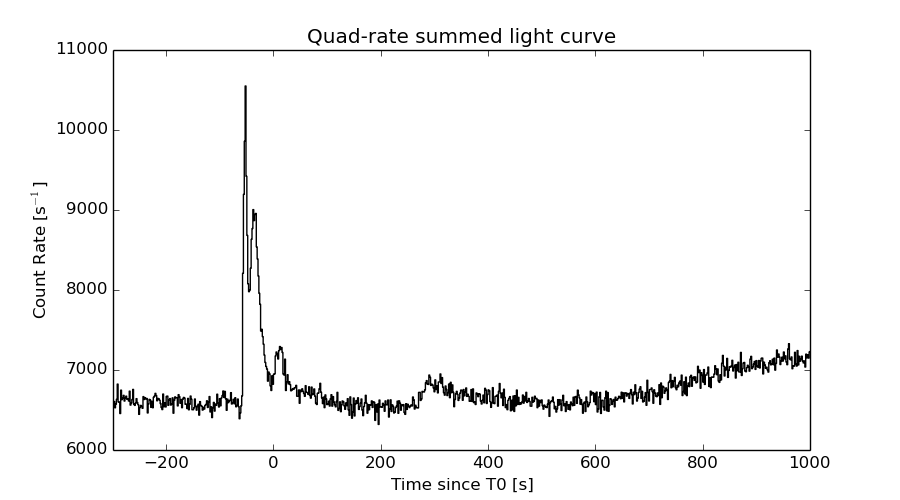
Quad-rate summed light curves (from T0-300s to T0+1000s)
Spectral Evolution
Spectra
Notes:
- 1) The fitting includes the systematic errors.
- 2) When the burst includes telescope slew time periods, the fitting uses an average response file made from multiple 5-s response files through out the slew time plus single time preiod for the non-slew times, and weighted by the total counts in the corresponding time period using addrmf. An average response file is needed becuase a spectral fit using the pre-slew DRM will introduce some errors in both a spectral shape and a normalization if the PHA file contains a lot of the slew/post-slew time interval.
- 3) For fits to more complicated models (e.g. a power-law over a cutoff power-law), the BAT team has decided to require a chi-square improvement of more than 6 for each extra dof.
Time averaged spectrum fit using the average DRM
Power-law model
Time interval is from  -57.324 sec. to  400.776 sec.

Spectral model in power-law:
------------------------------------------------------------
Parameters  : value       lower 90%   higher 90%
Photon index: 1.64619     ( -0.0760207   0.0764155 )
Norm@50keV  : 1.38642E-03    ( -5.70808e-05   5.68578e-05 )
------------------------------------------------------------
#Fit statistic : Chi-Squared =          70.85 using 59 PHA bins.
# Reduced chi-squared =          1.243 for     57 degrees of freedom
# Null hypothesis probability =   1.026738e-01

Photon flux (15-150 keV)    in 458.1 sec: 0.180805 ( -0.00769859  0.00772753 ) ph/cm2/s
Energy fluence (15-150 keV)             : 5.90912e-06 ( -2.57024e-07  2.58374e-07 ) ergs/cm2
Cutoff power-law model

Time interval is from  -57.324 sec. to  400.776 sec.
Spectral model in the cutoff power-law:
------------------------------------------------------------
Parameters  : value       lower 90%   higher 90%
Photon index: 1.60907     ( -0.284805   0.107711 )
Epeak [keV] : 534.998      ( -534.998 -534.998 )
Norm@50keV  : 1.44634E-03    ( -0.000112875   0.000535796 )
------------------------------------------------------------
#Fit statistic : Chi-Squared =          70.80 using 59 PHA bins.
# Reduced chi-squared =          1.264 for     56 degrees of freedom
# Null hypothesis probability =   8.801232e-02

Photon flux (15-150 keV)    in 458.1 sec: 0.180238 ( -0.008231  0.008129 ) ph/cm2/s
Energy fluence (15-150 keV)             : 5.88622e-06 ( -2.81961e-07  2.79762e-07 ) ergs/cm2
Band function
Time interval is from  -57.324 sec. to  400.776 sec.

Spectral model in the Band function:
------------------------------------------------------------
Parameters  : value       lower 90%   higher 90%
alpha       : 4.89654   ( -4.89654   -4.89654 )
beta        : -1.66995    ( -0.0811462   0.0797348 )
Epeak [keV] : 21.1547      ( -21.1547 3.34269 )
Norm@50keV   : 387.429    ( -15.4345   699737 )
------------------------------------------------------------
#Fit statistic : Chi-Squared =          69.30 using 59 PHA bins.
# Reduced chi-squared =          1.260 for     55 degrees of freedom
# Null hypothesis probability =   9.288086e-02

Photon flux (15-150 keV)    in 458.1 sec:  (    ) ph/cm2/s
Energy fluence (15-150 keV)             : 0 ( 0  0 ) ergs/cm2
Single BB
Spectral model blackbody:
------------------------------------------------------------
Parameters  : value    Lower 90%  Upper 90%
kT [keV]    : 14.3908  (  )
R^2/D10^2   : 2.19209E-02  (   )
(R is the radius in km and D10 is the distance to the source in units of 10 kpc)
------------------------------------------------------------
#Fit statistic : Chi-Squared =         239.15 using 59 PHA bins.
# Reduced chi-squared =         4.1955 for     57 degrees of freedom
# Null hypothesis probability =   3.619692e-24

Energy  Fluence     90% Error
[keV]   [erg/cm2]   [erg/cm2]
15- 25  4.380e-07   3.598e-08
25- 50  1.674e-06   8.910e-08
50-150  2.314e-06   1.871e-07
15-150  4.425e-06   2.100e-07
Thermal bremsstrahlung (OTTB)

Spectral model: thermal bremsstrahlung
------------------------------------------------------------
Parameters  : value         Lower 90%    Upper 90%
kT [keV]    : 167.268       (-32.2116      -166.88)
Norm        : 0.729419       (-0.034358     0.0379135)
------------------------------------------------------------
#Fit statistic : Chi-Squared =          74.53 using 59 PHA bins.
# Reduced chi-squared =          1.308 for     57 degrees of freedom
# Null hypothesis probability =   5.940429e-02

Energy  Fluence     90% Error
[keV]   [erg/cm2]   [erg/cm2]
15- 25  8.495e-07   5.451e-08
25- 50  1.599e-06   1.374e-07
50-150  3.295e-06   9.877e-07
15-150  5.743e-06   1.147e-06
Double BB
Spectral model: bbodyrad<1> + bbodyrad<2>
------------------------------------------------------------
Parameters  : value         Lower 90%    Upper 90%
kT1 [keV]   : 6.66505        (-0.797603      0.883539)
R1^2/D10^2  : 0.248151        (-0.0883765      0.150965)
kT2 [keV]   : 26.6424        (-3.37      4.7649)
R2^2/D10^2  : 1.96572E-03    (-0.000854436   0.0012449)
------------------------------------------------------------
#Fit statistic : Chi-Squared =          71.60 using 59 PHA bins.
# Reduced chi-squared =          1.302 for     55 degrees of freedom
# Null hypothesis probability =   6.563668e-02

Energy  Fluence     90% Error
[keV]   [erg/cm2]   [erg/cm2]
15- 25  8.760e-07   1.074e-07
25- 50  1.583e-06   1.530e-07
50-150  3.398e-06   4.675e-07
15-150  5.857e-06   6.482e-07
Peak spectrum fit
Power-law model

Time interval is from  -53.100 sec. to  -52.100 sec.

Spectral model in power-law:
------------------------------------------------------------
Parameters  : value       lower 90%   higher 90%
Photon index: 0.868598     ( -0.118438   0.115733 )
Norm@50keV  : 1.74229E-02    ( -0.00120151   0.00119565 )
------------------------------------------------------------
#Fit statistic : Chi-Squared =          67.10 using 59 PHA bins.
# Reduced chi-squared =          1.177 for     57 degrees of freedom
# Null hypothesis probability =   1.692336e-01

Photon flux (15-150 keV)    in 1 sec: 1.99965 ( -0.137094  0.137285 ) ph/cm2/s
Energy fluence (15-150 keV)             : 1.97965e-07 ( -1.42217e-08  1.42577e-08 ) ergs/cm2
Cutoff power-law model

Time interval is from  -53.100 sec. to  -52.100 sec.
Spectral model in the cutoff power-law:
------------------------------------------------------------
Parameters  : value       lower 90%   higher 90%
Photon index: 0.474702     ( -0.53961   0.435393 )
Epeak [keV] : 229.459      (   )
Norm@50keV  : 2.58034E-02    (     )
------------------------------------------------------------
#Fit statistic : Chi-Squared =          65.17 using 59 PHA bins.
# Reduced chi-squared =          1.164 for     56 degrees of freedom
# Null hypothesis probability =   1.880417e-01

Photon flux (15-150 keV)    in 1 sec: 1.97295 ( -0.14106  0.14104 ) ph/cm2/s
Energy fluence (15-150 keV)             : 1.95117e-07 ( -1.5044e-08  1.4885e-08 ) ergs/cm2
Band function
Time interval is from  -53.100 sec. to  -52.100 sec.

Spectral model in the Band function:
------------------------------------------------------------
Parameters  : value       lower 90%   higher 90%
alpha       : -0.910696   ( 0.910696   0.910696 )
beta        : -0.868582    ( -0.115627   0.118392 )
Epeak [keV] : 12.7786      ( -12.7786 -12.7786 )
Norm@50keV   : 2.64831E-02    ( -0.00977573   426358 )
------------------------------------------------------------
#Fit statistic : Chi-Squared =          67.10 using 59 PHA bins.
# Reduced chi-squared =          1.220 for     55 degrees of freedom
# Null hypothesis probability =   1.268520e-01

Photon flux (15-150 keV)    in 1 sec:  (    ) ph/cm2/s
Energy fluence (15-150 keV)             : 0 ( 0  0 ) ergs/cm2
Single BB

Spectral model blackbody:
------------------------------------------------------------
Parameters  : value    Lower 90%  Upper 90%
kT [keV]    : 23.6580  (-2.09548  2.42792)
R^2/D10^2   : 5.95878E-02  (-0.0154075   0.0198317)
(R is the radius in km and D10 is the distance to the source in units of 10 kpc)
------------------------------------------------------------
#Fit statistic : Chi-Squared =          88.75 using 59 PHA bins.
# Reduced chi-squared =          1.557 for     57 degrees of freedom
# Null hypothesis probability =   4.500946e-03

Energy  Fluence     90% Error
[keV]   [erg/cm2]   [erg/cm2]
15- 25  5.961e-09   8.355e-10
25- 50  3.285e-08   3.490e-09
50-150  1.371e-07   1.495e-08
15-150  1.759e-07   1.445e-08
Thermal bremsstrahlung (OTTB)
Spectral model: thermal bremsstrahlung
------------------------------------------------------------
Parameters  : value         Lower 90%    Upper 90%
kT [keV]    : 199.359       (      )
Norm        : 7.90975       (     )
------------------------------------------------------------
#Fit statistic : Chi-Squared =         157.04 using 59 PHA bins.
# Reduced chi-squared =         2.7551 for     57 degrees of freedom
# Null hypothesis probability =   2.722671e-11

Energy  Fluence     90% Error
[keV]   [erg/cm2]   [erg/cm2]
15- 25  1.970e-08   1.735e-09
25- 50  3.789e-08   4.675e-09
50-150  8.310e-08   2.880e-08
15-150  1.407e-07   2.697e-08
Double BB
------------------------------------------------------------
Parameters  : value         Lower 90%    Upper 90%
kT1 [keV]   : 13.9720        (-3.86995      3.53153)
R1^2/D10^2  : 0.196365        (-0.087399      0.221321)
kT2 [keV]   : 67.3971        (-28.2776      -63.3411)
R2^2/D10^2  : 2.32940E-03    (   )
------------------------------------------------------------
#Fit statistic : Chi-Squared =          64.36 using 59 PHA bins.
#Fit statistic : Chi-Squared =          64.33 using 59 PHA bins.
# Reduced chi-squared =          1.170 for     55 degrees of freedom
# Reduced chi-squared =          1.170 for     55 degrees of freedom
# Null hypothesis probability =   1.815914e-01
# Null hypothesis probability =   1.822663e-01

Energy  Fluence     90% Error
[keV]   [erg/cm2]   [erg/cm2]
15- 25  9.094e-09   2.835e-09
25- 50  3.696e-08   1.393e-08
50-150  1.482e-07   7.213e-08
15-150  1.942e-07   8.632e-08
Pre-slew spectrum (Pre-slew PHA with pre-slew DRM)
Power-law model

Spectral model in power-law:
------------------------------------------------------------
Parameters  : value       lower 90%   higher 90%
Photon index: 2.19692     ( -0.183223   0.194321 )
Norm@50keV  : 1.72649E-03    ( -0.000221757   0.000216422 )
------------------------------------------------------------
#Fit statistic : Chi-Squared =          65.87 using 59 PHA bins.
# Reduced chi-squared =          1.156 for     57 degrees of freedom
# Null hypothesis probability =   1.968964e-01

Photon flux (15-150 keV)    in 74.6 sec: 0.285365 ( -0.0269274  0.0269433 ) ph/cm2/s
Energy fluence (15-150 keV)             : 1.21044e-06 ( -1.32958e-07  1.35193e-07 ) ergs/cm2
Cutoff power-law model

Spectral model in the cutoff power-law:
------------------------------------------------------------
Parameters  : value       lower 90%   higher 90%
Photon index: 1.96879     ( -0.732879   0.0316927 )
Epeak [keV] : 5.67635      (   )
Norm@50keV  : 2.34223E-03    (     )
------------------------------------------------------------
#Fit statistic : Chi-Squared =          65.72 using 59 PHA bins.
# Reduced chi-squared =          1.174 for     56 degrees of freedom
# Null hypothesis probability =   1.754798e-01

Photon flux (15-150 keV)    in 74.6 sec: 0.283519 ( -0.027987  0.02787 ) ph/cm2/s
Energy fluence (15-150 keV)             : 1.19062e-06 ( -1.57473e-07  1.50714e-07 ) ergs/cm2
Band function
Spectral model in the Band function:
------------------------------------------------------------
Parameters  : value       lower 90%   higher 90%
alpha       : 4.86705   ( -4.86705   -4.86705 )
beta        : -2.26628    ( -0.23057   0.204572 )
Epeak [keV] : 19.6654      ( -19.6654 3.81208 )
Norm@50keV   : 1276.84    ( -119.193   3.32643e+06 )
------------------------------------------------------------
#Fit statistic : Chi-Squared =          64.91 using 59 PHA bins.
# Reduced chi-squared =          1.180 for     55 degrees of freedom
# Null hypothesis probability =   1.695058e-01

Photon flux (15-150 keV)    in 74.6 sec:  (    ) ph/cm2/s
Energy fluence (15-150 keV)             : 0 ( 0  0 ) ergs/cm2
S(25-50 keV) vs. S(50-100 keV) plot

S(25-50 keV)  = 1.56e-06
S(50-100 keV) = 2.00e-06
T90 vs. Hardness ratio plot

T90                                   = 384.936000019312 sec.
Hardness ratio (energy fluence ratio) = 1.28205
Color vs. Color plot
Count Ratio  (25-50 keV) / (15-25 keV) = 1.26334
Count Ratio (50-100 keV) / (15-25 keV) = 0.891577
Mask shadow pattern

IMX = -9.117435255017003E-01, IMY = -8.893280574872918E-02
TIME vs. PHA plot around the trigger time
Blue+Cyan dotted lines: Time interval of the scaled map
From 0.000000 to 64.000000
TIME vs. DetID plot around the trigger time
Blue+Cyan dotted lines: Time interval of the scaled map
From 0.000000 to 64.000000
100 us light curve (15-350 keV)

Blue+Cyan dotted lines: Time interval of the scaled map
From 0.000000 to 64.000000
Spacecraft aspect plot
Bright source in the pre-burst/pre-slew/post-slew images
Pre-burst image of 15-350 keV band
Time interval of the image:
Pre-slew background subtracted image of 15-350 keV band
Time interval of the image:
-2.499390 72.100600

# RAcent  DECcent POSerr Theta    Phi  PeakCts   SNR AngSep     Name
#  [deg]    [deg]    ['] [deg]  [deg]                   [']
 83.6302  21.9941    1.0  41.1  -68.0   3.0929  11.0    1.2	Crab
354.7083  66.2578    0.7  42.5  174.4   2.2269  15.6 ------	UNKNOWN
310.9041  83.3140    2.2  57.4 -169.1   1.9739   5.1 ------	UNKNOWN
114.5699  76.9668    2.4  55.2 -145.7   2.2600   4.9 ------	UNKNOWN
Post-slew image of 15-350 keV band
Time interval of the image:
139.100600 963.063000

# RAcent  DECcent POSerr Theta    Phi  PeakCts   SNR AngSep     Name
#  [deg]    [deg]    ['] [deg]  [deg]                   [']
308.1223  40.9837    2.1  36.0   95.2   5.2415   5.5    1.9	Cyg X-3
326.0539  38.4124    4.1  32.3   71.0   2.3676   2.8    7.8	Cyg X-2
354.6999  66.2193    2.2   0.0   84.3   2.0403   5.2 ------	UNKNOWN
206.5843  53.0761    3.0  58.3 -175.7  10.5488   3.9 ------	UNKNOWN
 96.1936  82.5660    3.3  26.2 -137.1   1.4276   3.5 ------	UNKNOWN
192.8901  53.9797    2.7  59.0 -166.1  11.6144   4.2 ------	UNKNOWN
Plot creation:
Sun May 31 09:49:05 EDT 2015