Special notes of this burst
Image
Pre-slew 15.0-350.0 keV image (Event data)
#   RAcent    DECcent   POSerr    Theta     Phi              Peak Cts       SNR   Name
   27.8221   -18.6069   0.0201    17.2333    33.3837         0.0623730      9.514 TRIG_00285948

Foreground time interval of the image:
 -0.028   0.460 (delta_t =   0.488 [sec])
Background time interval of the image:
-239.320  -0.028 (delta_t = 239.292 [sec])
Lightcurves
Notes:
- 1) The mask-weighted light curves are using the flight position.
- 2) Multiple plots of different time binning/intervals are shown to cover all scenarios of short/long GRBs, rate/image triggers, and real/false positives.
- 3) For all the mask-weighted lightcurves, the y-axis units are counts/sec/det where a det is 0.4 x 0.4 = 0.16 sq cm.
- 4) The verticle lines correspond to following: green dotted lines are T50 interval, black dotted lines are T90 interval, blue solid line(s) is a spacecraft slew start time, and orange solid line(s) is a spacecraft slew end time.
- 5) Time of each bin is in the middle of the bin.
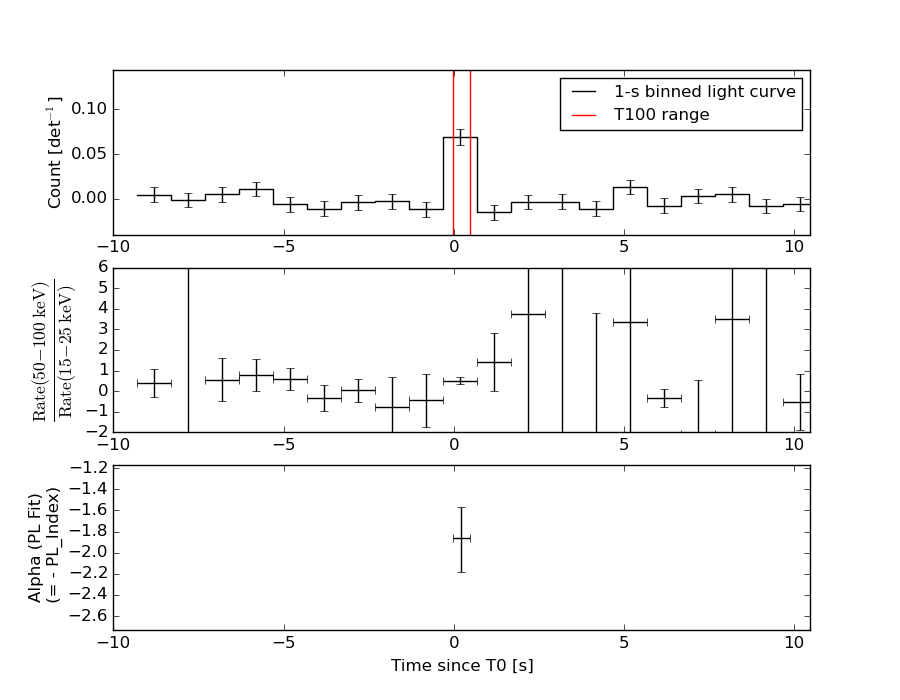
1 s binning
From T0-310 s to T0+310 s

From T100_start - 20 s to T100_end + 30 s
Full time interval

64 ms binning
Full time interval
From T100_start to T100_end
From T0-5 sec to T0+5 sec
16 ms binning
From T100_start-5 s to T100_start+5 s
Blue+Cyan dotted lines: Time interval of the scaled map
From 0.000000 to 0.512000
8 ms binning
From T100_start-3 s to T100_start+3 s
Blue+Cyan dotted lines: Time interval of the scaled map
From 0.000000 to 0.512000
2 ms binning
From T100_start-1 s to T100_start+1 s

Blue+Cyan dotted lines: Time interval of the scaled map
From 0.000000 to 0.512000
SN=5 or 10 sec. binning (whichever binning is satisfied first)
SN=5 or 10 sec. binning (T < 200 sec)
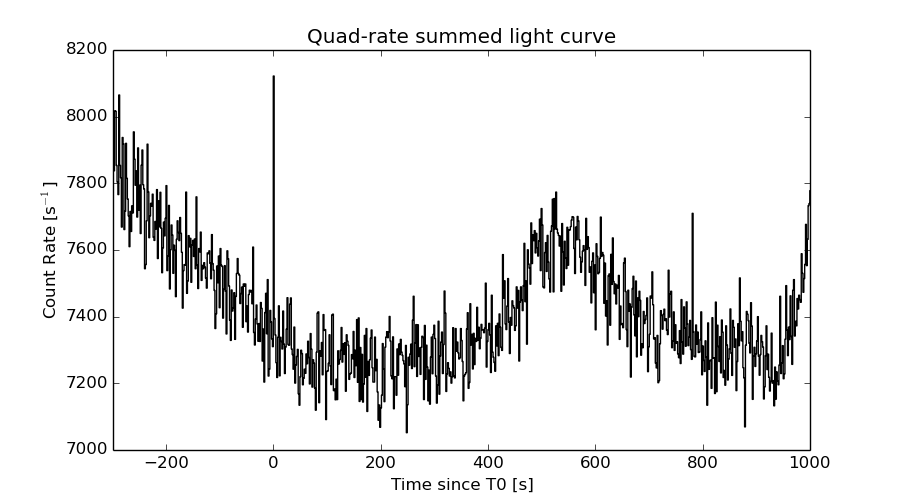
Quad-rate summed light curves (from T0-300s to T0+1000s)
Spectral Evolution
Spectra
Notes:
- 1) The fitting includes the systematic errors.
- 2) When the burst includes telescope slew time periods, the fitting uses an average response file made from multiple 5-s response files through out the slew time plus single time preiod for the non-slew times, and weighted by the total counts in the corresponding time period using addrmf. An average response file is needed becuase a spectral fit using the pre-slew DRM will introduce some errors in both a spectral shape and a normalization if the PHA file contains a lot of the slew/post-slew time interval.
- 3) For fits to more complicated models (e.g. a power-law over a cutoff power-law), the BAT team has decided to require a chi-square improvement of more than 6 for each extra dof.
Time averaged spectrum fit using the average DRM
Power-law model

Time interval is from   -0.028 sec. to    0.460 sec.

Spectral model in power-law:
------------------------------------------------------------
Parameters  : value       lower 90%   higher 90%
Photon index: 1.86112     ( -0.29613   0.323942 )
Norm@50keV  : 6.88163E-03    ( -0.00152562   0.00147839 )
------------------------------------------------------------
#Fit statistic : Chi-Squared =          53.11 using 59 PHA bins.
# Reduced chi-squared =         0.9318 for     57 degrees of freedom
# Null hypothesis probability =   6.216334e-01

Photon flux (15-150 keV)    in 0.488 sec: 0.971684 ( -0.171429  0.171432 ) ph/cm2/s
Energy fluence (15-150 keV)             : 3.08751e-08 ( -6.63475e-09  6.88383e-09 ) ergs/cm2
Cutoff power-law model

Time interval is from   -0.028 sec. to    0.460 sec.
Spectral model in the cutoff power-law:
------------------------------------------------------------
Parameters  : value       lower 90%   higher 90%
Photon index: 0.679912     ( -1.82232   1.31019 )
Epeak [keV] : 45.8537      ( -17.1098 -45.8482 )
Norm@50keV  : 3.39444E-02    ( -0.0339871   0.382066 )
------------------------------------------------------------
#Fit statistic : Chi-Squared =          50.88 using 59 PHA bins.
# Reduced chi-squared =         0.9086 for     56 degrees of freedom
# Null hypothesis probability =   6.685518e-01

Photon flux (15-150 keV)    in 0.488 sec: 0.943736 ( -0.172613  0.173954 ) ph/cm2/s
Energy fluence (15-150 keV)             : 2.76946e-08 ( -6.66418e-09  7.61514e-09 ) ergs/cm2
Band function

Time interval is from   -0.028 sec. to    0.460 sec.

Spectral model in the Band function:
------------------------------------------------------------
Parameters  : value       lower 90%   higher 90%
alpha       : -0.678883   ( 1.06664   0.64519 )
beta        : -10.00000    ( 10   20 )
Epeak [keV] : 45.8383      ( -13.2937 -45.8383 )
Norm@50keV   : 3.39935E-02    ( -0.00592106   0.38253 )
------------------------------------------------------------
#Fit statistic : Chi-Squared =          50.88 using 59 PHA bins.
# Reduced chi-squared =         0.9251 for     55 degrees of freedom
# Null hypothesis probability =   6.327475e-01

Photon flux (15-150 keV)    in 0.488 sec:  (    ) ph/cm2/s
Energy fluence (15-150 keV)             : 2.79403e-08 ( 0  0 ) ergs/cm2
Single BB

Spectral model blackbody:
------------------------------------------------------------
Parameters  : value    Lower 90%  Upper 90%
kT [keV]    : 10.5524  (-2.03354  2.44377)
R^2/D10^2   : 0.390312  (-0.209335   0.467289)
(R is the radius in km and D10 is the distance to the source in units of 10 kpc)
------------------------------------------------------------
#Fit statistic : Chi-Squared =          54.71 using 59 PHA bins.
# Reduced chi-squared =         0.9598 for     57 degrees of freedom
# Null hypothesis probability =   5.615959e-01

Energy  Fluence     90% Error
[keV]   [erg/cm2]   [erg/cm2]
15- 25  4.390e-09   1.366e-09
25- 50  1.175e-08   3.777e-09
50-150  7.153e-09   2.981e-09
15-150  2.330e-08   6.454e-09
Thermal bremsstrahlung (OTTB)

Spectral model: thermal bremsstrahlung
------------------------------------------------------------
Parameters  : value         Lower 90%    Upper 90%
kT [keV]    : 78.4601       (-33.0276      86.2336)
Norm        : 4.66344       (-1.05779     1.39641)
------------------------------------------------------------
#Fit statistic : Chi-Squared =          51.39 using 59 PHA bins.
# Reduced chi-squared =         0.9015 for     57 degrees of freedom
# Null hypothesis probability =   6.848156e-01

Energy  Fluence     90% Error
[keV]   [erg/cm2]   [erg/cm2]
15- 25  5.897e-09   1.556e-09
25- 50  9.662e-09   2.562e-09
50-150  1.346e-08   9.433e-09
15-150  2.902e-08   1.111e-08
Double BB

Spectral model: bbodyrad<1> + bbodyrad<2>
------------------------------------------------------------
Parameters  : value         Lower 90%    Upper 90%
kT1 [keV]   : 5.19705        (-2.71141      -5.21372)
R1^2/D10^2  : 2.87710        (-2.42756      55.6398)
kT2 [keV]   : 15.2339        (-4.73855      -15.2501)
R2^2/D10^2  : 7.50201E-02    (-0.074445   0.165839)
------------------------------------------------------------
#Fit statistic : Chi-Squared =          50.41 using 59 PHA bins.
# Reduced chi-squared =         0.9166 for     55 degrees of freedom
# Null hypothesis probability =   6.503649e-01

Energy  Fluence     90% Error
[keV]   [erg/cm2]   [erg/cm2]
15- 25  5.750e-09   3.128e-09
25- 50  1.000e-08   4.978e-09
50-150  1.151e-08   6.956e-09
15-150  2.726e-08   1.435e-08
Peak spectrum fit
Power-law model

Time interval is from   -0.282 sec. to    0.718 sec.

Spectral model in power-law:
------------------------------------------------------------
Parameters  : value       lower 90%   higher 90%
Photon index: 1.94013     ( -0.335688   0.372436 )
Norm@50keV  : 3.72782E-03    ( -0.000997297   0.000975628 )
------------------------------------------------------------
#Fit statistic : Chi-Squared =          48.99 using 59 PHA bins.
# Reduced chi-squared =         0.8596 for     57 degrees of freedom
# Null hypothesis probability =   7.657147e-01

Photon flux (15-150 keV)    in 1 sec: 0.544318 ( -0.113164  0.113217 ) ph/cm2/s
Energy fluence (15-150 keV)             : 3.42881e-08 ( -8.63856e-09  9.08966e-09 ) ergs/cm2
Cutoff power-law model

Time interval is from   -0.282 sec. to    0.718 sec.
Spectral model in the cutoff power-law:
------------------------------------------------------------
Parameters  : value       lower 90%   higher 90%
Photon index: -0.303799     ( -2.89074   1.82403 )
Epeak [keV] : 38.9168      ( -8.98895 15.3021 )
Norm@50keV  : 8.85988E-02    ( -0.108104   7.42504 )
------------------------------------------------------------
#Fit statistic : Chi-Squared =          43.69 using 59 PHA bins.
# Reduced chi-squared =         0.7802 for     56 degrees of freedom
# Null hypothesis probability =   8.842854e-01

Photon flux (15-150 keV)    in 1 sec: 0.522832 ( -0.109731  0.111343 ) ph/cm2/s
Energy fluence (15-150 keV)             : 2.84762e-08 ( -7.2915e-09  8.9646e-09 ) ergs/cm2
Band function

Time interval is from   -0.282 sec. to    0.718 sec.

Spectral model in the Band function:
------------------------------------------------------------
Parameters  : value       lower 90%   higher 90%
alpha       : 5.00000   ( -6.40121   -5 )
beta        : -2.51907    ( -1.29858   0.565719 )
Epeak [keV] : 27.1935      ( -6.29922 5.85982 )
Norm@50keV   : 391.795    ( -77.255   1677.47 )
------------------------------------------------------------
#Fit statistic : Chi-Squared =          43.34 using 59 PHA bins.
# Reduced chi-squared =         0.7881 for     55 degrees of freedom
# Null hypothesis probability =   8.720985e-01

Photon flux (15-150 keV)    in 1 sec: 0.525233 ( 6.47477  -0.11156 ) ph/cm2/s
Energy fluence (15-150 keV)             : 0 ( 0  0 ) ergs/cm2
Single BB

Spectral model blackbody:
------------------------------------------------------------
Parameters  : value    Lower 90%  Upper 90%
kT [keV]    : 9.65584  (-1.8723  2.28637)
R^2/D10^2   : 0.316476  (-0.175712   0.393919)
(R is the radius in km and D10 is the distance to the source in units of 10 kpc)
------------------------------------------------------------
#Fit statistic : Chi-Squared =          44.35 using 59 PHA bins.
# Reduced chi-squared =         0.7781 for     57 degrees of freedom
# Null hypothesis probability =   8.891136e-01

Energy  Fluence     90% Error
[keV]   [erg/cm2]   [erg/cm2]
15- 25  5.932e-09   2.224e-09
25- 50  1.402e-08   5.106e-09
50-150  6.608e-09   3.701e-09
15-150  2.656e-08   8.990e-09
Thermal bremsstrahlung (OTTB)

Spectral model: thermal bremsstrahlung
------------------------------------------------------------
Parameters  : value         Lower 90%    Upper 90%
kT [keV]    : 62.5600       (-26.3169      65.8563)
Norm        : 2.87578       (-0.780995     1.06263)
------------------------------------------------------------
#Fit statistic : Chi-Squared =          46.05 using 59 PHA bins.
# Reduced chi-squared =         0.8078 for     57 degrees of freedom
# Null hypothesis probability =   8.500347e-01

Energy  Fluence     90% Error
[keV]   [erg/cm2]   [erg/cm2]
15- 25  7.274e-09   2.192e-09
25- 50  1.121e-08   3.374e-09
50-150  1.320e-08   8.701e-09
15-150  3.169e-08   1.391e-08
Double BB

Spectral model: bbodyrad<1> + bbodyrad<2>
------------------------------------------------------------
Parameters  : value         Lower 90%    Upper 90%
kT1 [keV]   : 6.25840        (-6.28561      -6.28561)
R1^2/D10^2  : 0.765639        (-0.742173      -0.742173)
kT2 [keV]   : 12.9975        (-13.1433      -13.1433)
R2^2/D10^2  : 6.75215E-02    (-0.0617269   0.546582)
------------------------------------------------------------
#Fit statistic : Chi-Squared =          43.43 using 59 PHA bins.
# Reduced chi-squared =         0.7896 for     55 degrees of freedom
# Null hypothesis probability =   8.701996e-01

Energy  Fluence     90% Error
[keV]   [erg/cm2]   [erg/cm2]
15- 25  6.642e-09   4.735e-09
25- 50  1.294e-08   8.620e-09
50-150  9.397e-09   6.965e-09
15-150  2.898e-08   1.705e-08
Pre-slew spectrum (Pre-slew PHA with pre-slew DRM)
Power-law model
Spectral model in power-law:
------------------------------------------------------------
Parameters  : value       lower 90%   higher 90%
Photon index: 1.86112     ( -0.29613   0.323942 )
Norm@50keV  : 6.88163E-03    ( -0.00152562   0.00147839 )
------------------------------------------------------------
#Fit statistic : Chi-Squared =          53.11 using 59 PHA bins.
# Reduced chi-squared =         0.9318 for     57 degrees of freedom
# Null hypothesis probability =   6.216334e-01

Photon flux (15-150 keV)    in 0.488 sec: 0.971684 ( -0.171429  0.171432 ) ph/cm2/s
Energy fluence (15-150 keV)             : 3.08751e-08 ( -6.63475e-09  6.88383e-09 ) ergs/cm2
Cutoff power-law model
Spectral model in the cutoff power-law:
------------------------------------------------------------
Parameters  : value       lower 90%   higher 90%
Photon index: 0.679912     ( -1.82232   1.31019 )
Epeak [keV] : 45.8537      ( -17.1098 -45.8482 )
Norm@50keV  : 3.39444E-02    ( -0.0339871   0.382066 )
------------------------------------------------------------
#Fit statistic : Chi-Squared =          50.88 using 59 PHA bins.
# Reduced chi-squared =         0.9086 for     56 degrees of freedom
# Null hypothesis probability =   6.685518e-01

Photon flux (15-150 keV)    in 0.488 sec: 0.943736 ( -0.172613  0.173954 ) ph/cm2/s
Energy fluence (15-150 keV)             : 2.76946e-08 ( -6.66418e-09  7.61514e-09 ) ergs/cm2
Band function

Spectral model in the Band function:
------------------------------------------------------------
Parameters  : value       lower 90%   higher 90%
alpha       : -0.678883   ( 1.06664   0.64519 )
beta        : -10.00000    ( 10   9.44244e-10 )
Epeak [keV] : 45.8383      ( -13.2937 -45.8383 )
Norm@50keV   : 3.39935E-02    ( -0.00592106   0.38253 )
------------------------------------------------------------
#Fit statistic : Chi-Squared =          50.88 using 59 PHA bins.
# Reduced chi-squared =         0.9251 for     55 degrees of freedom
# Null hypothesis probability =   6.327475e-01

Photon flux (15-150 keV)    in 0.488 sec:  (    ) ph/cm2/s
Energy fluence (15-150 keV)             : 2.79403e-08 ( 0  0 ) ergs/cm2
S(25-50 keV) vs. S(50-100 keV) plot
S(25-50 keV)  = 8.89e-09
S(50-100 keV) = 9.79e-09
T90 vs. Hardness ratio plot

T90                                   = 0.432000011205673 sec.
Hardness ratio (energy fluence ratio) = 1.10124
Color vs. Color plot
Count Ratio  (25-50 keV) / (15-25 keV) = 0.982839
Count Ratio (50-100 keV) / (15-25 keV) = 0.58276
Mask shadow pattern
IMX = 2.590083416516621E-01, IMY = -1.706787245475634E-01
TIME vs. PHA plot around the trigger time

Blue+Cyan dotted lines: Time interval of the scaled map
From 0.000000 to 0.512000
TIME vs. DetID plot around the trigger time

Blue+Cyan dotted lines: Time interval of the scaled map
From 0.000000 to 0.512000
100 us light curve (15-350 keV)
Blue+Cyan dotted lines: Time interval of the scaled map
From 0.000000 to 0.512000
Spacecraft aspect plot

Bright source in the pre-burst/pre-slew/post-slew images
Pre-burst image of 15-350 keV band
Time interval of the image:
-239.320000 -0.028000

# RAcent  DECcent POSerr Theta    Phi  PeakCts   SNR AngSep     Name
#  [deg]    [deg]    ['] [deg]  [deg]                   [']
352.2981  21.1616    2.6  46.3  138.4   2.6501   4.4 ------	UNKNOWN
 40.5937 -45.9086    2.1  44.2    8.6   1.3562   5.5 ------	UNKNOWN
 51.6974 -52.0151    2.3  52.2    1.7   1.9803   5.0 ------	UNKNOWN
 70.5903 -44.2242    2.1  53.5  -16.8   2.2608   5.5 ------	UNKNOWN
 56.7410  49.1281    3.3  55.2 -145.4   3.7331   3.5 ------	UNKNOWN
Pre-slew background subtracted image of 15-350 keV band
Time interval of the image:
-0.028000 0.460000

# RAcent  DECcent POSerr Theta    Phi  PeakCts   SNR AngSep     Name
#  [deg]    [deg]    ['] [deg]  [deg]                   [']
357.5338  10.9544    3.0  37.8  127.1   0.0574   3.8 ------	UNKNOWN
 27.8221 -18.6069    1.2  17.2   33.4   0.0624   9.5 ------	UNKNOWN
 60.6673  12.2643    2.4  30.9 -102.6   0.0440   4.8 ------	UNKNOWN
 67.8758  25.9324    1.8  43.8 -116.3   0.1554   6.4 ------	UNKNOWN
Post-slew image of 15-350 keV band
Time interval of the image:
55.780650 938.580610

# RAcent  DECcent POSerr Theta    Phi  PeakCts   SNR AngSep     Name
#  [deg]    [deg]    ['] [deg]  [deg]                   [']
 78.9924 -61.7347    3.1  55.8   -9.1   4.4029   3.7 ------	UNKNOWN
 23.8223  40.2677    3.5  59.0 -166.1   9.0244   3.3 ------	UNKNOWN
Plot creation:
Sun May 31 09:38:41 EDT 2015