Click here for the BAT GCN circular template
Image
Pre-slew 15.0-350.0 keV image (Event data)
#   RAcent    DECcent   POSerr    Theta     Phi              Peak Cts       SNR   Name
  328.5844   -15.7430   0.0162    26.3413   107.6686         0.2899573     11.939 TRIG_00286574

Foreground time interval of the image:
 -0.144   2.984 (delta_t =   3.128 [sec])
Background time interval of the image:
-239.800  -0.144 (delta_t = 239.656 [sec])
Lightcurves
Notes:
- 1) The mask-weighted light curves are using the flight position.
- 2) Multiple plots of different time binning/intervals are shown to cover all scenarios of short/long GRBs, rate/image triggers, and real/false positives.
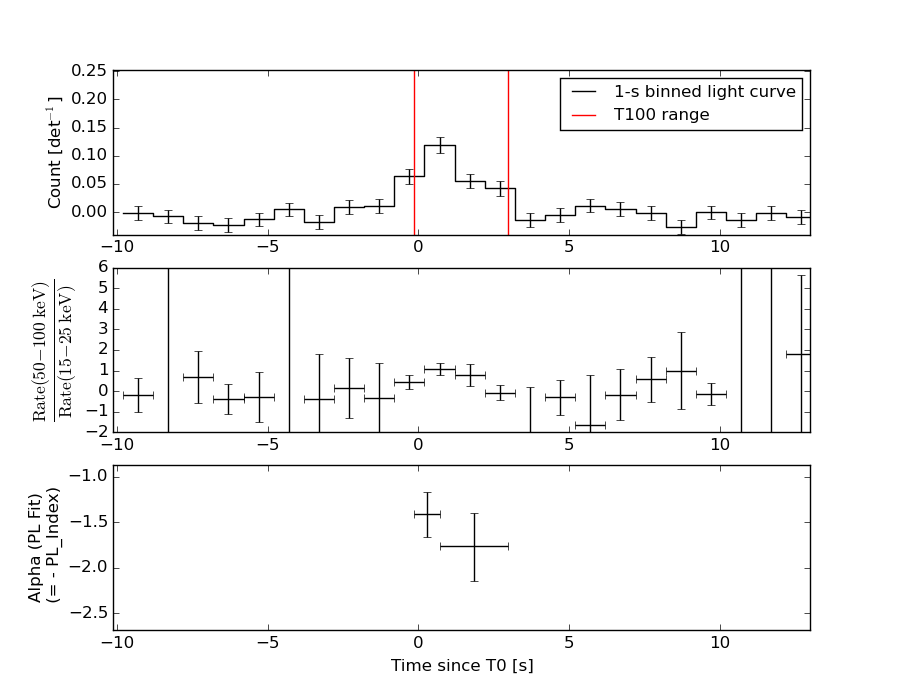
- 3) For all the mask-weighted lightcurves, the y-axis units are counts/sec/det where a det is 0.4 x 0.4 = 0.16 sq cm.
- 4) The verticle lines correspond to following: green dotted lines are T50 interval, black dotted lines are T90 interval, blue solid line(s) is a spacecraft slew start time, and orange solid line(s) is a spacecraft slew end time.
- 5) Time of each bin is in the middle of the bin.
1 s binning
From T0-310 s to T0+310 s
From T100_start - 20 s to T100_end + 30 s
Full time interval
64 ms binning
Full time interval
From T100_start to T100_end
From T0-5 sec to T0+5 sec

16 ms binning
From T100_start-5 s to T100_start+5 s
8 ms binning
From T100_start-3 s to T100_start+3 s
2 ms binning
From T100_start-1 s to T100_start+1 s
SN=5 or 10 sec. binning (whichever binning is satisfied first)
SN=5 or 10 sec. binning (T < 200 sec)
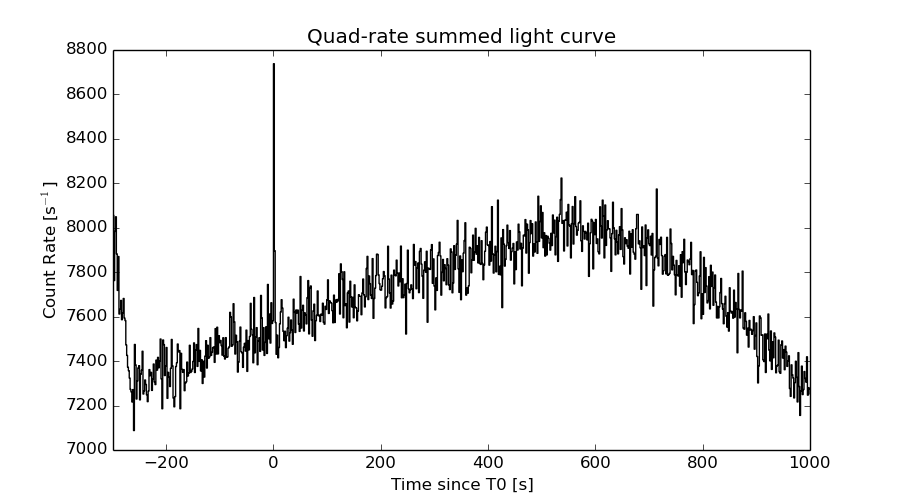
Quad-rate summed light curves (from T0-300s to T0+1000s)
Spectral Evolution
Spectra
Notes:
- 1) The fitting includes the systematic errors.
- 2) When the burst includes telescope slew time periods, the fitting uses an average response file made from multiple 5-s response files through out the slew time plus single time preiod for the non-slew times, and weighted by the total counts in the corresponding time period using addrmf. An average response file is needed becuase a spectral fit using the pre-slew DRM will introduce some errors in both a spectral shape and a normalization if the PHA file contains a lot of the slew/post-slew time interval.
- 3) For fits to more complicated models (e.g. a power-law over a cutoff power-law), the BAT team has decided to require a chi-square improvement of more than 6 for each extra dof.
Time averaged spectrum fit using the average DRM
Power-law model
Time interval is from   -0.144 sec. to    2.984 sec.

Spectral model in power-law:
------------------------------------------------------------
Parameters  : value       lower 90%   higher 90%
Photon index: 1.58412     ( -0.221664   0.228665 )
Norm@50keV  : 5.68834E-03    ( -0.000834614   0.00082301 )
------------------------------------------------------------
#Fit statistic : Chi-Squared =          48.44 using 59 PHA bins.
# Reduced chi-squared =         0.8498 for     57 degrees of freedom
# Null hypothesis probability =   7.830204e-01

Photon flux (15-150 keV)    in 3.128 sec: 0.727431 ( -0.0983089  0.0983434 ) ph/cm2/s
Energy fluence (15-150 keV)             : 1.66731e-07 ( -2.61701e-08  2.6676e-08 ) ergs/cm2
Cutoff power-law model
Time interval is from   -0.144 sec. to    2.984 sec.
Spectral model in the cutoff power-law:
------------------------------------------------------------
Parameters  : value       lower 90%   higher 90%
Photon index: 0.553656     ( -1.25179   1.02093 )
Epeak [keV] : 64.3323      ( -15.7167 171.089 )
Norm@50keV  : 2.05905E-02    ( -0.0205905   0.0768661 )
------------------------------------------------------------
#Fit statistic : Chi-Squared =          44.98 using 59 PHA bins.
# Reduced chi-squared =         0.8032 for     56 degrees of freedom
# Null hypothesis probability =   8.542628e-01

Photon flux (15-150 keV)    in 3.128 sec: 0.703453 ( -0.101029  0.100941 ) ph/cm2/s
Energy fluence (15-150 keV)             : 1.52891e-07 ( -2.8051e-08  2.95121e-08 ) ergs/cm2
Band function
Time interval is from   -0.144 sec. to    2.984 sec.

Spectral model in the Band function:
------------------------------------------------------------
Parameters  : value       lower 90%   higher 90%
alpha       : -0.677062   ( -0.838622   1.24879 )
beta        : -9.37102    ( 9.37153   19.3715 )
Epeak [keV] : 68.4514      ( -18.5434 142.517 )
Norm@50keV   : 1.73683E-02    ( -0.00556324   7.907 )
------------------------------------------------------------
#Fit statistic : Chi-Squared =          45.03 using 59 PHA bins.
# Reduced chi-squared =         0.8188 for     55 degrees of freedom
# Null hypothesis probability =   8.289027e-01

Photon flux (15-150 keV)    in 3.128 sec: 0.708294 (    ) ph/cm2/s
Energy fluence (15-150 keV)             : 1.54206e-07 ( 0  0 ) ergs/cm2
Single BB
Spectral model blackbody:
------------------------------------------------------------
Parameters  : value    Lower 90%  Upper 90%
kT [keV]    : 13.0754  (-1.89784  2.27217)
R^2/D10^2   : 0.137131  (-0.0600248   0.103203)
(R is the radius in km and D10 is the distance to the source in units of 10 kpc)
------------------------------------------------------------
#Fit statistic : Chi-Squared =          51.15 using 59 PHA bins.
# Reduced chi-squared =         0.8973 for     57 degrees of freedom
# Null hypothesis probability =   6.932652e-01

Energy  Fluence     90% Error
[keV]   [erg/cm2]   [erg/cm2]
15- 25  1.555e-08   4.015e-09
25- 50  5.390e-08   1.068e-08
50-150  5.845e-08   1.680e-08
15-150  1.279e-07   2.260e-08
Thermal bremsstrahlung (OTTB)
Spectral model: thermal bremsstrahlung
------------------------------------------------------------
Parameters  : value         Lower 90%    Upper 90%
kT [keV]    : 167.541       (-77.8151      -166.002)
Norm        : 3.01118       (-0.417298     0.52472)
------------------------------------------------------------
#Fit statistic : Chi-Squared =          46.43 using 59 PHA bins.
# Reduced chi-squared =         0.8145 for     57 degrees of freedom
# Null hypothesis probability =   8.403191e-01

Energy  Fluence     90% Error
[keV]   [erg/cm2]   [erg/cm2]
15- 25  2.394e-08   1.344e-08
25- 50  4.507e-08   2.460e-08
50-150  9.293e-08   5.297e-08
15-150  1.619e-07   8.929e-08
Double BB
Spectral model: bbodyrad<1> + bbodyrad<2>
------------------------------------------------------------
Parameters  : value         Lower 90%    Upper 90%
kT1 [keV]   : 6.81838        (-3.83824      84.7424)
R1^2/D10^2  : 0.718859        (-0.552985      14.7158)
kT2 [keV]   : 19.7615        (-6.21705      71.4942)
R2^2/D10^2  : 2.32407E-02    (-0.0230719   0.0508467)
------------------------------------------------------------
#Fit statistic : Chi-Squared =          45.02 using 59 PHA bins.
# Reduced chi-squared =         0.8185 for     55 degrees of freedom
# Null hypothesis probability =   8.294144e-01

Energy  Fluence     90% Error
[keV]   [erg/cm2]   [erg/cm2]
15- 25  2.183e-08   1.217e-08
25- 50  4.841e-08   2.567e-08
50-150  8.172e-08   4.728e-08
15-150  1.520e-07   7.826e-08
Peak spectrum fit
Power-law model

Time interval is from   -0.144 sec. to    0.856 sec.

Spectral model in power-law:
------------------------------------------------------------
Parameters  : value       lower 90%   higher 90%
Photon index: 1.32702     ( -0.248783   0.250907 )
Norm@50keV  : 9.87735E-03    ( -0.00151206   0.00150582 )
------------------------------------------------------------
#Fit statistic : Chi-Squared =          49.25 using 59 PHA bins.
# Reduced chi-squared =         0.8640 for     57 degrees of freedom
# Null hypothesis probability =   7.576875e-01

Photon flux (15-150 keV)    in 1 sec: 1.18446 ( -0.179921  0.180091 ) ph/cm2/s
Energy fluence (15-150 keV)             : 9.69781e-08 ( -1.65708e-08  1.68135e-08 ) ergs/cm2
Cutoff power-law model
Time interval is from   -0.144 sec. to    0.856 sec.
Spectral model in the cutoff power-law:
------------------------------------------------------------
Parameters  : value       lower 90%   higher 90%
Photon index: 0.535724     ( -1.24068   0.894742 )
Epeak [keV] : 95.8426      ( -34.6993 -95.8433 )
Norm@50keV  : 2.42456E-02    ( -0.0151384   0.0689704 )
------------------------------------------------------------
#Fit statistic : Chi-Squared =          47.30 using 59 PHA bins.
# Reduced chi-squared =         0.8447 for     56 degrees of freedom
# Null hypothesis probability =   7.894786e-01

Photon flux (15-150 keV)    in 1 sec: 1.15323 ( -0.184907  0.18446 ) ph/cm2/s
Energy fluence (15-150 keV)             : 9.25873e-08 ( -1.75444e-08  1.78157e-08 ) ergs/cm2
Band function

Time interval is from   -0.144 sec. to    0.856 sec.

Spectral model in the Band function:
------------------------------------------------------------
Parameters  : value       lower 90%   higher 90%
alpha       : -0.535455   ( -0.698802   0.741554 )
beta        : -10.0000    ( 10   20 )
Epeak [keV] : 95.8094      ( -29.6467 -95.8094 )
Norm@50keV   : 2.42536E-02    ( -0.0151429   0.069143 )
------------------------------------------------------------
#Fit statistic : Chi-Squared =          47.30 using 59 PHA bins.
# Reduced chi-squared =         0.8601 for     55 degrees of freedom
# Null hypothesis probability =   7.601151e-01

Photon flux (15-150 keV)    in 1 sec:  (    ) ph/cm2/s
Energy fluence (15-150 keV)             : 9.45456e-08 ( 0  0 ) ergs/cm2
Single BB
Spectral model blackbody:
------------------------------------------------------------
Parameters  : value    Lower 90%  Upper 90%
kT [keV]    : 16.9865  (-2.86522  3.56183)
R^2/D10^2   : 9.41038E-02  (-0.0446656   0.081196)
(R is the radius in km and D10 is the distance to the source in units of 10 kpc)
------------------------------------------------------------
#Fit statistic : Chi-Squared =          53.01 using 59 PHA bins.
# Reduced chi-squared =         0.9300 for     57 degrees of freedom
# Null hypothesis probability =   6.253939e-01

Energy  Fluence     90% Error
[keV]   [erg/cm2]   [erg/cm2]
15- 25  5.531e-09   1.786e-09
25- 50  2.446e-08   6.435e-09
50-150  5.037e-08   1.532e-08
15-150  8.036e-08   1.730e-08
Thermal bremsstrahlung (OTTB)
Spectral model: thermal bremsstrahlung
------------------------------------------------------------
Parameters  : value         Lower 90%    Upper 90%
kT [keV]    : 200.000       (      )
Norm        : 4.87587       (-0.736726     0.736702)
------------------------------------------------------------
#Fit statistic : Chi-Squared =          50.30 using 59 PHA bins.
# Reduced chi-squared =         0.8825 for     57 degrees of freedom
# Null hypothesis probability =   7.226190e-01

Energy  Fluence     90% Error
[keV]   [erg/cm2]   [erg/cm2]
15- 25  1.214e-08   6.890e-09
25- 50  2.336e-08   1.313e-08
50-150  5.122e-08   2.878e-08
15-150  8.672e-08   4.801e-08
Double BB

Spectral model: bbodyrad<1> + bbodyrad<2>
------------------------------------------------------------
Parameters  : value         Lower 90%    Upper 90%
kT1 [keV]   : 5.56565        (-2.65212      5.92913)
R1^2/D10^2  : 1.90446        (-1.70023      28.0386)
kT2 [keV]   : 21.9823        (-5.18425      15.4575)
R2^2/D10^2  : 3.45314E-02    (-0.0300757   0.0600102)
------------------------------------------------------------
#Fit statistic : Chi-Squared =          46.52 using 59 PHA bins.
# Reduced chi-squared =         0.8458 for     55 degrees of freedom
# Null hypothesis probability =   7.852407e-01

Energy  Fluence     90% Error
[keV]   [erg/cm2]   [erg/cm2]
15- 25  1.007e-08   5.497e-09
25- 50  2.221e-08   1.147e-08
50-150  5.934e-08   3.499e-08
15-150  9.162e-08   4.697e-08
Pre-slew spectrum (Pre-slew PHA with pre-slew DRM)
Power-law model

Spectral model in power-law:
------------------------------------------------------------
Parameters  : value       lower 90%   higher 90%
Photon index: 1.58412     ( -0.221664   0.228665 )
Norm@50keV  : 5.68834E-03    ( -0.000834614   0.00082301 )
------------------------------------------------------------
#Fit statistic : Chi-Squared =          48.44 using 59 PHA bins.
# Reduced chi-squared =         0.8498 for     57 degrees of freedom
# Null hypothesis probability =   7.830204e-01

Photon flux (15-150 keV)    in 3.128 sec: 0.727431 ( -0.0983089  0.0983434 ) ph/cm2/s
Energy fluence (15-150 keV)             : 1.66731e-07 ( -2.61701e-08  2.6676e-08 ) ergs/cm2
Cutoff power-law model

Spectral model in the cutoff power-law:
------------------------------------------------------------
Parameters  : value       lower 90%   higher 90%
Photon index: 0.553656     ( -1.25179   1.02093 )
Epeak [keV] : 64.3323      ( -15.7167 171.089 )
Norm@50keV  : 2.05905E-02    ( -0.0205905   0.0768661 )
------------------------------------------------------------
#Fit statistic : Chi-Squared =          44.98 using 59 PHA bins.
# Reduced chi-squared =         0.8032 for     56 degrees of freedom
# Null hypothesis probability =   8.542628e-01

Photon flux (15-150 keV)    in 3.128 sec: 0.703453 ( -0.101029  0.100941 ) ph/cm2/s
Energy fluence (15-150 keV)             : 1.52891e-07 ( -2.8051e-08  2.95121e-08 ) ergs/cm2
Band function

Spectral model in the Band function:
------------------------------------------------------------
Parameters  : value       lower 90%   higher 90%
alpha       : -0.677062   ( -0.838622   1.24879 )
beta        : -9.37102    ( 9.37153   19.3715 )
Epeak [keV] : 68.4514      ( -18.5434 144.138 )
Norm@50keV   : 1.73683E-02    ( -0.00556324   7.90809 )
------------------------------------------------------------
#Fit statistic : Chi-Squared =          45.03 using 59 PHA bins.
# Reduced chi-squared =         0.8188 for     55 degrees of freedom
# Null hypothesis probability =   8.289027e-01

Photon flux (15-150 keV)    in 3.128 sec: 0.708294 (    ) ph/cm2/s
Energy fluence (15-150 keV)             : 1.54206e-07 ( 0  0 ) ergs/cm2
S(25-50 keV) vs. S(50-100 keV) plot

S(25-50 keV)  = 4.29e-08
S(50-100 keV) = 5.72e-08
T90 vs. Hardness ratio plot
T90                                   = 2.85600000619888 sec.
Hardness ratio (energy fluence ratio) = 1.33333
Color vs. Color plot
Count Ratio  (25-50 keV) / (15-25 keV) = 1.36996
Count Ratio (50-100 keV) / (15-25 keV) = 0.894241
Mask shadow pattern
IMX = -1.502765794764963E-01, IMY = -4.717709638029596E-01
TIME vs. PHA plot around the trigger time
TIME vs. DetID plot around the trigger time
100 us light curve (15-350 keV)
Spacecraft aspect plot
Bright source in the pre-burst/pre-slew/post-slew images
Pre-burst image of 15-350 keV band
Time interval of the image:
-239.800000 -0.144000

# RAcent  DECcent POSerr Theta    Phi  PeakCts   SNR AngSep     Name
#  [deg]    [deg]    ['] [deg]  [deg]                   [']
264.5831 -44.3262    6.9  50.7    4.8  -0.7179  -1.7   10.1	4U 1735-44
275.9221 -30.3658  247.3  48.8   26.5   0.0278   0.0    0.2	H1820-303
284.9196 -24.9767    5.0  45.0   38.5   1.1140   2.3    7.2	HT1900.1-2455
314.6236  -9.9910    2.7  36.5   86.8   1.8460   4.3 ------	UNKNOWN
292.2061 -54.0524    2.9  31.4   -5.3   0.7201   3.9 ------	UNKNOWN
257.4767 -71.4587    2.3  47.6  -31.4   1.7165   5.1 ------	UNKNOWN
 39.1483 -37.4608    2.3  48.0 -129.0   3.8366   5.0 ------	UNKNOWN
Pre-slew background subtracted image of 15-350 keV band
Time interval of the image:
-0.144000 2.984000

# RAcent  DECcent POSerr Theta    Phi  PeakCts   SNR AngSep     Name
#  [deg]    [deg]    ['] [deg]  [deg]                   [']
264.7929 -44.3729    4.3  50.5    4.8  -0.1198  -2.7    5.1	4U 1735-44
275.8684 -30.3730    7.0  48.9   26.4   0.1090   1.7    2.9	H1820-303
285.1607 -24.9237    4.6  44.8   38.8   0.1349   2.5    6.8	HT1900.1-2455
328.5844 -15.7430    1.0  26.3  107.7   0.2899  11.9 ------	UNKNOWN
 13.2053   0.9002    2.6  54.1  172.1   0.2947   4.4 ------	UNKNOWN
  7.3848  -9.7626    2.9  42.0  174.0   0.1030   3.9 ------	UNKNOWN
Post-slew image of 15-350 keV band
Time interval of the image:
917.500600 962.285300

# RAcent  DECcent POSerr Theta    Phi  PeakCts   SNR AngSep     Name
#  [deg]    [deg]    ['] [deg]  [deg]                   [']
357.3924  14.1044    2.2  52.9  157.5   1.5658   5.3 ------	UNKNOWN
 14.1628  12.7459    2.7  55.5  177.5   1.0653   4.3 ------	UNKNOWN
257.6414 -85.1682    2.6  52.0  -23.7   0.7157   4.5 ------	UNKNOWN
 39.7542  -7.6745    2.8  53.2 -142.2   1.2799   4.1 ------	UNKNOWN
Plot creation:
Sun May 31 09:33:57 EDT 2015