Click here for the BAT GCN circular template
Image
Pre-slew 15.0-350.0 keV image (Event data)

#   RAcent    DECcent   POSerr    Theta     Phi              Peak Cts       SNR   Name
   36.9042   -55.5177   0.0169    25.4461    28.4818         0.5170895     11.357 TRIG_00286809

Foreground time interval of the image:
  4.804  22.768 (delta_t =  17.964 [sec])
Background time interval of the image:
-134.499   4.804 (delta_t = 139.303 [sec])
Lightcurves
Notes:
- 1) The mask-weighted light curves are using the flight position.
- 2) Multiple plots of different time binning/intervals are shown to cover all scenarios of short/long GRBs, rate/image triggers, and real/false positives.
- 3) For all the mask-weighted lightcurves, the y-axis units are counts/sec/det where a det is 0.4 x 0.4 = 0.16 sq cm.
- 4) The verticle lines correspond to following: green dotted lines are T50 interval, black dotted lines are T90 interval, blue solid line(s) is a spacecraft slew start time, and orange solid line(s) is a spacecraft slew end time.
- 5) Time of each bin is in the middle of the bin.
1 s binning
From T0-310 s to T0+310 s
From T100_start - 20 s to T100_end + 30 s

Full time interval

64 ms binning
Full time interval

From T100_start to T100_end

From T0-5 sec to T0+5 sec
16 ms binning
From T100_start-5 s to T100_start+5 s
Blue+Cyan dotted lines: Time interval of the scaled map
From 0.000000 to 64.000000
8 ms binning
From T100_start-3 s to T100_start+3 s

Blue+Cyan dotted lines: Time interval of the scaled map
From 0.000000 to 64.000000
2 ms binning
From T100_start-1 s to T100_start+1 s
Blue+Cyan dotted lines: Time interval of the scaled map
From 0.000000 to 64.000000
SN=5 or 10 sec. binning (whichever binning is satisfied first)

SN=5 or 10 sec. binning (T < 200 sec)

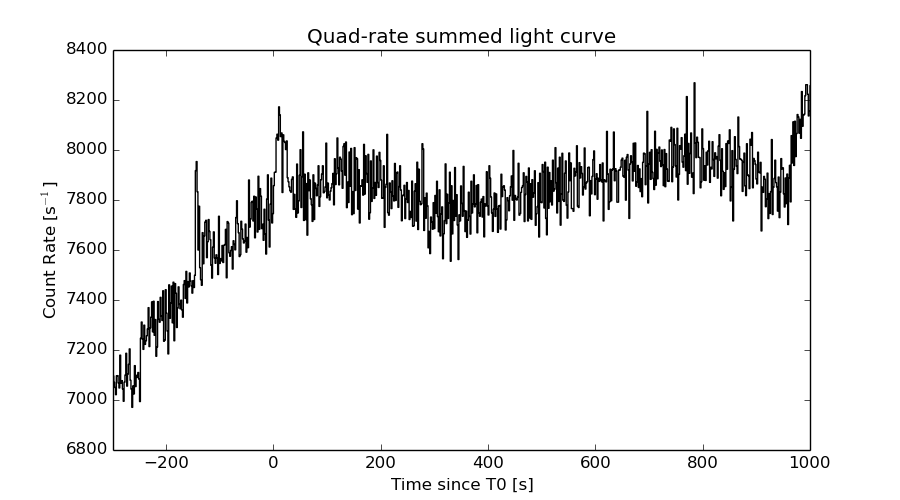
Quad-rate summed light curves (from T0-300s to T0+1000s)
Spectral Evolution

Spectra
Notes:
- 1) The fitting includes the systematic errors.
- 2) When the burst includes telescope slew time periods, the fitting uses an average response file made from multiple 5-s response files through out the slew time plus single time preiod for the non-slew times, and weighted by the total counts in the corresponding time period using addrmf. An average response file is needed becuase a spectral fit using the pre-slew DRM will introduce some errors in both a spectral shape and a normalization if the PHA file contains a lot of the slew/post-slew time interval.
- 3) For fits to more complicated models (e.g. a power-law over a cutoff power-law), the BAT team has decided to require a chi-square improvement of more than 6 for each extra dof.
Time averaged spectrum fit using the average DRM
Power-law model

Time interval is from    4.804 sec. to   22.768 sec.

Spectral model in power-law:
------------------------------------------------------------
Parameters  : value       lower 90%   higher 90%
Photon index: 1.75011     ( -0.246435   0.258453 )
Norm@50keV  : 1.68463E-03    ( -0.000275859   0.000269354 )
------------------------------------------------------------
#Fit statistic : Chi-Squared =          54.98 using 59 PHA bins.
# Reduced chi-squared =         0.9646 for     57 degrees of freedom
# Null hypothesis probability =   5.512148e-01

Photon flux (15-150 keV)    in 17.96 sec: 0.227799 ( -0.0320891  0.0320999 ) ph/cm2/s
Energy fluence (15-150 keV)             : 2.79181e-07 ( -4.6559e-08  4.7733e-08 ) ergs/cm2
Cutoff power-law model
Time interval is from    4.804 sec. to   22.768 sec.
Spectral model in the cutoff power-law:
------------------------------------------------------------
Parameters  : value       lower 90%   higher 90%
Photon index: 1.03880     ( -1.49318   0.560724 )
Epeak [keV] : 58.2935      (   )
Norm@50keV  : 4.25380E-03    (     )
------------------------------------------------------------
#Fit statistic : Chi-Squared =          53.81 using 59 PHA bins.
# Reduced chi-squared =         0.9609 for     56 degrees of freedom
# Null hypothesis probability =   5.581228e-01

Photon flux (15-150 keV)    in 17.96 sec: 0.221603 ( -0.033646  0.033548 ) ph/cm2/s
Energy fluence (15-150 keV)             : 2.5878e-07 ( -5.3871e-08  5.71308e-08 ) ergs/cm2
Band function

Time interval is from    4.804 sec. to   22.768 sec.

Spectral model in the Band function:
------------------------------------------------------------
Parameters  : value       lower 90%   higher 90%
alpha       : -0.351871   ( 0.481696   0.481696 )
beta        : -2.16687    ( 2.17163   0.556405 )
Epeak [keV] : 43.9278      ( -43.3573 206.504 )
Norm@50keV   : 1.19289E-02    ( -0.0137151   45.0661 )
------------------------------------------------------------
#Fit statistic : Chi-Squared =          53.15 using 59 PHA bins.
# Reduced chi-squared =         0.9664 for     55 degrees of freedom
# Null hypothesis probability =   5.456508e-01

Photon flux (15-150 keV)    in 17.96 sec:  (    ) ph/cm2/s
Energy fluence (15-150 keV)             : 2.62963e-07 ( 0  0 ) ergs/cm2
Single BB

Spectral model blackbody:
------------------------------------------------------------
Parameters  : value    Lower 90%  Upper 90%
kT [keV]    : 11.1404  (-1.66316  2.03874)
R^2/D10^2   : 7.34953E-02  (-0.0342303   0.0604926)
(R is the radius in km and D10 is the distance to the source in units of 10 kpc)
------------------------------------------------------------
#Fit statistic : Chi-Squared =          60.25 using 59 PHA bins.
# Reduced chi-squared =          1.057 for     57 degrees of freedom
# Null hypothesis probability =   3.589049e-01

Energy  Fluence     90% Error
[keV]   [erg/cm2]   [erg/cm2]
15- 25  3.431e-08   8.360e-09
25- 50  9.861e-08   2.044e-08
50-150  6.980e-08   2.172e-08
15-150  2.027e-07   4.324e-08
Thermal bremsstrahlung (OTTB)
Spectral model: thermal bremsstrahlung
------------------------------------------------------------
Parameters  : value         Lower 90%    Upper 90%
kT [keV]    : 106.685       (-43.635      -105.845)
Norm        : 0.994301       (-0.171422     0.232226)
------------------------------------------------------------
#Fit statistic : Chi-Squared =          53.91 using 59 PHA bins.
# Reduced chi-squared =         0.9459 for     57 degrees of freedom
# Null hypothesis probability =   5.915853e-01

Energy  Fluence     90% Error
[keV]   [erg/cm2]   [erg/cm2]
15- 25  4.666e-08   9.456e-09
25- 50  8.171e-08   1.782e-08
50-150  1.372e-07   8.717e-08
15-150  2.656e-07   1.029e-07
Double BB
Spectral model: bbodyrad<1> + bbodyrad<2>
------------------------------------------------------------
Parameters  : value         Lower 90%    Upper 90%
kT1 [keV]   : 8.39354        (-4.05342      2.43076)
R1^2/D10^2  : 0.166932        (-0.0991384      0.955194)
kT2 [keV]   : 32.5868        (-19.4136      -33.1108)
R2^2/D10^2  : 8.71910E-04    (-0.000817769   0.0278673)
------------------------------------------------------------
#Fit statistic : Chi-Squared =          53.36 using 59 PHA bins.
# Reduced chi-squared =         0.9702 for     55 degrees of freedom
# Null hypothesis probability =   5.375570e-01

Energy  Fluence     90% Error
[keV]   [erg/cm2]   [erg/cm2]
15- 25  4.196e-08   2.160e-08
25- 50  9.073e-08   4.533e-08
50-150  1.367e-07   7.799e-08
15-150  2.694e-07   1.382e-07
Peak spectrum fit
Power-law model
Time interval is from    6.156 sec. to    7.156 sec.

Spectral model in power-law:
------------------------------------------------------------
Parameters  : value       lower 90%   higher 90%
Photon index: 2.47950     ( -0.747745   1.48323 )
Norm@50keV  : 2.32455E-03    ( -0.00231934   0.00145932 )
------------------------------------------------------------
#Fit statistic : Chi-Squared =          56.21 using 59 PHA bins.
# Reduced chi-squared =         0.9862 for     57 degrees of freedom
# Null hypothesis probability =   5.046361e-01

Photon flux (15-150 keV)    in 1 sec: 0.450831 ( -0.140812  0.138197 ) ph/cm2/s
Energy fluence (15-150 keV)             : 2.30815e-08 ( -1.11223e-08  1.16623e-08 ) ergs/cm2
Cutoff power-law model
Time interval is from    6.156 sec. to    7.156 sec.
Spectral model in the cutoff power-law:
------------------------------------------------------------
Parameters  : value       lower 90%   higher 90%
Photon index: 1.97271     (     )
Epeak [keV] : 4.78266      (   )
Norm@50keV  : 3.76346E-03    (     )
------------------------------------------------------------
#Fit statistic : Chi-Squared =          56.94 using 59 PHA bins.
# Reduced chi-squared =          1.017 for     56 degrees of freedom
# Null hypothesis probability =   4.397946e-01

Photon flux (15-150 keV)    in 1 sec: 0.440821 ( -0.13418  0.150714 ) ph/cm2/s
Energy fluence (15-150 keV)             : 2.32669e-08 ( -1.12039e-08  1.14891e-08 ) ergs/cm2
Band function
Time interval is from    6.156 sec. to    7.156 sec.

Spectral model in the Band function:
------------------------------------------------------------
Parameters  : value       lower 90%   higher 90%
alpha       : -2.92801   ( 2.92801   2.92801 )
beta        : -2.48471    ( -1.47606   0.748592 )
Epeak [keV] : 27.3668      ( -27.3668 -27.3668 )
Norm@50keV   : 0.314792    ( -0.315068   0.198505 )
------------------------------------------------------------
#Fit statistic : Chi-Squared =          56.21 using 59 PHA bins.
# Reduced chi-squared =          1.022 for     55 degrees of freedom
# Null hypothesis probability =   4.292896e-01

Photon flux (15-150 keV)    in 1 sec:  (    ) ph/cm2/s
Energy fluence (15-150 keV)             : 0 ( 0  0 ) ergs/cm2
Single BB

Spectral model blackbody:
------------------------------------------------------------
Parameters  : value    Lower 90%  Upper 90%
kT [keV]    : 3.12987  (-0.979877  1.69184)
R^2/D10^2   : 34.8797  (-34.8976   356.188)
(R is the radius in km and D10 is the distance to the source in units of 10 kpc)
------------------------------------------------------------
#Fit statistic : Chi-Squared =          61.06 using 59 PHA bins.
# Reduced chi-squared =          1.071 for     57 degrees of freedom
# Null hypothesis probability =   3.322485e-01

Energy  Fluence     90% Error
[keV]   [erg/cm2]   [erg/cm2]
15- 25  8.444e-09   5.030e-09
25- 50  1.424e-09   9.950e-10
50-150  3.211e-12   3.758e-12
15-150  9.871e-09   5.735e-09
Thermal bremsstrahlung (OTTB)
Spectral model: thermal bremsstrahlung
------------------------------------------------------------
Parameters  : value         Lower 90%    Upper 90%
kT [keV]    : 51.8729       (      )
Norm        : 2.48456       (-1.05958     35.5836)
------------------------------------------------------------
#Fit statistic : Chi-Squared =          58.48 using 59 PHA bins.
# Reduced chi-squared =          1.026 for     57 degrees of freedom
# Null hypothesis probability =   4.207195e-01

Energy  Fluence     90% Error
[keV]   [erg/cm2]   [erg/cm2]
15- 25  8.317e-09   5.105e-09
25- 50  3.323e-09   2.269e-09
50-150  1.957e-10   2.022e-10
15-150  1.184e-08   7.265e-09
Double BB
Spectral model: bbodyrad<1> + bbodyrad<2>
------------------------------------------------------------
Parameters  : value         Lower 90%    Upper 90%
kT1 [keV]   : 2.57593        (-0.904264      1.19597)
R1^2/D10^2  : 97.1390        (-86.7291      2257.76)
kT2 [keV]   : 18.5524        (-6.20253      12.2986)
R2^2/D10^2  : 1.67337E-02    (-0.013936   0.0511543)
------------------------------------------------------------
#Fit statistic : Chi-Squared =          49.54 using 59 PHA bins.
# Reduced chi-squared =         0.9007 for     55 degrees of freedom
# Null hypothesis probability =   6.826002e-01

Energy  Fluence     90% Error
[keV]   [erg/cm2]   [erg/cm2]
15- 25  7.746e-09   4.352e-09
25- 50  5.946e-09   3.652e-09
50-150  1.359e-08   9.105e-09
15-150  2.728e-08   1.557e-08
Pre-slew spectrum (Pre-slew PHA with pre-slew DRM)
Power-law model
Spectral model in power-law:
------------------------------------------------------------
Parameters  : value       lower 90%   higher 90%
Photon index: 1.75011     ( -0.246435   0.258453 )
Norm@50keV  : 1.68463E-03    ( -0.000275859   0.000269354 )
------------------------------------------------------------
#Fit statistic : Chi-Squared =          54.98 using 59 PHA bins.
# Reduced chi-squared =         0.9646 for     57 degrees of freedom
# Null hypothesis probability =   5.512148e-01

Photon flux (15-150 keV)    in 17.96 sec: 0.227799 ( -0.0320891  0.0320999 ) ph/cm2/s
Energy fluence (15-150 keV)             : 2.79181e-07 ( -4.6559e-08  4.7733e-08 ) ergs/cm2
Cutoff power-law model

Spectral model in the cutoff power-law:
------------------------------------------------------------
Parameters  : value       lower 90%   higher 90%
Photon index: 1.03880     ( -1.49318   0.560724 )
Epeak [keV] : 58.2935      (   )
Norm@50keV  : 4.25380E-03    (     )
------------------------------------------------------------
#Fit statistic : Chi-Squared =          53.81 using 59 PHA bins.
# Reduced chi-squared =         0.9609 for     56 degrees of freedom
# Null hypothesis probability =   5.581228e-01

Photon flux (15-150 keV)    in 17.96 sec: 0.221603 ( -0.033646  0.033548 ) ph/cm2/s
Energy fluence (15-150 keV)             : 2.5878e-07 ( -5.3871e-08  5.71308e-08 ) ergs/cm2
Band function
Spectral model in the Band function:
------------------------------------------------------------
Parameters  : value       lower 90%   higher 90%
alpha       : -0.351871   ( 0.481696   0.481696 )
beta        : -2.16687    ( 2.17163   0.556405 )
Epeak [keV] : 43.9278      ( -43.3573 321.63 )
Norm@50keV   : 1.19289E-02    ( -0.0137151   44.5394 )
------------------------------------------------------------
#Fit statistic : Chi-Squared =          53.15 using 59 PHA bins.
# Reduced chi-squared =         0.9664 for     55 degrees of freedom
# Null hypothesis probability =   5.456508e-01

Photon flux (15-150 keV)    in 17.96 sec:  (    ) ph/cm2/s
Energy fluence (15-150 keV)             : 2.62963e-07 ( 0  0 ) ergs/cm2
S(25-50 keV) vs. S(50-100 keV) plot
S(25-50 keV)  = 7.71e-08
S(50-100 keV) = 9.17e-08
T90 vs. Hardness ratio plot

T90                                   = 15.8000000119209 sec.
Hardness ratio (energy fluence ratio) = 1.18936
Color vs. Color plot

Count Ratio  (25-50 keV) / (15-25 keV) = 1.40413
Count Ratio (50-100 keV) / (15-25 keV) = 0.71851
Mask shadow pattern
IMX = 4.182326421089206E-01, IMY = -2.269102216803238E-01
TIME vs. PHA plot around the trigger time
Blue+Cyan dotted lines: Time interval of the scaled map
From 0.000000 to 64.000000
TIME vs. DetID plot around the trigger time

Blue+Cyan dotted lines: Time interval of the scaled map
From 0.000000 to 64.000000
100 us light curve (15-350 keV)
Blue+Cyan dotted lines: Time interval of the scaled map
From 0.000000 to 64.000000
Spacecraft aspect plot
Bright source in the pre-burst/pre-slew/post-slew images
Pre-burst image of 15-350 keV band
Time interval of the image:
-134.499400 4.804000

# RAcent  DECcent POSerr Theta    Phi  PeakCts   SNR AngSep     Name
#  [deg]    [deg]    ['] [deg]  [deg]                   [']
 10.8272   1.3164    2.5  43.1  153.9   1.1254   4.6 ------	UNKNOWN
 16.4300  11.0854    2.0  47.9  168.1   1.6811   5.9 ------	UNKNOWN
Pre-slew background subtracted image of 15-350 keV band
Time interval of the image:
4.804000 22.768000

# RAcent  DECcent POSerr Theta    Phi  PeakCts   SNR AngSep     Name
#  [deg]    [deg]    ['] [deg]  [deg]                   [']
 36.9042 -55.5176    1.0  25.4   28.5   0.5171  11.4 ------	UNKNOWN
 33.2280   3.7886    2.3  35.0 -172.3   0.2391   5.0 ------	UNKNOWN
106.9305 -42.8774    2.3  52.6  -34.6   0.8232   5.1 ------	UNKNOWN
Post-slew image of 15-350 keV band
Time interval of the image:
121.900600 947.700600

# RAcent  DECcent POSerr Theta    Phi  PeakCts   SNR AngSep     Name
#  [deg]    [deg]    ['] [deg]  [deg]                   [']
170.2149 -60.6023   23.5  58.1  -18.7   1.1724   0.5    3.2	Cen X-3
 93.9010 -77.7670    2.6  29.4  -15.1   1.8159   4.4 ------	UNKNOWN
Plot creation:
Sun May 31 09:31:51 EDT 2015