Click here for the BAT GCN circular template
Image
Pre-slew 15.0-350.0 keV image (Event data)
#   RAcent    DECcent   POSerr    Theta     Phi              Peak Cts       SNR   Name
  245.0420   -59.9590   0.0102    35.6576   -32.5120         1.2728908     18.879 TRIG_00287088

Foreground time interval of the image:
 -0.844  28.668 (delta_t =  29.512 [sec])
Background time interval of the image:
-239.584  -0.844 (delta_t = 238.740 [sec])
Lightcurves
Notes:
- 1) The mask-weighted light curves are using the flight position.
- 2) Multiple plots of different time binning/intervals are shown to cover all scenarios of short/long GRBs, rate/image triggers, and real/false positives.
- 3) For all the mask-weighted lightcurves, the y-axis units are counts/sec/det where a det is 0.4 x 0.4 = 0.16 sq cm.
- 4) The verticle lines correspond to following: green dotted lines are T50 interval, black dotted lines are T90 interval, blue solid line(s) is a spacecraft slew start time, and orange solid line(s) is a spacecraft slew end time.
- 5) Time of each bin is in the middle of the bin.
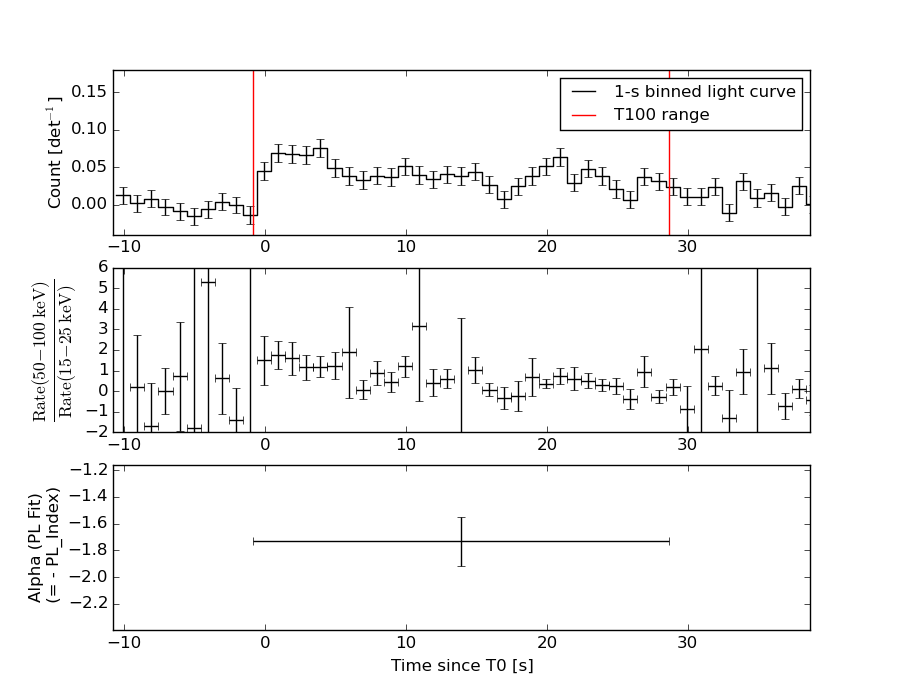
1 s binning
From T0-310 s to T0+310 s

From T100_start - 20 s to T100_end + 30 s

Full time interval

64 ms binning
Full time interval
From T100_start to T100_end

From T0-5 sec to T0+5 sec

16 ms binning
From T100_start-5 s to T100_start+5 s
Blue+Cyan dotted lines: Time interval of the scaled map
From 0.000000 to 4.096000
8 ms binning
From T100_start-3 s to T100_start+3 s
Blue+Cyan dotted lines: Time interval of the scaled map
From 0.000000 to 4.096000
2 ms binning
From T100_start-1 s to T100_start+1 s
Blue+Cyan dotted lines: Time interval of the scaled map
From 0.000000 to 4.096000
SN=5 or 10 sec. binning (whichever binning is satisfied first)
SN=5 or 10 sec. binning (T < 200 sec)

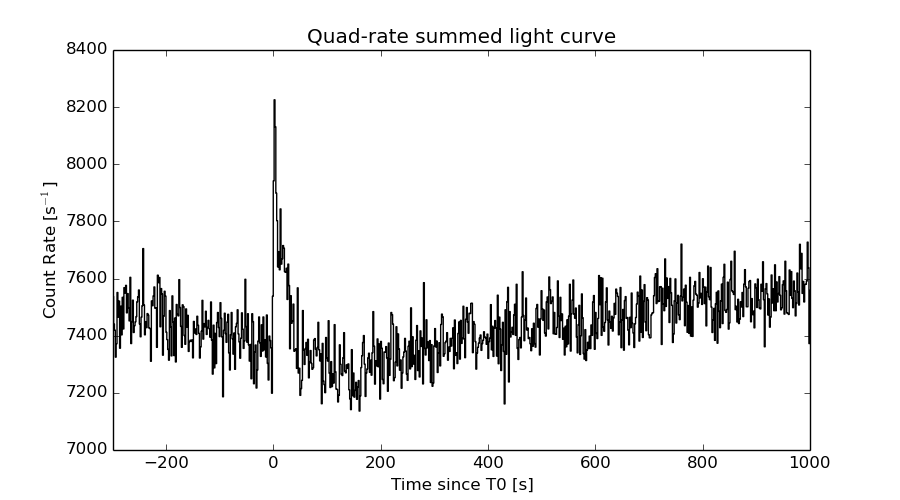
Quad-rate summed light curves (from T0-300s to T0+1000s)
Spectral Evolution
Spectra
Notes:
- 1) The fitting includes the systematic errors.
- 2) When the burst includes telescope slew time periods, the fitting uses an average response file made from multiple 5-s response files through out the slew time plus single time preiod for the non-slew times, and weighted by the total counts in the corresponding time period using addrmf. An average response file is needed becuase a spectral fit using the pre-slew DRM will introduce some errors in both a spectral shape and a normalization if the PHA file contains a lot of the slew/post-slew time interval.
- 3) For fits to more complicated models (e.g. a power-law over a cutoff power-law), the BAT team has decided to require a chi-square improvement of more than 6 for each extra dof.
Time averaged spectrum fit using the average DRM
Power-law model

Time interval is from   -0.844 sec. to   28.668 sec.

Spectral model in power-law:
------------------------------------------------------------
Parameters  : value       lower 90%   higher 90%
Photon index: 1.73242     ( -0.179588   0.183772 )
Norm@50keV  : 2.59876E-03    ( -0.000261476   0.000255731 )
------------------------------------------------------------
#Fit statistic : Chi-Squared =          55.65 using 59 PHA bins.
# Reduced chi-squared =         0.9763 for     57 degrees of freedom
# Null hypothesis probability =   5.259207e-01

Photon flux (15-150 keV)    in 29.51 sec: 0.349146 ( -0.0318657  0.0319325 ) ph/cm2/s
Energy fluence (15-150 keV)             : 7.0842e-07 ( -7.40403e-08  7.48282e-08 ) ergs/cm2
Cutoff power-law model

Time interval is from   -0.844 sec. to   28.668 sec.
Spectral model in the cutoff power-law:
------------------------------------------------------------
Parameters  : value       lower 90%   higher 90%
Photon index: 1.73216     ( -0.391546   0.16746 )
Epeak [keV] : 1.00000E+04      (   )
Norm@50keV  : 2.60224E-03    (     )
------------------------------------------------------------
#Fit statistic : Chi-Squared =          55.67 using 59 PHA bins.
# Reduced chi-squared =         0.9941 for     56 degrees of freedom
# Null hypothesis probability =   4.873134e-01

Photon flux (15-150 keV)    in 29.51 sec: 0.348987 ( -0.031409  0.031903 ) ph/cm2/s
Energy fluence (15-150 keV)             : 7.05903e-07 ( -7.18008e-08  6.72887e-08 ) ergs/cm2
Band function

Time interval is from   -0.844 sec. to   28.668 sec.

Spectral model in the Band function:
------------------------------------------------------------
Parameters  : value       lower 90%   higher 90%
alpha       : -1.38259   ( 1.38349   1.38349 )
beta        : -1.73235    ( 1.73238   0.179645 )
Epeak [keV] : 21.6664      ( -21.277 -21.277 )
Norm@50keV   : 6.02585E-03    ( -0.00369435   0.382129 )
------------------------------------------------------------
#Fit statistic : Chi-Squared =          55.65 using 59 PHA bins.
# Reduced chi-squared =          1.012 for     55 degrees of freedom
# Null hypothesis probability =   4.502181e-01

Photon flux (15-150 keV)    in 29.51 sec:  (    ) ph/cm2/s
Energy fluence (15-150 keV)             : 0 ( 0  0 ) ergs/cm2
Single BB

Spectral model blackbody:
------------------------------------------------------------
Parameters  : value    Lower 90%  Upper 90%
kT [keV]    : 10.8361  (  )
R^2/D10^2   : 0.113031  (   )
(R is the radius in km and D10 is the distance to the source in units of 10 kpc)
------------------------------------------------------------
#Fit statistic : Chi-Squared =         121.20 using 59 PHA bins.
# Reduced chi-squared =         2.1263 for     57 degrees of freedom
# Null hypothesis probability =   1.563350e-06

Energy  Fluence     90% Error
[keV]   [erg/cm2]   [erg/cm2]
15- 25  8.158e-08   1.387e-08
25- 50  2.262e-07   2.744e-08
50-150  1.483e-07   3.678e-08
15-150  4.561e-07   5.902e-08
Thermal bremsstrahlung (OTTB)

Spectral model: thermal bremsstrahlung
------------------------------------------------------------
Parameters  : value         Lower 90%    Upper 90%
kT [keV]    : 158.778       (-63.7539      -158.014)
Norm        : 1.39685       (-0.14179     0.195408)
------------------------------------------------------------
#Fit statistic : Chi-Squared =          63.38 using 59 PHA bins.
# Reduced chi-squared =          1.112 for     57 degrees of freedom
# Null hypothesis probability =   2.614804e-01

Energy  Fluence     90% Error
[keV]   [erg/cm2]   [erg/cm2]
15- 25  1.053e-07   1.878e-08
25- 50  1.968e-07   6.274e-08
50-150  3.975e-07   2.145e-07
15-150  6.997e-07   2.677e-07
Double BB

Spectral model: bbodyrad<1> + bbodyrad<2>
------------------------------------------------------------
Parameters  : value         Lower 90%    Upper 90%
kT1 [keV]   : 6.35870        (-0.996544      1.12409)
R1^2/D10^2  : 0.726742        (-0.342538      0.719093)
kT2 [keV]   : 45.0674        (-13.9935      39.9607)
R2^2/D10^2  : 8.36427E-04    (-0.000632843   0.0015488)
------------------------------------------------------------
#Fit statistic : Chi-Squared =          46.56 using 59 PHA bins.
# Reduced chi-squared =         0.8465 for     55 degrees of freedom
# Null hypothesis probability =   7.840332e-01

Energy  Fluence     90% Error
[keV]   [erg/cm2]   [erg/cm2]
15- 25  1.306e-07   3.011e-08
25- 50  1.825e-07   4.367e-08
50-150  4.747e-07   2.452e-07
15-150  7.878e-07   2.729e-07
Peak spectrum fit
Power-law model

Time interval is from    3.232 sec. to    4.232 sec.

Spectral model in power-law:
------------------------------------------------------------
Parameters  : value       lower 90%   higher 90%
Photon index: 1.33732     ( -0.430437   0.419969 )
Norm@50keV  : 5.52698E-03    ( -0.00131661   0.00131505 )
------------------------------------------------------------
#Fit statistic : Chi-Squared =          44.00 using 59 PHA bins.
# Reduced chi-squared =         0.7719 for     57 degrees of freedom
# Null hypothesis probability =   8.964000e-01

Photon flux (15-150 keV)    in 1 sec: 0.664132 ( -0.163696  0.164375 ) ph/cm2/s
Energy fluence (15-150 keV)             : 5.41366e-08 ( -1.40554e-08  1.42151e-08 ) ergs/cm2
Cutoff power-law model

Time interval is from    3.232 sec. to    4.232 sec.
Spectral model in the cutoff power-law:
------------------------------------------------------------
Parameters  : value       lower 90%   higher 90%
Photon index: 1.30016     (     )
Epeak [keV] : 936.755      (   )
Norm@50keV  : 5.78553E-03    (     )
------------------------------------------------------------
#Fit statistic : Chi-Squared =          44.02 using 59 PHA bins.
# Reduced chi-squared =         0.7860 for     56 degrees of freedom
# Null hypothesis probability =   8.770931e-01

Photon flux (15-150 keV)    in 1 sec: 0.664270 ( -0.163923  0.162854 ) ph/cm2/s
Energy fluence (15-150 keV)             : 5.40328e-08 ( -1.44003e-08  1.42237e-08 ) ergs/cm2
Band function

Time interval is from    3.232 sec. to    4.232 sec.

Spectral model in the Band function:
------------------------------------------------------------
Parameters  : value       lower 90%   higher 90%
alpha       : -9.51884   ( 9.51884   9.51884 )
beta        : -1.33731    ( -0.419337   0.430397 )
Epeak [keV] : 109.335      ( -109.335 -109.335 )
Norm@50keV   : 0.751195    ( -0.178954   0.178744 )
------------------------------------------------------------
#Fit statistic : Chi-Squared =          44.00 using 59 PHA bins.
# Reduced chi-squared =         0.8000 for     55 degrees of freedom
# Null hypothesis probability =   8.562769e-01

Photon flux (15-150 keV)    in 1 sec:  (    ) ph/cm2/s
Energy fluence (15-150 keV)             : 0 ( 0  0 ) ergs/cm2
Single BB

Spectral model blackbody:
------------------------------------------------------------
Parameters  : value    Lower 90%  Upper 90%
kT [keV]    : 16.6740  (-4.57751  7.3606)
R^2/D10^2   : 5.39525E-02  (-0.0383457   0.109309)
(R is the radius in km and D10 is the distance to the source in units of 10 kpc)
------------------------------------------------------------
#Fit statistic : Chi-Squared =          48.95 using 59 PHA bins.
# Reduced chi-squared =         0.8588 for     57 degrees of freedom
# Null hypothesis probability =   7.671205e-01

Energy  Fluence     90% Error
[keV]   [erg/cm2]   [erg/cm2]
15- 25  3.071e-09   1.796e-09
25- 50  1.338e-08   6.562e-09
50-150  2.638e-08   1.467e-08
15-150  4.283e-08   2.197e-08
Thermal bremsstrahlung (OTTB)

Spectral model: thermal bremsstrahlung
------------------------------------------------------------
Parameters  : value         Lower 90%    Upper 90%
kT [keV]    : 199.363       (-99.9484      -199.363)
Norm        : 2.76261       (-0.663334     0.663355)
------------------------------------------------------------
#Fit statistic : Chi-Squared =          44.98 using 59 PHA bins.
# Reduced chi-squared =         0.7891 for     57 degrees of freedom
# Null hypothesis probability =   8.755142e-01

Energy  Fluence     90% Error
[keV]   [erg/cm2]   [erg/cm2]
15- 25  6.879e-09   4.075e-09
25- 50  1.323e-08   7.740e-09
50-150  2.902e-08   1.751e-08
15-150  4.913e-08   2.881e-08
Double BB

------------------------------------------------------------
Parameters  : value         Lower 90%    Upper 90%
kT1 [keV]   : 11.4099        (      )
R1^2/D10^2  : 0.163767        (-0.117675      29.4662)
kT2 [keV]   : 170.999        (-171.847      -171.847)
R2^2/D10^2  : 1.15811E-04    (-7.17437e-05   0.0472468)
------------------------------------------------------------
#Fit statistic : Chi-Squared =          44.17 using 59 PHA bins.
#Fit statistic : Chi-Squared =          43.97 using 59 PHA bins.
# Reduced chi-squared =         0.8030 for     55 degrees of freedom
# Reduced chi-squared =         0.7994 for     55 degrees of freedom
# Null hypothesis probability =   8.520118e-01
# Null hypothesis probability =   8.570394e-01

Energy  Fluence     90% Error
[keV]   [erg/cm2]   [erg/cm2]
15- 25  5.030e-09   3.049e-09
25- 50  1.391e-08   8.215e-09
50-150  3.584e-08   1.756e-08
15-150  5.478e-08   2.587e-08
Pre-slew spectrum (Pre-slew PHA with pre-slew DRM)
Power-law model

Spectral model in power-law:
------------------------------------------------------------
Parameters  : value       lower 90%   higher 90%
Photon index: 1.73242     ( -0.179588   0.183772 )
Norm@50keV  : 2.59876E-03    ( -0.000261476   0.000255731 )
------------------------------------------------------------
#Fit statistic : Chi-Squared =          55.65 using 59 PHA bins.
# Reduced chi-squared =         0.9763 for     57 degrees of freedom
# Null hypothesis probability =   5.259207e-01

Photon flux (15-150 keV)    in 29.51 sec: 0.349146 ( -0.0318657  0.0319325 ) ph/cm2/s
Energy fluence (15-150 keV)             : 7.0842e-07 ( -7.40403e-08  7.48282e-08 ) ergs/cm2
Cutoff power-law model

Spectral model in the cutoff power-law:
------------------------------------------------------------
Parameters  : value       lower 90%   higher 90%
Photon index: 1.73216     ( -0.391546   0.16746 )
Epeak [keV] : 1.00000E+04      (   )
Norm@50keV  : 2.60224E-03    (     )
------------------------------------------------------------
#Fit statistic : Chi-Squared =          55.67 using 59 PHA bins.
# Reduced chi-squared =         0.9941 for     56 degrees of freedom
# Null hypothesis probability =   4.873134e-01

Photon flux (15-150 keV)    in 29.51 sec: 0.348987 ( -0.031409  0.031903 ) ph/cm2/s
Energy fluence (15-150 keV)             : 7.05903e-07 ( -7.18008e-08  6.72887e-08 ) ergs/cm2
Band function

Spectral model in the Band function:
------------------------------------------------------------
Parameters  : value       lower 90%   higher 90%
alpha       : -1.38259   ( 1.38349   1.38349 )
beta        : -1.73235    ( 1.73238   0.179645 )
Epeak [keV] : 21.6664      ( -21.277 -21.277 )
Norm@50keV   : 6.02585E-03    ( -0.00369435   0.382129 )
------------------------------------------------------------
#Fit statistic : Chi-Squared =          55.65 using 59 PHA bins.
# Reduced chi-squared =          1.012 for     55 degrees of freedom
# Null hypothesis probability =   4.502181e-01

Photon flux (15-150 keV)    in 29.51 sec:  (    ) ph/cm2/s
Energy fluence (15-150 keV)             : 0 ( 0  0 ) ergs/cm2
S(25-50 keV) vs. S(50-100 keV) plot

S(25-50 keV)  = 1.94e-07
S(50-100 keV) = 2.34e-07
T90 vs. Hardness ratio plot

T90                                   = 26.4320000112057 sec.
Hardness ratio (energy fluence ratio) = 1.20619
Color vs. Color plot

Count Ratio  (25-50 keV) / (15-25 keV) = 1.00603
Count Ratio (50-100 keV) / (15-25 keV) = 0.730404
Mask shadow pattern

IMX = 6.050113605532932E-01, IMY = 3.856135393564443E-01
TIME vs. PHA plot around the trigger time

Blue+Cyan dotted lines: Time interval of the scaled map
From 0.000000 to 4.096000
TIME vs. DetID plot around the trigger time

Blue+Cyan dotted lines: Time interval of the scaled map
From 0.000000 to 4.096000
100 us light curve (15-350 keV)
Blue+Cyan dotted lines: Time interval of the scaled map
From 0.000000 to 4.096000
Spacecraft aspect plot

Bright source in the pre-burst/pre-slew/post-slew images
Pre-burst image of 15-350 keV band
Time interval of the image:
-239.584000 -0.844000

# RAcent  DECcent POSerr Theta    Phi  PeakCts   SNR AngSep     Name
#  [deg]    [deg]    ['] [deg]  [deg]                   [']
255.9305 -37.9624   50.6  47.0   -1.6  -0.0822  -0.2    7.6	4U 1700-377
256.4966 -36.3399    3.0  48.0    0.2   1.4893   3.9    5.8	GX 349+2
264.7101 -44.2727   18.0  37.9    0.4  -0.1528  -0.6   10.7	4U 1735-44
270.3716 -25.0268    5.2  51.3   21.3  -1.6715  -2.2    5.7	GX 5-1
270.2500 -25.6922    6.0  50.8   20.8   1.3686   1.9    4.2	GRS 1758-258
275.9595 -30.2517   10.0  44.4   23.8   0.4454   1.2    7.1	H1820-303
285.0628 -25.0251    9.4  45.4   37.3   0.7109   1.2    6.4	HT1900.1-2455
263.1322 -33.8071    9.2  47.0    8.2   0.4440   1.3    7.3	GX 354-0
 18.6545 -54.3013    2.0  28.9 -170.7   0.9633   5.9 ------	UNKNOWN
 40.8503 -30.7925    2.9  57.1 -175.4   3.4953   4.0 ------	UNKNOWN
Pre-slew background subtracted image of 15-350 keV band
Time interval of the image:
-0.844000 28.668000

# RAcent  DECcent POSerr Theta    Phi  PeakCts   SNR AngSep     Name
#  [deg]    [deg]    ['] [deg]  [deg]                   [']
256.0201 -37.8940   71.5  47.0   -1.5   0.0172   0.2    3.4	4U 1700-377
256.4675 -36.3922    4.0  48.0    0.1  -0.3126  -2.9    2.4	GX 349+2
264.8678 -44.5474    5.9  37.6    0.2   0.1417   2.0    7.9	4U 1735-44
270.3208 -25.0691    5.5  51.3   21.2   0.5530   2.1    2.1	GX 5-1
270.1807 -25.6483   56.3  50.9   20.7   0.0490   0.2    8.7	GRS 1758-258
275.9810 -30.5261    0.0  44.1   23.6   0.1359   1.1   10.0	H1820-303
284.9860 -25.0086    4.1  45.5   37.2  -0.5042  -2.8    5.9	HT1900.1-2455
262.9035 -33.9097    9.6  47.1    7.9  -0.1372  -1.2    6.2	GX 354-0
287.4469 -22.2015    1.8  47.2   41.6   1.5921   6.4 ------	UNKNOWN
245.0420 -59.9590    0.6  35.7  -32.5   1.2729  18.9 ------	UNKNOWN
126.2418 -76.1182    2.2  41.0  -96.3   1.1835   5.3 ------	UNKNOWN
Post-slew image of 15-350 keV band
Time interval of the image:
199.516600 962.488700

# RAcent  DECcent POSerr Theta    Phi  PeakCts   SNR AngSep     Name
#  [deg]    [deg]    ['] [deg]  [deg]                   [']
170.2899 -60.6135   11.6  58.1  -25.1   2.6048   1.0    0.9	Cen X-3
258.4259 -68.0117    2.0  52.7   17.9   9.0193   5.8 ------	UNKNOWN
Plot creation:
Sun May 31 09:29:56 EDT 2015