Click here for the BAT GCN circular template
Image
Pre-slew 15.0-350.0 keV image (Event data)
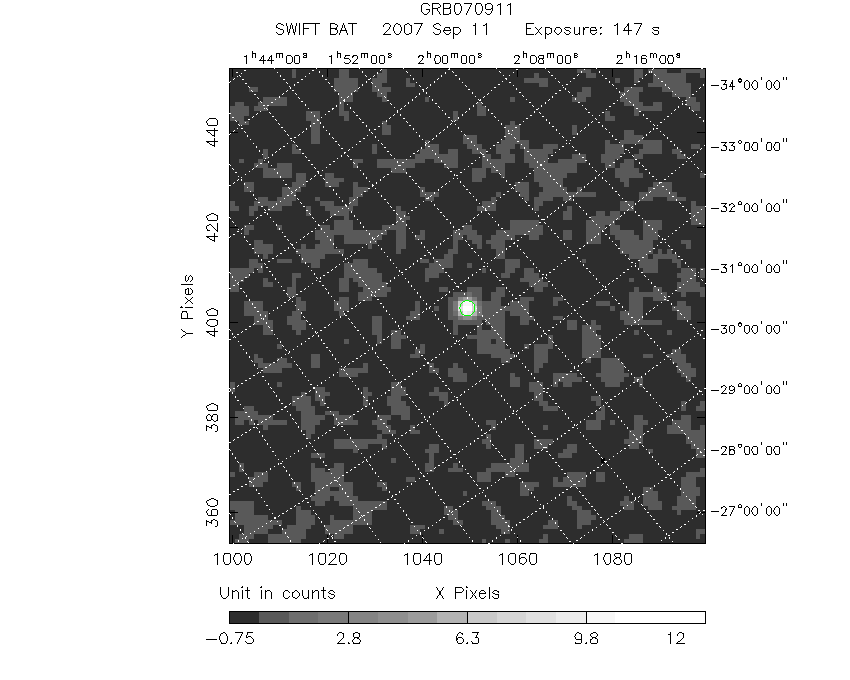
#   RAcent    DECcent   POSerr    Theta     Phi              Peak Cts       SNR   Name
   25.8079   -33.4796   0.0024    21.2473   156.5654        14.4271489     79.212 TRIG_00290624

Foreground time interval of the image:
-72.268  74.797 (delta_t = 147.065 [sec])
Background time interval of the image:
-299.304 -72.268 (delta_t = 227.036 [sec])
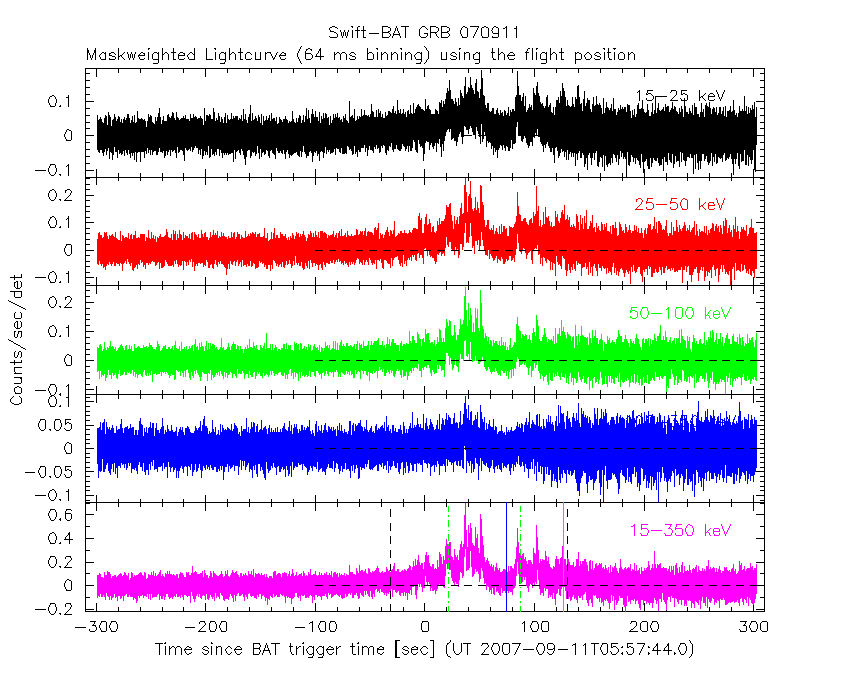
Lightcurves
Notes:
- 1) The mask-weighted light curves are using the flight position.
- 2) Multiple plots of different time binning/intervals are shown to cover all scenarios of short/long GRBs, rate/image triggers, and real/false positives.
- 3) For all the mask-weighted lightcurves, the y-axis units are counts/sec/det where a det is 0.4 x 0.4 = 0.16 sq cm.
- 4) The verticle lines correspond to following: green dotted lines are T50 interval, black dotted lines are T90 interval, blue solid line(s) is a spacecraft slew start time, and orange solid line(s) is a spacecraft slew end time.
- 5) Time of each bin is in the middle of the bin.
1 s binning
From T0-310 s to T0+310 s

From T100_start - 20 s to T100_end + 30 s

Full time interval

64 ms binning
Full time interval
From T100_start to T100_end

From T0-5 sec to T0+5 sec

16 ms binning
From T100_start-5 s to T100_start+5 s

Blue+Cyan dotted lines: Time interval of the scaled map
From 0.000000 to 1.024000
8 ms binning
From T100_start-3 s to T100_start+3 s

Blue+Cyan dotted lines: Time interval of the scaled map
From 0.000000 to 1.024000
2 ms binning
From T100_start-1 s to T100_start+1 s

Blue+Cyan dotted lines: Time interval of the scaled map
From 0.000000 to 1.024000
SN=5 or 10 sec. binning (whichever binning is satisfied first)
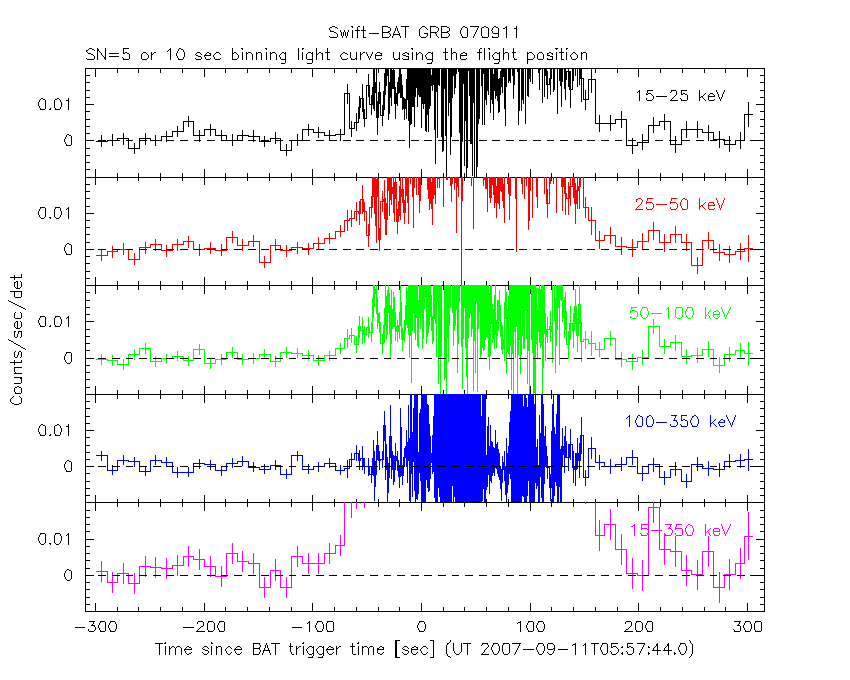
SN=5 or 10 sec. binning (T < 200 sec)

Quad-rate summed light curves (from T0-300s to T0+1000s)

Spectral Evolution

Spectra
Notes:
- 1) The fitting includes the systematic errors.
- 2) When the burst includes telescope slew time periods, the fitting uses an average response file made from multiple 5-s response files through out the slew time plus single time preiod for the non-slew times, and weighted by the total counts in the corresponding time period using addrmf. An average response file is needed becuase a spectral fit using the pre-slew DRM will introduce some errors in both a spectral shape and a normalization if the PHA file contains a lot of the slew/post-slew time interval.
- 3) For fits to more complicated models (e.g. a power-law over a cutoff power-law), the BAT team has decided to require a chi-square improvement of more than 6 for each extra dof.
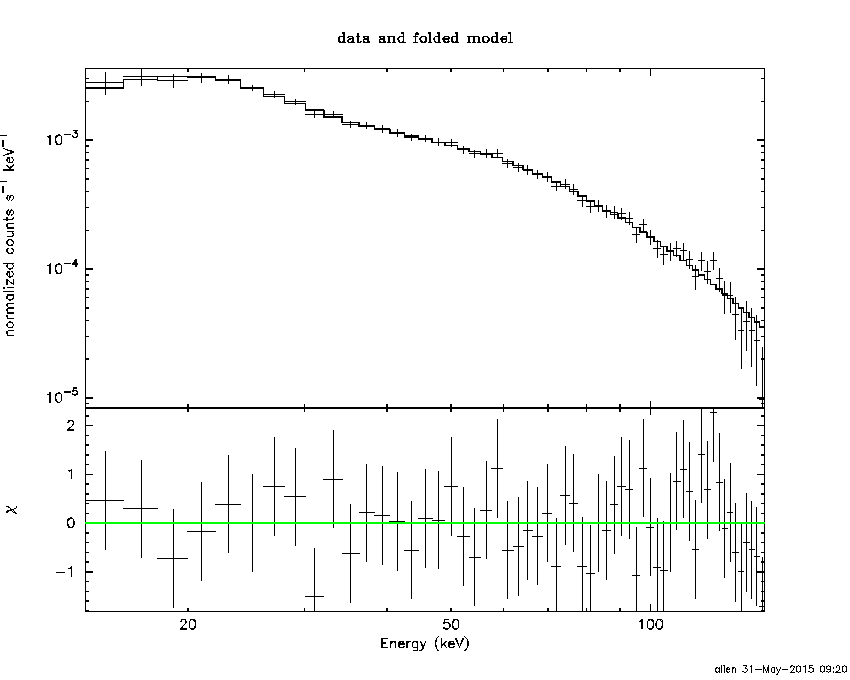
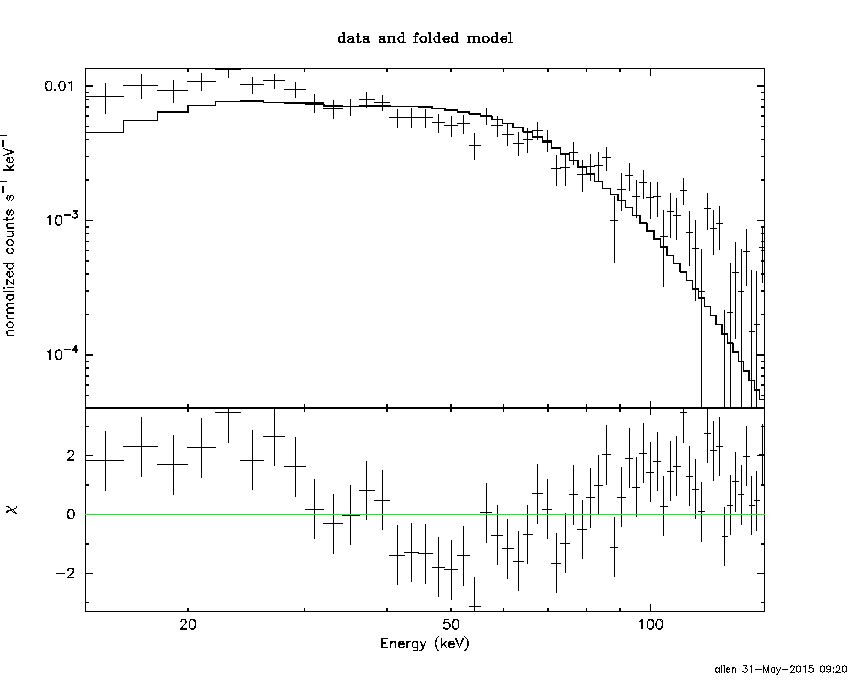
Time averaged spectrum fit using the average DRM
Power-law model

Time interval is from  -72.268 sec. to  158.800 sec.

Spectral model in power-law:
------------------------------------------------------------
Parameters  : value       lower 90%   higher 90%
Photon index: 1.70796     ( -0.0368563   0.0368769 )
Norm@50keV  : 5.93524E-03    ( -0.00010611   0.00010611 )
------------------------------------------------------------
#Fit statistic : Chi-Squared =          35.65 using 59 PHA bins.
# Reduced chi-squared =         0.6255 for     57 degrees of freedom
# Null hypothesis probability =   9.880496e-01

Photon flux (15-150 keV)    in 231.1 sec: 0.790471 ( -0.0174981  0.0175958 ) ph/cm2/s
Energy fluence (15-150 keV)             : 1.26919e-05 ( -2.29268e-07  2.2936e-07 ) ergs/cm2
Cutoff power-law model

Time interval is from  -72.268 sec. to  158.800 sec.
Spectral model in the cutoff power-law:
------------------------------------------------------------
Parameters  : value       lower 90%   higher 90%
Photon index: 1.69065     ( -0.144583   0.0507616 )
Epeak [keV] : 997.361      ( -999.113 -999.123 )
Norm@50keV  : 6.04176E-03    ( -0.000192691   0.000935889 )
------------------------------------------------------------
#Fit statistic : Chi-Squared =          35.61 using 59 PHA bins.
# Reduced chi-squared =         0.6359 for     56 degrees of freedom
# Null hypothesis probability =   9.846971e-01

Photon flux (15-150 keV)    in 231.1 sec: 0.785257 ( -0.009152  0.022773 ) ph/cm2/s
Energy fluence (15-150 keV)             : 1.26421e-05 ( -2.39281e-07  2.85432e-07 ) ergs/cm2
Band function
Time interval is from  -72.268 sec. to  158.800 sec.

Spectral model in the Band function:
------------------------------------------------------------
Parameters  : value       lower 90%   higher 90%
alpha       : 2.13290   ( -2.19052   -2.19052 )
beta        : -1.72008    ( -0.0384433   0.0382057 )
Epeak [keV] : 24.2900      ( -24.3903 120.738 )
Norm@50keV   : 5.93551    ( -0.44338   550.121 )
------------------------------------------------------------
#Fit statistic : Chi-Squared =          33.74 using 59 PHA bins.
# Reduced chi-squared =         0.6135 for     55 degrees of freedom
# Null hypothesis probability =   9.893764e-01

Photon flux (15-150 keV)    in 231.1 sec:  (    ) ph/cm2/s
Energy fluence (15-150 keV)             : 0 ( 0  0 ) ergs/cm2
Single BB

Spectral model blackbody:
------------------------------------------------------------
Parameters  : value    Lower 90%  Upper 90%
kT [keV]    : 15.8390  (  )
R^2/D10^2   : 6.45536E-02  (   )
(R is the radius in km and D10 is the distance to the source in units of 10 kpc)
------------------------------------------------------------
#Fit statistic : Chi-Squared =         736.58 using 59 PHA bins.
# Reduced chi-squared =         12.923 for     57 degrees of freedom
# Null hypothesis probability =  7.907112e-119

Energy  Fluence     90% Error
[keV]   [erg/cm2]   [erg/cm2]
15- 25  7.755e-07   3.062e-08
25- 50  3.235e-06   8.204e-08
50-150  5.651e-06   1.779e-07
15-150  9.662e-06   1.964e-07
Thermal bremsstrahlung (OTTB)

Spectral model: thermal bremsstrahlung
------------------------------------------------------------
Parameters  : value         Lower 90%    Upper 90%
kT [keV]    : 156.569       (      )
Norm        : 3.14182       (-0.0825406     0.0811774)
------------------------------------------------------------
#Fit statistic : Chi-Squared =          56.17 using 59 PHA bins.
# Reduced chi-squared =         0.9854 for     57 degrees of freedom
# Null hypothesis probability =   5.063211e-01

Energy  Fluence     90% Error
[keV]   [erg/cm2]   [erg/cm2]
15- 25  1.842e-06   8.620e-08
25- 50  3.439e-06   1.502e-07
50-150  6.932e-06   1.420e-06
15-150  1.221e-05   1.485e-06
Double BB

Spectral model: bbodyrad<1> + bbodyrad<2>
------------------------------------------------------------
Parameters  : value         Lower 90%    Upper 90%
kT1 [keV]   : 7.34084        (-0.476585      0.502112)
R1^2/D10^2  : 0.752726        (-0.160666      0.216051)
kT2 [keV]   : 27.9078        (-1.89541      2.2908)
R2^2/D10^2  : 6.69252E-03    (-0.00165594   0.00198602)
------------------------------------------------------------
#Fit statistic : Chi-Squared =          51.93 using 59 PHA bins.
# Reduced chi-squared =         0.9442 for     55 degrees of freedom
# Null hypothesis probability =   5.925732e-01

Energy  Fluence     90% Error
[keV]   [erg/cm2]   [erg/cm2]
15- 25  1.775e-06   1.175e-07
25- 50  3.542e-06   1.156e-07
50-150  7.101e-06   3.039e-07
15-150  1.242e-05   3.721e-07
Peak spectrum fit
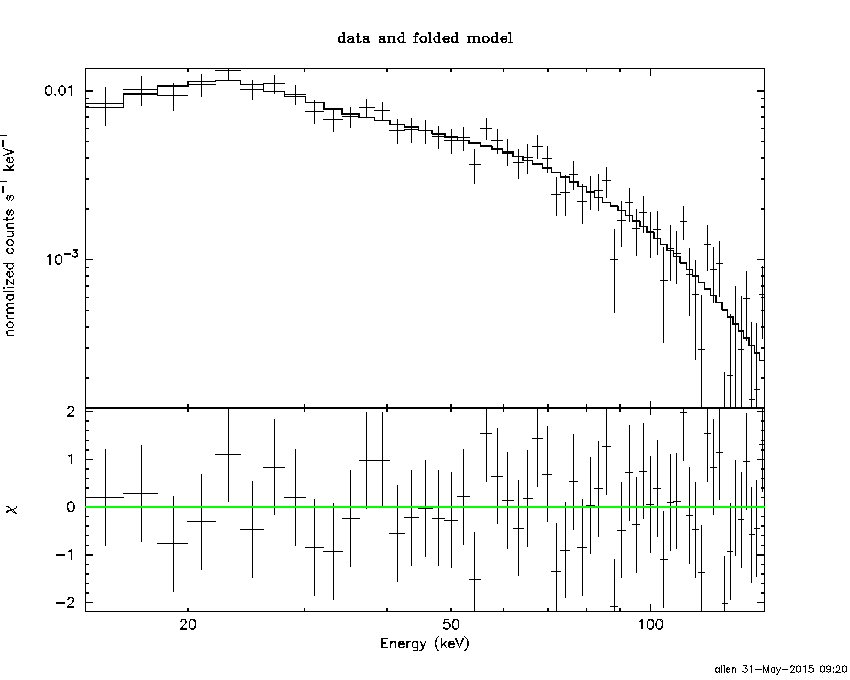
Power-law model

Time interval is from   36.128 sec. to   37.128 sec.

Spectral model in power-law:
------------------------------------------------------------
Parameters  : value       lower 90%   higher 90%
Photon index: 1.23136     ( -0.0770091   0.0768848 )
Norm@50keV  : 3.33099E-02    ( -0.00146311   0.00146292 )
------------------------------------------------------------
#Fit statistic : Chi-Squared =          53.31 using 59 PHA bins.
# Reduced chi-squared =         0.9352 for     57 degrees of freedom
# Null hypothesis probability =   6.143438e-01

Photon flux (15-150 keV)    in 1 sec: 3.92803 ( -0.176357  0.176479 ) ph/cm2/s
Energy fluence (15-150 keV)             : 3.35026e-07 ( -1.65619e-08  1.6624e-08 ) ergs/cm2
Cutoff power-law model

Time interval is from   36.128 sec. to   37.128 sec.
Spectral model in the cutoff power-law:
------------------------------------------------------------
Parameters  : value       lower 90%   higher 90%
Photon index: 0.920093     ( -0.313275   0.291372 )
Epeak [keV] : 186.054      ( -67.577 1280.31 )
Norm@50keV  : 4.68848E-02    ( -0.012407   0.0186132 )
------------------------------------------------------------
#Fit statistic : Chi-Squared =          49.97 using 59 PHA bins.
# Reduced chi-squared =         0.8923 for     56 degrees of freedom
# Null hypothesis probability =   7.012455e-01

Photon flux (15-150 keV)    in 1 sec: 3.87486 ( -0.18303  0.18299 ) ph/cm2/s
Energy fluence (15-150 keV)             : 3.28548e-07 ( -1.7979e-08  1.7868e-08 ) ergs/cm2
Band function

Time interval is from   36.128 sec. to   37.128 sec.

Spectral model in the Band function:
------------------------------------------------------------
Parameters  : value       lower 90%   higher 90%
alpha       : 2.04138   ( -2.83168   -2.04137 )
beta        : -1.33201    ( -0.11743   0.106318 )
Epeak [keV] : 34.9115      ( -6.5035 98.2421 )
Norm@50keV   : 6.19896    ( -6.19873   450.47 )
------------------------------------------------------------
#Fit statistic : Chi-Squared =          46.61 using 59 PHA bins.
# Reduced chi-squared =         0.8475 for     55 degrees of freedom
# Null hypothesis probability =   7.822904e-01

Photon flux (15-150 keV)    in 1 sec:  (    ) ph/cm2/s
Energy fluence (15-150 keV)             : 0 ( 0  0 ) ergs/cm2
Single BB
Spectral model blackbody:
------------------------------------------------------------
Parameters  : value    Lower 90%  Upper 90%
kT [keV]    : 18.0050  (  )
R^2/D10^2   : 0.252870  (   )
(R is the radius in km and D10 is the distance to the source in units of 10 kpc)
------------------------------------------------------------
#Fit statistic : Chi-Squared =         145.31 using 59 PHA bins.
# Reduced chi-squared =         2.5493 for     57 degrees of freedom
# Null hypothesis probability =   1.184280e-09

Energy  Fluence     90% Error
[keV]   [erg/cm2]   [erg/cm2]
15- 25  1.641e-08   1.380e-09
25- 50  7.592e-08   4.465e-09
50-150  1.787e-07   1.520e-08
15-150  2.710e-07   1.470e-08
Thermal bremsstrahlung (OTTB)

Spectral model: thermal bremsstrahlung
------------------------------------------------------------
Parameters  : value         Lower 90%    Upper 90%
kT [keV]    : 200.000       (      )
Norm        : 16.1831       (-0.72131     0.721221)
------------------------------------------------------------
#Fit statistic : Chi-Squared =          96.72 using 59 PHA bins.
# Reduced chi-squared =          1.697 for     57 degrees of freedom
# Null hypothesis probability =   8.035078e-04

Energy  Fluence     90% Error
[keV]   [erg/cm2]   [erg/cm2]
15- 25  4.031e-08   1.930e-09
25- 50  7.753e-08   3.625e-09
50-150  1.700e-07   8.350e-09
15-150  2.879e-07   1.390e-08
Double BB
Spectral model: bbodyrad<1> + bbodyrad<2>
------------------------------------------------------------
Parameters  : value         Lower 90%    Upper 90%
kT1 [keV]   : 8.53035        (-1.28335      1.44089)
R1^2/D10^2  : 1.81131        (-0.658036      1.16862)
kT2 [keV]   : 33.1990        (-5.32108      9.00178)
R2^2/D10^2  : 2.72622E-02    (-0.0145026   0.0220771)
------------------------------------------------------------
#Fit statistic : Chi-Squared =          46.27 using 59 PHA bins.
# Reduced chi-squared =         0.8412 for     55 degrees of freedom
# Null hypothesis probability =   7.929408e-01

Energy  Fluence     90% Error
[keV]   [erg/cm2]   [erg/cm2]
15- 25  2.930e-08   4.860e-09
25- 50  7.684e-08   1.006e-08
50-150  2.258e-07   5.140e-08
15-150  3.320e-07   6.160e-08
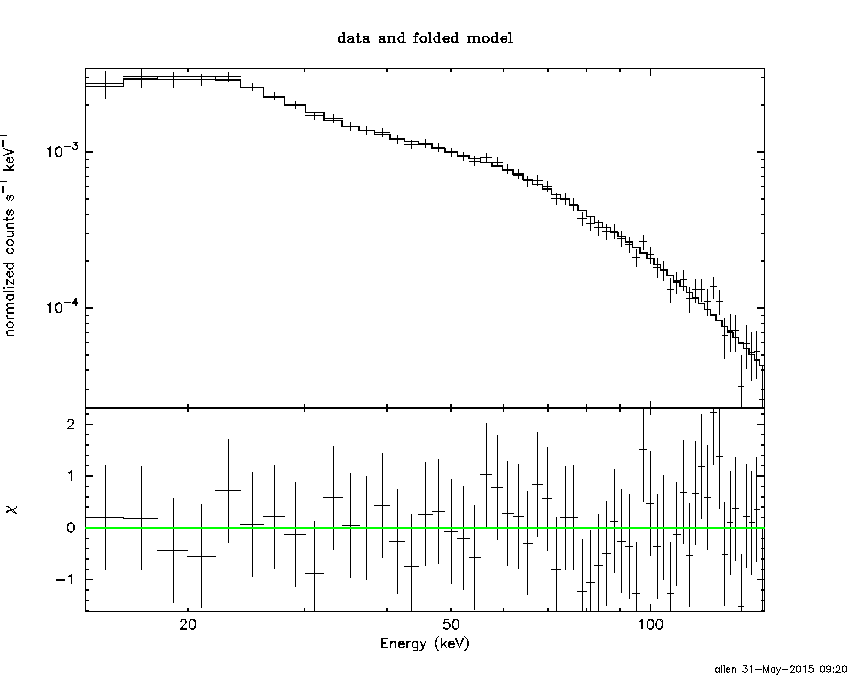
Pre-slew spectrum (Pre-slew PHA with pre-slew DRM)
Power-law model

Spectral model in power-law:
------------------------------------------------------------
Parameters  : value       lower 90%   higher 90%
Photon index: 1.60899     ( -0.0367234   0.036723 )
Norm@50keV  : 6.44766E-03    ( -0.000117151   0.000117143 )
------------------------------------------------------------
#Fit statistic : Chi-Squared =          33.27 using 59 PHA bins.
# Reduced chi-squared =         0.5837 for     57 degrees of freedom
# Null hypothesis probability =   9.949546e-01

Photon flux (15-150 keV)    in 147.1 sec: 0.830872 ( -0.0181779  0.0182733 ) ph/cm2/s
Energy fluence (15-150 keV)             : 8.86049e-06 ( -1.63766e-07  1.63871e-07 ) ergs/cm2
Cutoff power-law model

Spectral model in the cutoff power-law:
------------------------------------------------------------
Parameters  : value       lower 90%   higher 90%
Photon index: 1.55268     ( -0.147781   0.0725033 )
Epeak [keV] : 447.589      ( -447.59 -447.59 )
Norm@50keV  : 6.82822E-03    ( -0.000465496   0.00107748 )
------------------------------------------------------------
#Fit statistic : Chi-Squared =          32.83 using 59 PHA bins.
# Reduced chi-squared =         0.5863 for     56 degrees of freedom
# Null hypothesis probability =   9.942855e-01

Photon flux (15-150 keV)    in 147.1 sec: 0.826186 ( -0.021359  0.02103 ) ph/cm2/s
Energy fluence (15-150 keV)             : 8.82821e-06 ( -1.88303e-07  1.85449e-07 ) ergs/cm2
Band function
Spectral model in the Band function:
------------------------------------------------------------
Parameters  : value       lower 90%   higher 90%
alpha       : -7.42483E-02   ( -2.35698   0.0733498 )
beta        : -1.62782    ( -0.0466103   0.0424797 )
Epeak [keV] : 34.2013      ( -10.9332 65.4033 )
Norm@50keV   : 7.71915E-02    ( -0.0776651   422.825 )
------------------------------------------------------------
#Fit statistic : Chi-Squared =          30.40 using 59 PHA bins.
# Reduced chi-squared =         0.5528 for     55 degrees of freedom
# Null hypothesis probability =   9.971381e-01

Photon flux (15-150 keV)    in 147.1 sec:  (    ) ph/cm2/s
Energy fluence (15-150 keV)             : 0 ( 0  0 ) ergs/cm2
S(25-50 keV) vs. S(50-100 keV) plot
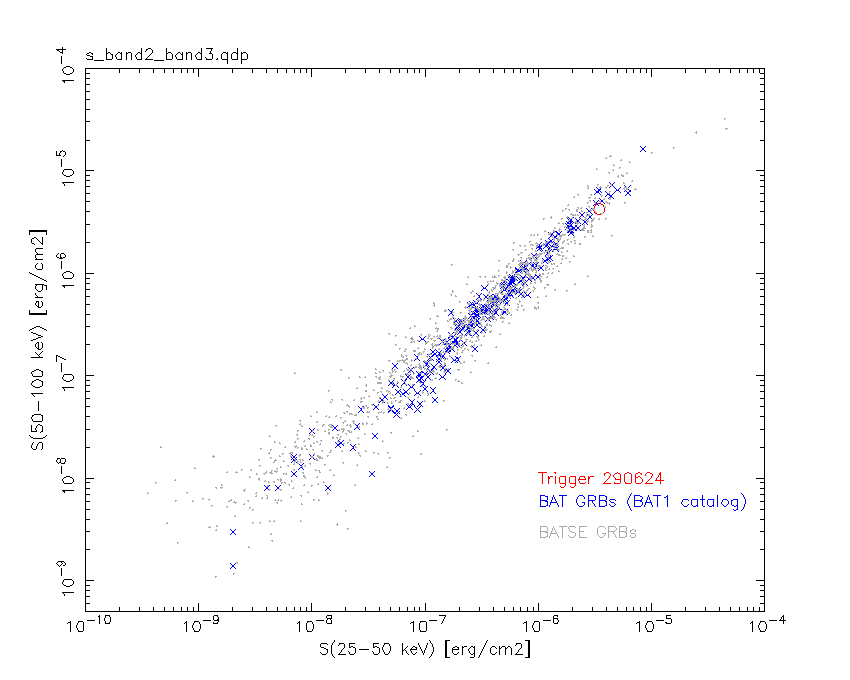
S(25-50 keV)  = 3.45e-06
S(50-100 keV) = 4.22e-06
T90 vs. Hardness ratio plot

T90                                   = 161.724000006914 sec.
Hardness ratio (energy fluence ratio) = 1.22319
Color vs. Color plot
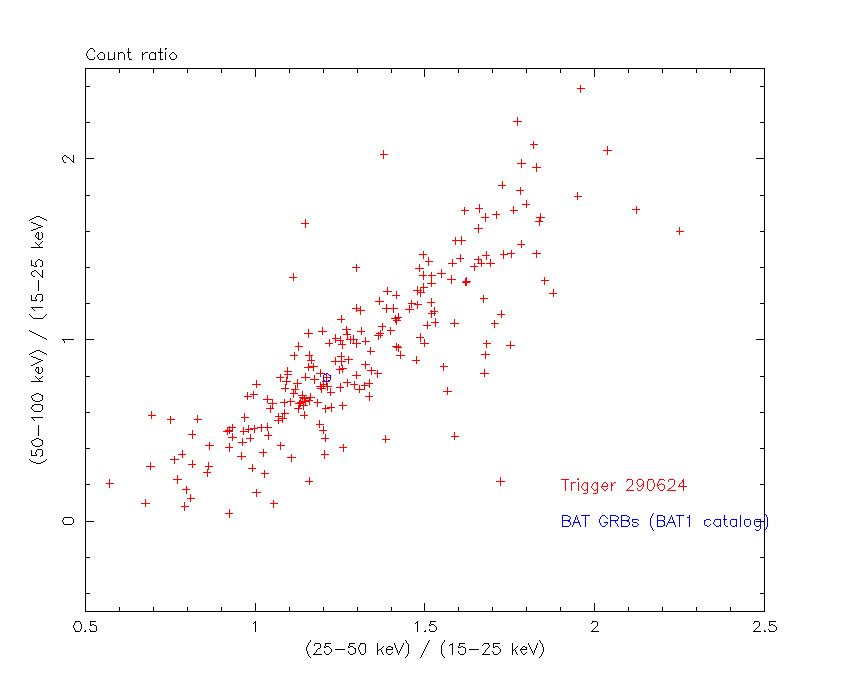
Count Ratio  (25-50 keV) / (15-25 keV) = 1.21105
Count Ratio (50-100 keV) / (15-25 keV) = 0.793222
Mask shadow pattern

IMX = -3.567525846678423E-01, IMY = -1.546368169387835E-01
TIME vs. PHA plot around the trigger time

Blue+Cyan dotted lines: Time interval of the scaled map
From 0.000000 to 1.024000
TIME vs. DetID plot around the trigger time

Blue+Cyan dotted lines: Time interval of the scaled map
From 0.000000 to 1.024000
100 us light curve (15-350 keV)
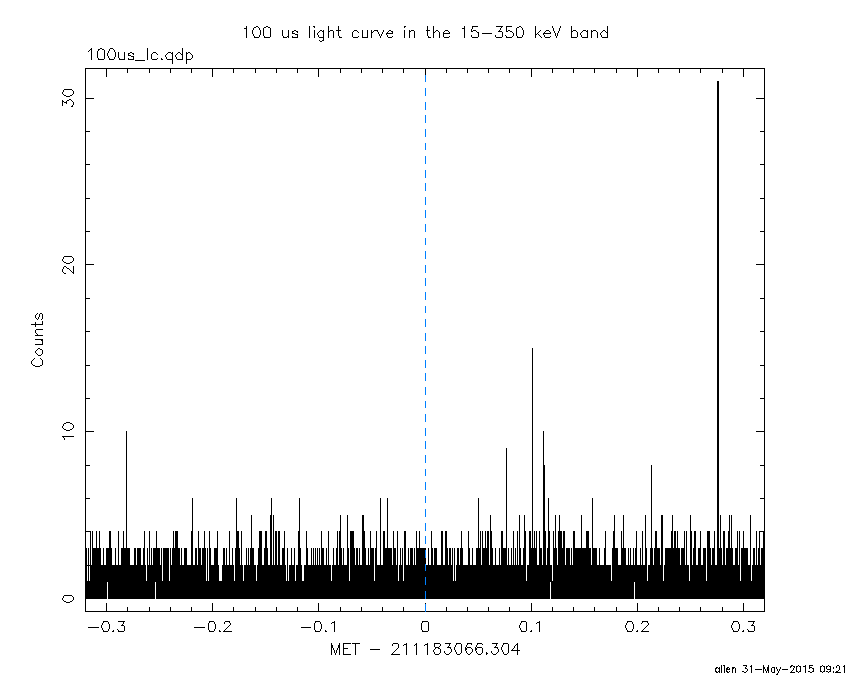
Blue+Cyan dotted lines: Time interval of the scaled map
From 0.000000 to 1.024000
Spacecraft aspect plot

Bright source in the pre-burst/pre-slew/post-slew images
Pre-burst image of 15-350 keV band
Time interval of the image:
-299.304000 -72.268000

# RAcent  DECcent POSerr Theta    Phi  PeakCts   SNR AngSep     Name
#  [deg]    [deg]    ['] [deg]  [deg]                   [']
243.4304 -72.6155    3.1  50.7  -44.5   3.1459   3.8 ------	UNKNOWN
 91.5938 -67.3851    4.0  41.0  -98.1   2.3104   2.9 ------	UNKNOWN
 84.5598 -43.9766    3.3  48.7 -130.2   2.5682   3.6 ------	UNKNOWN
Pre-slew background subtracted image of 15-350 keV band
Time interval of the image:
-72.268000 74.796590

# RAcent  DECcent POSerr Theta    Phi  PeakCts   SNR AngSep     Name
#  [deg]    [deg]    ['] [deg]  [deg]                   [']
328.7869 -27.7587    2.2  38.7   48.9   2.0922   5.2 ------	UNKNOWN
295.0636 -34.3386    2.6  54.9   14.4   4.2761   4.4 ------	UNKNOWN
 25.8079 -33.4796    0.1  21.2  156.6  14.4098  79.1 ------	UNKNOWN
 43.3539 -62.6310    2.4  21.1 -107.4   0.9262   4.8 ------	UNKNOWN
254.6895 -63.8640    3.6  54.3  -33.3   2.8475   3.2 ------	UNKNOWN
 85.6606 -49.4397    2.5  46.2 -123.6   3.5307   4.6 ------	UNKNOWN
Post-slew image of 15-350 keV band
Time interval of the image:
125.996590 302.776000

# RAcent  DECcent POSerr Theta    Phi  PeakCts   SNR AngSep     Name
#  [deg]    [deg]    ['] [deg]  [deg]                   [']
 25.8048 -33.4748    1.1  29.6  107.1   2.3601  10.8 ------	UNKNOWN
 61.8269 -41.6068    2.5  14.2 -176.3   0.5486   4.6 ------	UNKNOWN
105.9006 -27.0453    3.0  46.1 -123.8   2.3606   3.9 ------	UNKNOWN
Plot creation:
Sun May 31 09:21:11 EDT 2015