Special notes of this burst
Image
Pre-slew 15.0-350.0 keV image (Event data)
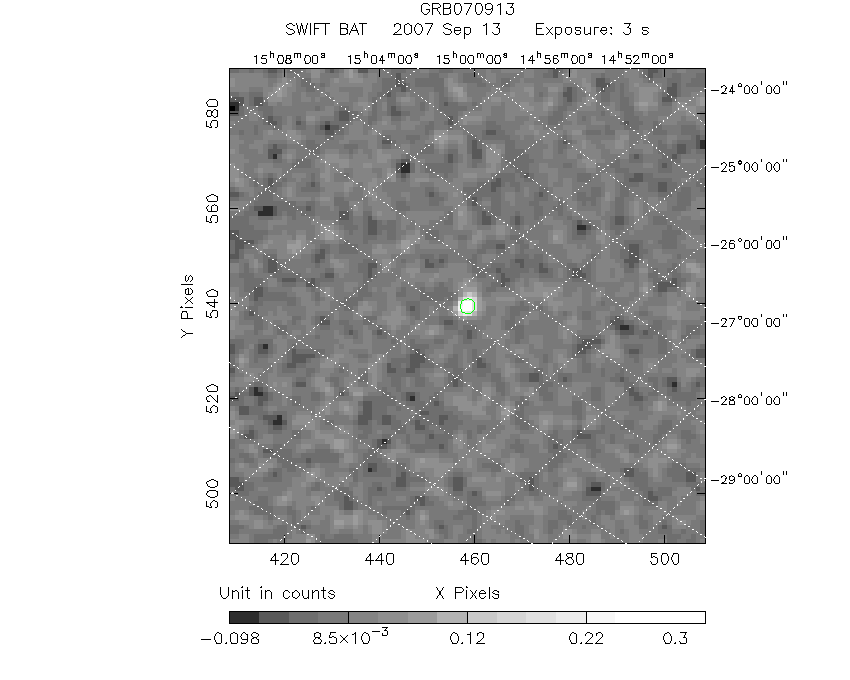
#   RAcent    DECcent   POSerr    Theta     Phi              Peak Cts       SNR   Name
  228.7358   -24.2789   0.0142    41.8157    -8.4833         0.3389504     13.477 TRIG_00290843

Foreground time interval of the image:
 -1.584   1.292 (delta_t =   2.876 [sec])
Background time interval of the image:
-239.208  -1.584 (delta_t = 237.624 [sec])
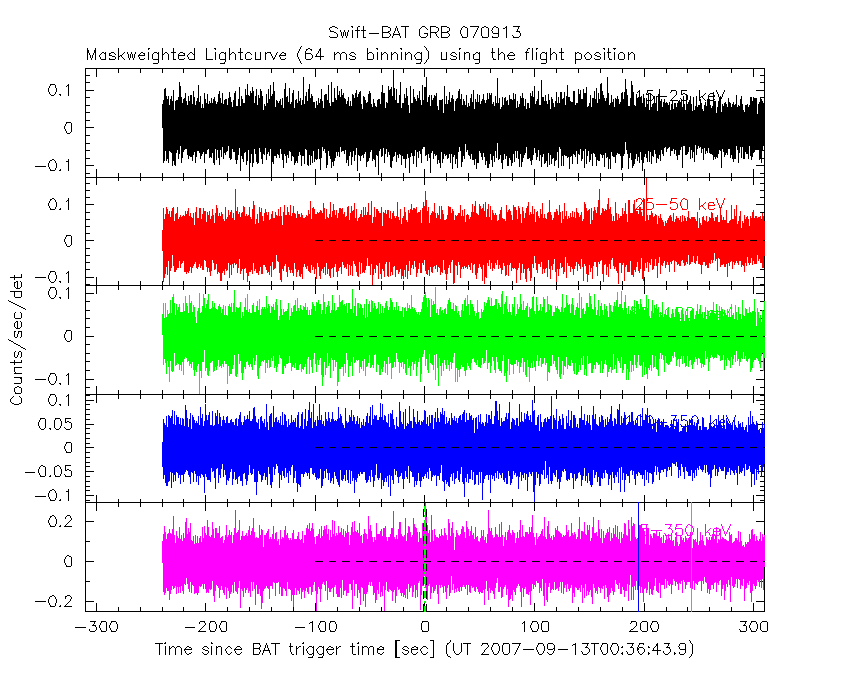
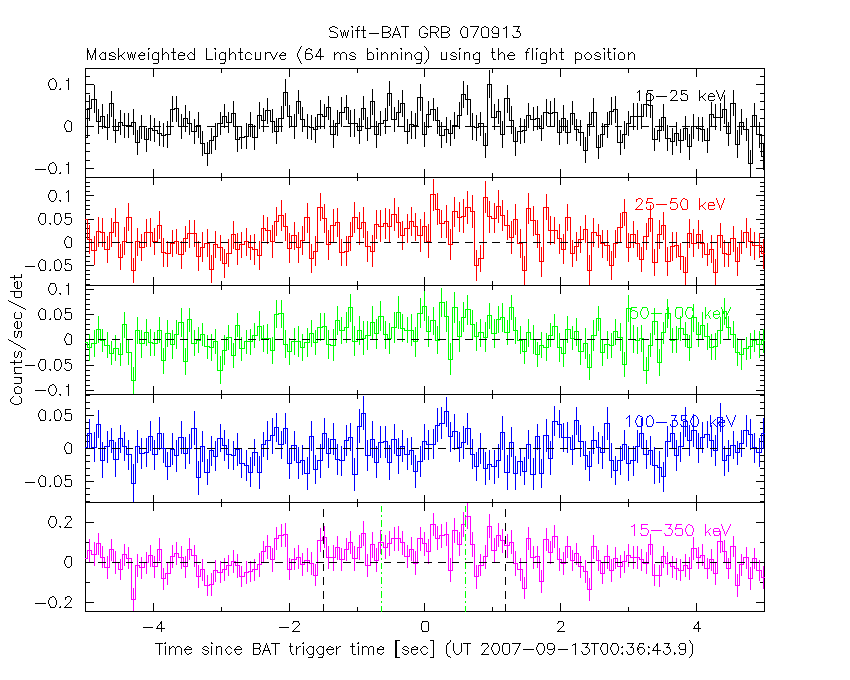
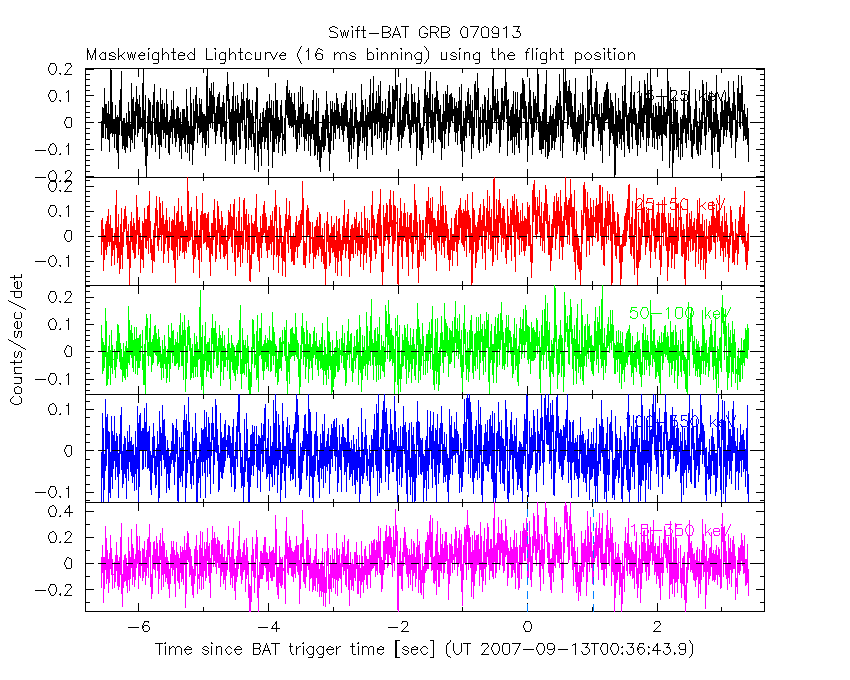
Lightcurves
Notes:
- 1) The mask-weighted light curves are using the flight position.
- 2) Multiple plots of different time binning/intervals are shown to cover all scenarios of short/long GRBs, rate/image triggers, and real/false positives.
- 3) For all the mask-weighted lightcurves, the y-axis units are counts/sec/det where a det is 0.4 x 0.4 = 0.16 sq cm.
- 4) The verticle lines correspond to following: green dotted lines are T50 interval, black dotted lines are T90 interval, blue solid line(s) is a spacecraft slew start time, and orange solid line(s) is a spacecraft slew end time.
- 5) Time of each bin is in the middle of the bin.
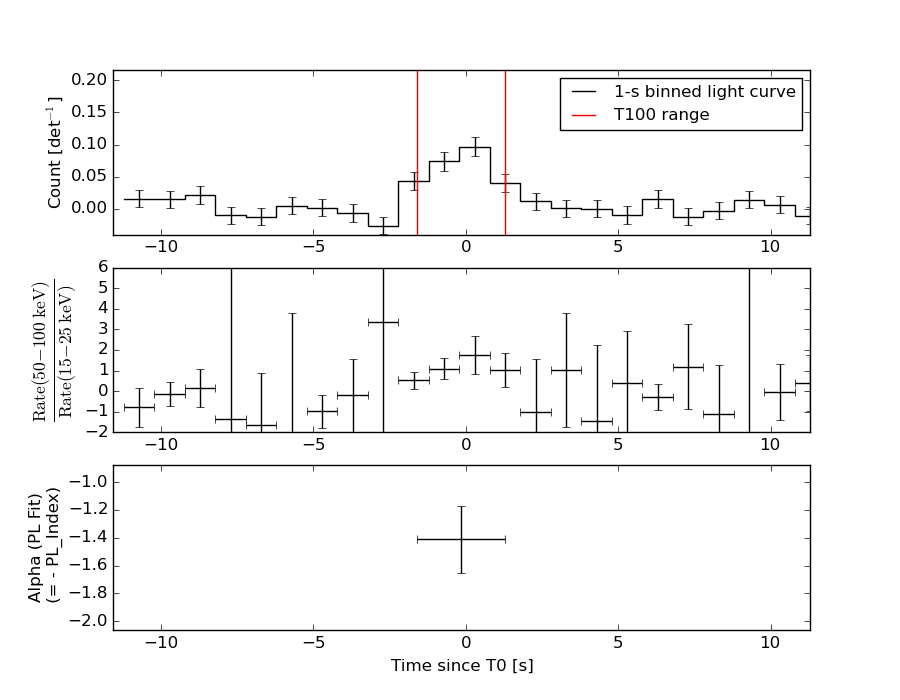
1 s binning
From T0-310 s to T0+310 s

From T100_start - 20 s to T100_end + 30 s

Full time interval

64 ms binning
Full time interval
From T100_start to T100_end

From T0-5 sec to T0+5 sec
16 ms binning
From T100_start-5 s to T100_start+5 s
Blue+Cyan dotted lines: Time interval of the scaled map
From 0.000000 to 1.024000
8 ms binning
From T100_start-3 s to T100_start+3 s
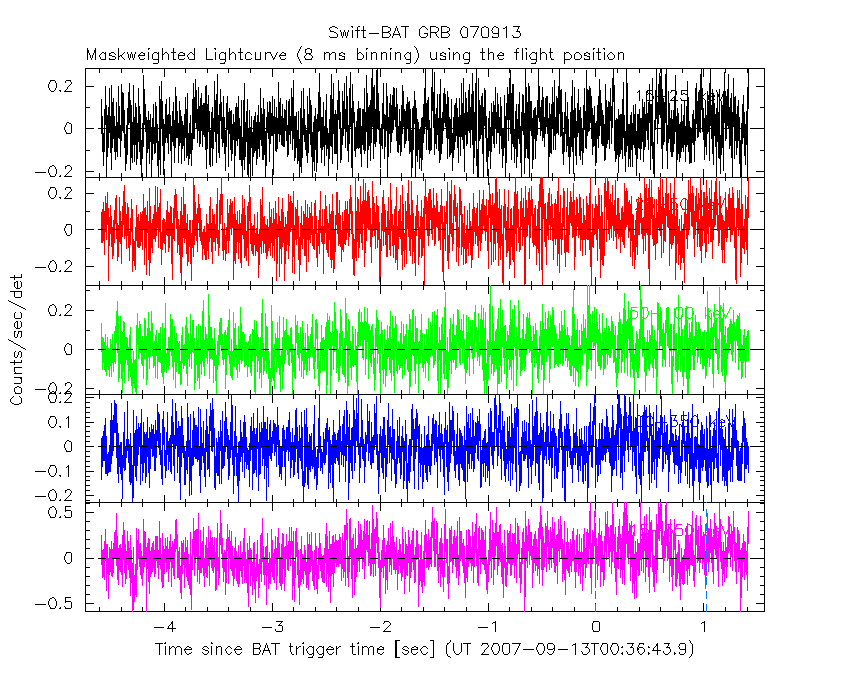
Blue+Cyan dotted lines: Time interval of the scaled map
From 0.000000 to 1.024000
2 ms binning
From T100_start-1 s to T100_start+1 s
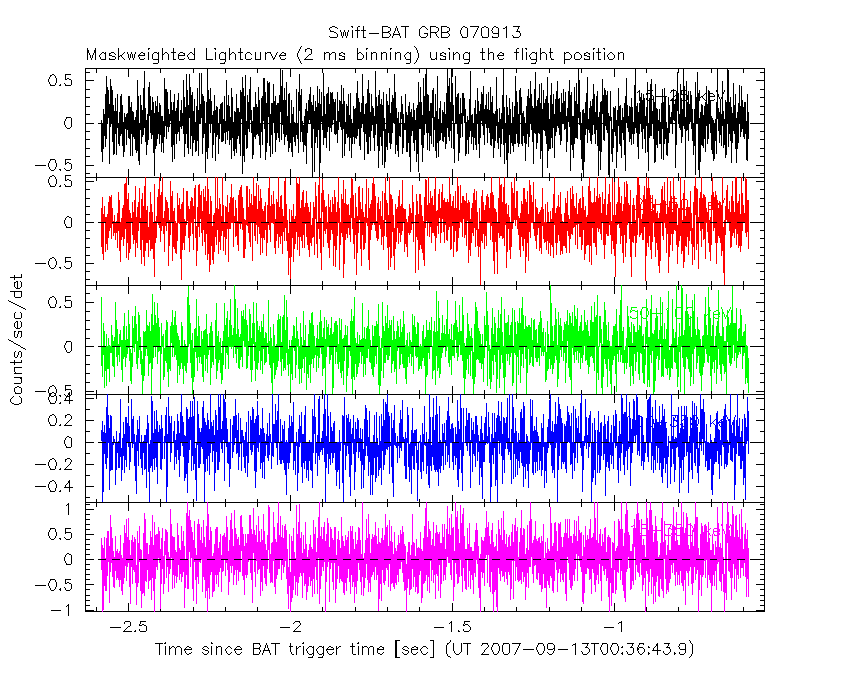
Blue+Cyan dotted lines: Time interval of the scaled map
From 0.000000 to 1.024000
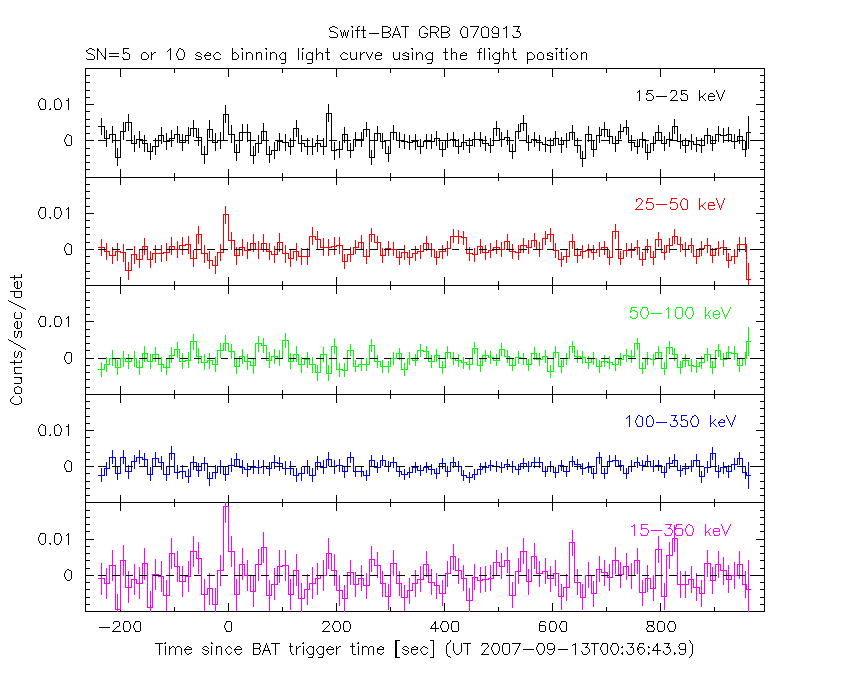
SN=5 or 10 sec. binning (whichever binning is satisfied first)
SN=5 or 10 sec. binning (T < 200 sec)

Quad-rate summed light curves (from T0-300s to T0+1000s)

Spectral Evolution
Spectra
Notes:
- 1) The fitting includes the systematic errors.
- 2) When the burst includes telescope slew time periods, the fitting uses an average response file made from multiple 5-s response files through out the slew time plus single time preiod for the non-slew times, and weighted by the total counts in the corresponding time period using addrmf. An average response file is needed becuase a spectral fit using the pre-slew DRM will introduce some errors in both a spectral shape and a normalization if the PHA file contains a lot of the slew/post-slew time interval.
- 3) For fits to more complicated models (e.g. a power-law over a cutoff power-law), the BAT team has decided to require a chi-square improvement of more than 6 for each extra dof.
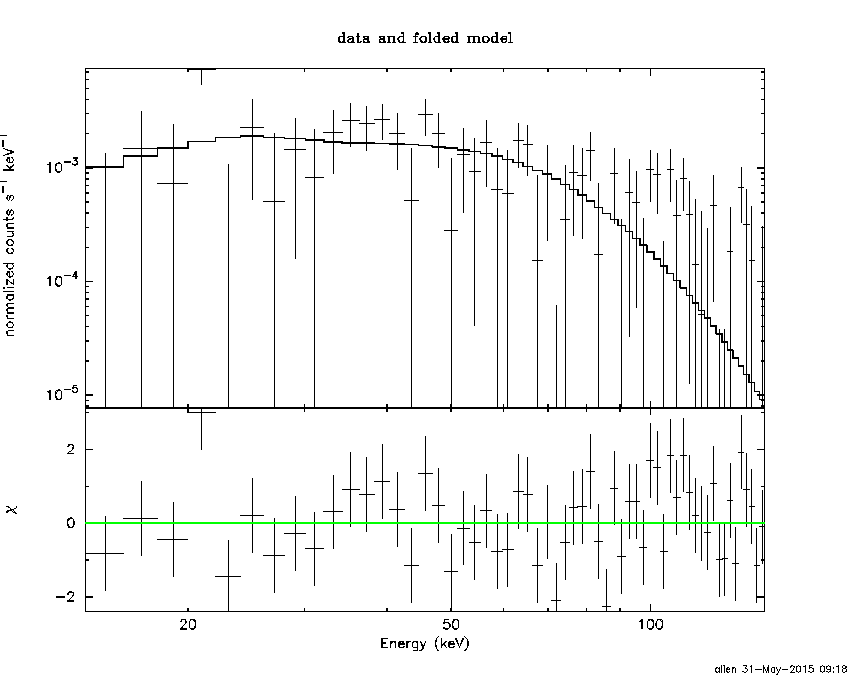
Time averaged spectrum fit using the average DRM
Power-law model

Time interval is from   -1.584 sec. to    1.292 sec.

Spectral model in power-law:
------------------------------------------------------------
Parameters  : value       lower 90%   higher 90%
Photon index: 1.41195     ( -0.240885   0.239301 )
Norm@50keV  : 6.11105E-03    ( -0.0009461   0.000945247 )
------------------------------------------------------------
#Fit statistic : Chi-Squared =          67.49 using 59 PHA bins.
# Reduced chi-squared =          1.184 for     57 degrees of freedom
# Null hypothesis probability =   1.612000e-01

Photon flux (15-150 keV)    in 2.876 sec: 0.746337 ( -0.118926  0.119288 ) ph/cm2/s
Energy fluence (15-150 keV)             : 1.69411e-07 ( -2.79359e-08  2.81956e-08 ) ergs/cm2
Cutoff power-law model

Time interval is from   -1.584 sec. to    1.292 sec.
Spectral model in the cutoff power-law:
------------------------------------------------------------
Parameters  : value       lower 90%   higher 90%
Photon index: -0.724729     ( -2.14218   1.40332 )
Epeak [keV] : 62.3014      ( -11.6058 30.6109 )
Norm@50keV  : 7.44782E-02    ( -0.0744879   0.819108 )
------------------------------------------------------------
#Fit statistic : Chi-Squared =          59.50 using 59 PHA bins.
# Reduced chi-squared =          1.062 for     56 degrees of freedom
# Null hypothesis probability =   3.494977e-01

Photon flux (15-150 keV)    in 2.876 sec: 0.695263 ( -0.123743  0.124237 ) ph/cm2/s
Energy fluence (15-150 keV)             : 1.48223e-07 ( -2.9865e-08  3.15431e-08 ) ergs/cm2
Band function

Time interval is from   -1.584 sec. to    1.292 sec.

Spectral model in the Band function:
------------------------------------------------------------
Parameters  : value       lower 90%   higher 90%
alpha       : 0.721856   ( -0.612229   1.302 )
beta        : -10.00000    ( 10   8.78166e-07 )
Epeak [keV] : 62.3265      ( -10.0969 30.6548 )
Norm@50keV   : 7.42135E-02    ( -0.0110581   0.816422 )
------------------------------------------------------------
#Fit statistic : Chi-Squared =          59.50 using 59 PHA bins.
# Reduced chi-squared =          1.082 for     55 degrees of freedom
# Null hypothesis probability =   3.152863e-01

Photon flux (15-150 keV)    in 2.876 sec:  (    ) ph/cm2/s
Energy fluence (15-150 keV)             : 1.54999e-07 ( 0  0 ) ergs/cm2
Single BB

Spectral model blackbody:
------------------------------------------------------------
Parameters  : value    Lower 90%  Upper 90%
kT [keV]    : 14.9876  (-2.13013  2.61697)
R^2/D10^2   : 9.34689E-02  (-0.0412616   0.0682733)
(R is the radius in km and D10 is the distance to the source in units of 10 kpc)
------------------------------------------------------------
#Fit statistic : Chi-Squared =          60.19 using 59 PHA bins.
# Reduced chi-squared =          1.056 for     57 degrees of freedom
# Null hypothesis probability =   3.611879e-01

Energy  Fluence     90% Error
[keV]   [erg/cm2]   [erg/cm2]
15- 25  1.264e-08   3.858e-09
25- 50  5.020e-08   1.247e-08
50-150  7.672e-08   2.061e-08
15-150  1.396e-07   2.968e-08
Thermal bremsstrahlung (OTTB)

Spectral model: thermal bremsstrahlung
------------------------------------------------------------
Parameters  : value         Lower 90%    Upper 90%
kT [keV]    : 199.363       (-79.0366      -199.363)
Norm        : 3.13407       (-0.479942     0.479922)
------------------------------------------------------------
#Fit statistic : Chi-Squared =          65.94 using 59 PHA bins.
# Reduced chi-squared =          1.157 for     57 degrees of freedom
# Null hypothesis probability =   1.952080e-01

Energy  Fluence     90% Error
[keV]   [erg/cm2]   [erg/cm2]
15- 25  2.244e-08   1.287e-08
25- 50  4.317e-08   2.412e-08
50-150  9.469e-08   5.272e-08
15-150  1.603e-07   8.998e-08
Double BB

Spectral model: bbodyrad<1> + bbodyrad<2>
------------------------------------------------------------
Parameters  : value         Lower 90%    Upper 90%
kT1 [keV]   : 13.0551        (-13.0486      3.29799)
R1^2/D10^2  : 0.134683        (-0.134824      -0.134824)
kT2 [keV]   : 71.4935        (-70.8866      -70.8866)
R2^2/D10^2  : 2.54917E-04    (-0.000260149   0.122943)
------------------------------------------------------------
#Fit statistic : Chi-Squared =          58.15 using 59 PHA bins.
# Reduced chi-squared =          1.057 for     55 degrees of freedom
# Null hypothesis probability =   3.600768e-01

Energy  Fluence     90% Error
[keV]   [erg/cm2]   [erg/cm2]
15- 25  1.431e-08   7.261e-09
25- 50  5.080e-08   2.846e-08
50-150  9.087e-08   4.758e-08
15-150  1.560e-07   8.349e-08
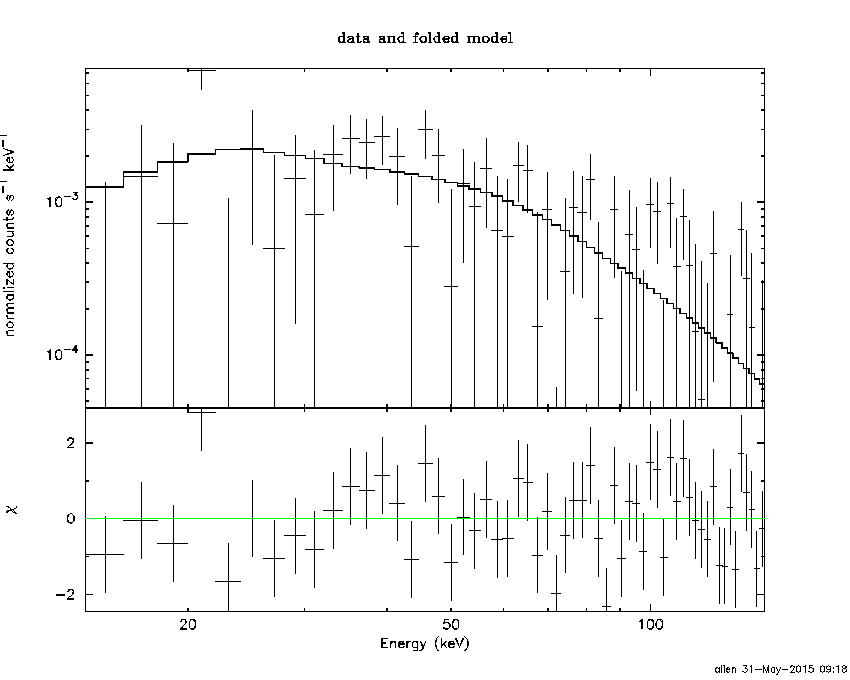
Peak spectrum fit
Power-law model

Time interval is from   -0.260 sec. to    0.740 sec.

Spectral model in power-law:
------------------------------------------------------------
Parameters  : value       lower 90%   higher 90%
Photon index: 1.26371     ( -0.350505   0.336012 )
Norm@50keV  : 7.53603E-03    ( -0.00161782   0.00161598 )
------------------------------------------------------------
#Fit statistic : Chi-Squared =          66.56 using 59 PHA bins.
# Reduced chi-squared =          1.168 for     57 degrees of freedom
# Null hypothesis probability =   1.809910e-01

Photon flux (15-150 keV)    in 1 sec: 0.893363 ( -0.200938  0.202652 ) ph/cm2/s
Energy fluence (15-150 keV)             : 7.51504e-08 ( -1.68375e-08  1.69678e-08 ) ergs/cm2
Cutoff power-law model

Time interval is from   -0.260 sec. to    0.740 sec.
Spectral model in the cutoff power-law:
------------------------------------------------------------
Parameters  : value       lower 90%   higher 90%
Photon index: -0.174524     ( -2.81028   1.54451 )
Epeak [keV] : 78.6496      ( -24.9305 -78.5642 )
Norm@50keV  : 3.78623E-02    ( -0.0380244   0.900602 )
------------------------------------------------------------
#Fit statistic : Chi-Squared =          64.18 using 59 PHA bins.
# Reduced chi-squared =          1.146 for     56 degrees of freedom
# Null hypothesis probability =   2.118106e-01

Photon flux (15-150 keV)    in 1 sec: 0.854846 ( -0.205206  0.207244 ) ph/cm2/s
Energy fluence (15-150 keV)             : 6.95092e-08 ( -1.90522e-08  1.8657e-08 ) ergs/cm2
Band function

Time interval is from   -0.260 sec. to    0.740 sec.

Spectral model in the Band function:
------------------------------------------------------------
Parameters  : value       lower 90%   higher 90%
alpha       : 0.176277   ( 0.282707   1.4178 )
beta        : -10.00000    ( 10   20 )
Epeak [keV] : 78.5749      ( -21.0059 -78.5749 )
Norm@50keV   : 3.79639E-02    ( -0.00796066   0.898794 )
------------------------------------------------------------
#Fit statistic : Chi-Squared =          64.18 using 59 PHA bins.
# Reduced chi-squared =          1.167 for     55 degrees of freedom
# Null hypothesis probability =   1.858698e-01

Photon flux (15-150 keV)    in 1 sec: 0.826387 (    ) ph/cm2/s
Energy fluence (15-150 keV)             : 7.02394e-08 ( 0  0 ) ergs/cm2
Single BB
Spectral model blackbody:
------------------------------------------------------------
Parameters  : value    Lower 90%  Upper 90%
kT [keV]    : 16.6755  (-3.46576  4.97752)
R^2/D10^2   : 7.87271E-02  (-0.0472861   0.0989848)
(R is the radius in km and D10 is the distance to the source in units of 10 kpc)
------------------------------------------------------------
#Fit statistic : Chi-Squared =          65.26 using 59 PHA bins.
# Reduced chi-squared =          1.145 for     57 degrees of freedom
# Null hypothesis probability =   2.116446e-01

Energy  Fluence     90% Error
[keV]   [erg/cm2]   [erg/cm2]
15- 25  4.482e-09   1.972e-09
25- 50  1.952e-08   8.260e-09
50-150  3.851e-08   1.594e-08
15-150  6.252e-08   2.158e-08
Thermal bremsstrahlung (OTTB)

Spectral model: thermal bremsstrahlung
------------------------------------------------------------
Parameters  : value         Lower 90%    Upper 90%
kT [keV]    : 200.000       (      )
Norm        : 3.80287       (-0.82151     0.821402)
------------------------------------------------------------
#Fit statistic : Chi-Squared =          67.66 using 59 PHA bins.
# Reduced chi-squared =          1.187 for     57 degrees of freedom
# Null hypothesis probability =   1.576796e-01

Energy  Fluence     90% Error
[keV]   [erg/cm2]   [erg/cm2]
15- 25  9.475e-09   5.750e-09
25- 50  1.823e-08   1.070e-08
50-150  3.997e-08   2.279e-08
15-150  6.767e-08   3.965e-08
Double BB
R1^2/D10^2  : 0.167530        (      )
kT2 [keV]   : 45.0805        (-40.5285      -40.5285)
R2^2/D10^2  : 1.54141E-03    (   )
------------------------------------------------------------
#Fit statistic : Chi-Squared =          62.86 using 59 PHA bins.
#Fit statistic : Chi-Squared =          62.83 using 59 PHA bins.
#Fit statistic : Chi-Squared =          62.82 using 59 PHA bins.
# Reduced chi-squared =          1.143 for     55 degrees of freedom
# Reduced chi-squared =          1.142 for     55 degrees of freedom
# Reduced chi-squared =          1.142 for     55 degrees of freedom
# Null hypothesis probability =   2.178214e-01
# Null hypothesis probability =   2.185537e-01
# Null hypothesis probability =   2.190432e-01

Energy  Fluence     90% Error
[keV]   [erg/cm2]   [erg/cm2]
15- 25  5.839e-09   3.837e-09
25- 50  2.008e-08   1.251e-08
50-150  4.640e-08   2.541e-08
15-150  7.232e-08   3.728e-08
Pre-slew spectrum (Pre-slew PHA with pre-slew DRM)
Power-law model

Spectral model in power-law:
------------------------------------------------------------
Parameters  : value       lower 90%   higher 90%
Photon index: 1.41195     ( -0.240885   0.239301 )
Norm@50keV  : 6.11105E-03    ( -0.0009461   0.000945247 )
------------------------------------------------------------
#Fit statistic : Chi-Squared =          67.49 using 59 PHA bins.
# Reduced chi-squared =          1.184 for     57 degrees of freedom
# Null hypothesis probability =   1.612000e-01

Photon flux (15-150 keV)    in 2.876 sec: 0.746337 ( -0.118926  0.119288 ) ph/cm2/s
Energy fluence (15-150 keV)             : 1.69411e-07 ( -2.79359e-08  2.81956e-08 ) ergs/cm2
Cutoff power-law model

Spectral model in the cutoff power-law:
------------------------------------------------------------
Parameters  : value       lower 90%   higher 90%
Photon index: -0.724729     ( -2.14218   1.40332 )
Epeak [keV] : 62.3014      ( -11.6058 30.6109 )
Norm@50keV  : 7.44782E-02    ( -0.0744879   0.819108 )
------------------------------------------------------------
#Fit statistic : Chi-Squared =          59.50 using 59 PHA bins.
# Reduced chi-squared =          1.062 for     56 degrees of freedom
# Null hypothesis probability =   3.494977e-01

Photon flux (15-150 keV)    in 2.876 sec: 0.695263 ( -0.123743  0.124237 ) ph/cm2/s
Energy fluence (15-150 keV)             : 1.48223e-07 ( -2.9865e-08  3.15431e-08 ) ergs/cm2
Band function

Spectral model in the Band function:
------------------------------------------------------------
Parameters  : value       lower 90%   higher 90%
alpha       : 0.721856   ( -0.612229   1.302 )
beta        : -10.00000    ( 10   8.78166e-07 )
Epeak [keV] : 62.3265      ( -10.0969 30.6548 )
Norm@50keV   : 7.42135E-02    ( -0.0110581   0.816422 )
------------------------------------------------------------
#Fit statistic : Chi-Squared =          59.50 using 59 PHA bins.
# Reduced chi-squared =          1.082 for     55 degrees of freedom
# Null hypothesis probability =   3.152863e-01

Photon flux (15-150 keV)    in 2.876 sec:  (    ) ph/cm2/s
Energy fluence (15-150 keV)             : 1.54999e-07 ( 0  0 ) ergs/cm2
S(25-50 keV) vs. S(50-100 keV) plot

S(25-50 keV)  = 4.01e-08
S(50-100 keV) = 6.02e-08
T90 vs. Hardness ratio plot
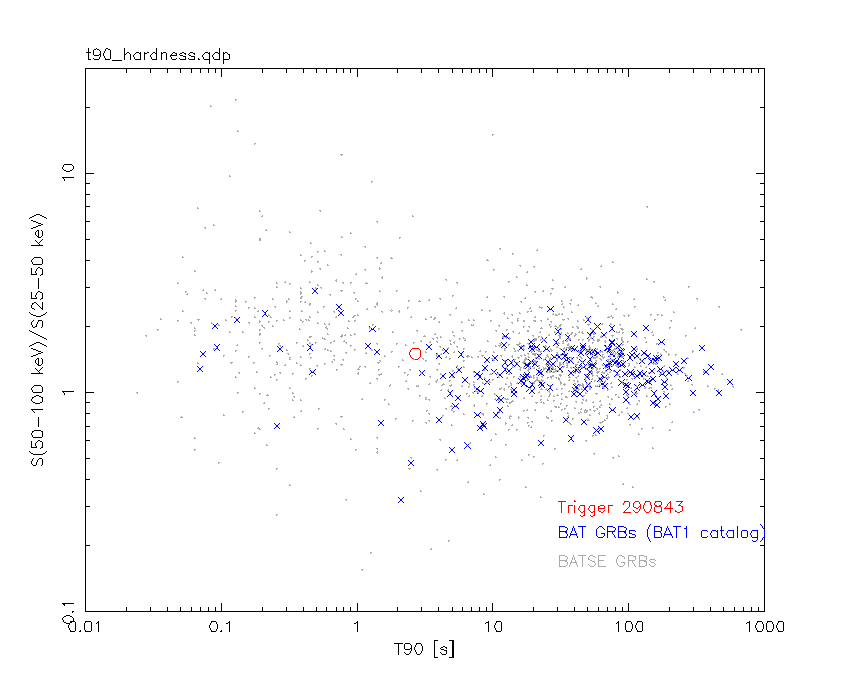
T90                                   = 2.68399998545647 sec.
Hardness ratio (energy fluence ratio) = 1.50125
Color vs. Color plot

Count Ratio  (25-50 keV) / (15-25 keV) = 1.77835
Count Ratio (50-100 keV) / (15-25 keV) = 1.22706
Mask shadow pattern

IMX = 8.848086431628168E-01, IMY = 1.319718418351068E-01
TIME vs. PHA plot around the trigger time
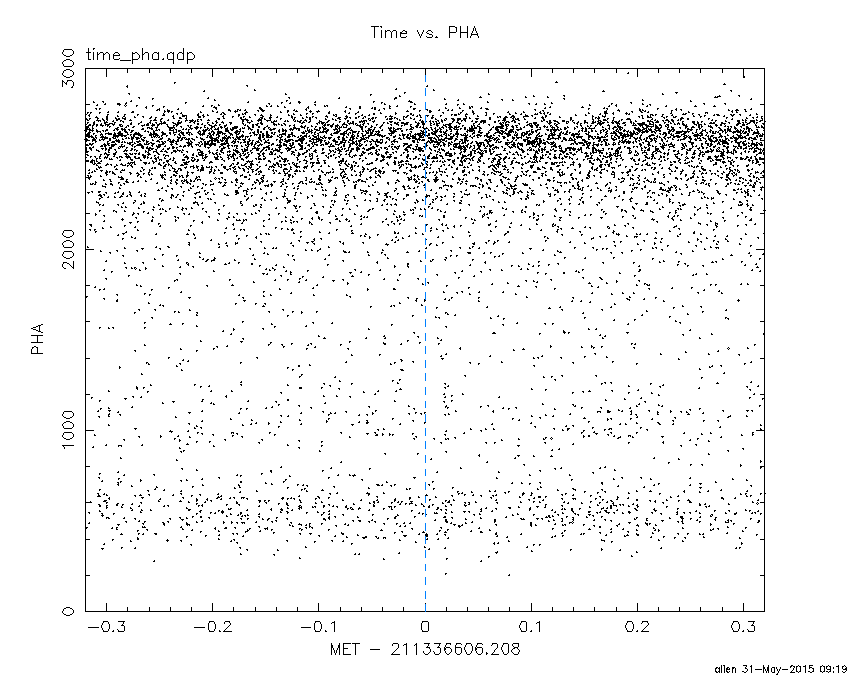
Blue+Cyan dotted lines: Time interval of the scaled map
From 0.000000 to 1.024000
TIME vs. DetID plot around the trigger time
Blue+Cyan dotted lines: Time interval of the scaled map
From 0.000000 to 1.024000
100 us light curve (15-350 keV)

Blue+Cyan dotted lines: Time interval of the scaled map
From 0.000000 to 1.024000
Spacecraft aspect plot

Bright source in the pre-burst/pre-slew/post-slew images
Pre-burst image of 15-350 keV band
Time interval of the image:
-239.208000 -1.584000

# RAcent  DECcent POSerr Theta    Phi  PeakCts   SNR AngSep     Name
#  [deg]    [deg]    ['] [deg]  [deg]                   [']
135.5425 -40.5520    1.7  38.2 -158.4   1.7570   6.9    0.7	Vela X-1
170.4916 -60.6249    1.9  11.8  166.1   0.9002   6.1    5.2	Cen X-3
186.7073 -62.8005    1.4   8.0  123.7   1.3142   8.1    2.3	GX 301-2
256.0428 -37.8634    4.4  46.6   29.9   1.1979   2.6    2.9	4U 1700-377
256.3456 -36.5173    6.0  47.7   28.8   1.0049   1.9    7.1	GX 349+2
264.6514 -44.4767    5.6  47.0   42.6   1.4590   2.1    4.2	4U 1735-44
 99.9193 -56.8748    2.3  46.8  161.4   1.9470   4.9 ------	UNKNOWN
201.4098 -43.0386    1.9  14.0  -30.7   0.9440   6.0 ------	UNKNOWN
211.8868 -33.3116    2.0  26.5  -23.0   0.8877   5.7 ------	UNKNOWN
121.7310 -30.7616    3.0  53.1 -159.6   1.8556   3.9 ------	UNKNOWN
165.2422 -32.5457    2.2  28.4 -115.3   1.0707   5.2 ------	UNKNOWN
130.9138 -28.3742    2.9  49.6 -149.9   1.5359   3.9 ------	UNKNOWN
Pre-slew background subtracted image of 15-350 keV band
Time interval of the image:
-1.584000 1.292000

# RAcent  DECcent POSerr Theta    Phi  PeakCts   SNR AngSep     Name
#  [deg]    [deg]    ['] [deg]  [deg]                   [']
135.5175 -40.5586  299.6  38.2 -158.4   0.0009   0.0    0.6	Vela X-1
170.1903 -60.5755    4.0  11.9  166.6   0.0437   2.9    4.7	Cen X-3
186.8259 -62.8478    6.4   8.1  123.3   0.0282   1.8    6.6	GX 301-2
256.1076 -38.0418    0.0  46.5   30.1  -0.0382  -0.8   13.2	4U 1700-377
256.5248 -36.3911    8.0  47.9   28.8  -0.0787  -1.5    4.7	GX 349+2
264.5559 -44.3207   10.8  47.0   42.4  -0.0777  -1.1   11.2	4U 1735-44
235.4082 -41.0435    2.2  32.7   16.8   0.1075   5.3 ------	UNKNOWN
228.7356 -24.2788    0.9  41.8   -8.5   0.3389  13.5 ------	UNKNOWN
228.6402 -12.2886    2.1  52.2  -16.7   0.2208   5.5 ------	UNKNOWN
171.4490 -19.7385    2.0  37.9  -96.4   0.2515   5.7 ------	UNKNOWN
Post-slew image of 15-350 keV band
Time interval of the image:
243.292590 962.837900

# RAcent  DECcent POSerr Theta    Phi  PeakCts   SNR AngSep     Name
#  [deg]    [deg]    ['] [deg]  [deg]                   [']
170.0962 -60.6520    4.6  32.9 -149.3   1.4427   2.5    6.7	Cen X-3
186.7145 -62.7759    1.4  24.8 -149.9   4.0521   8.0    1.6	GX 301-2
244.9817 -15.6414    0.3  40.9   -8.2  25.1070  40.2    0.1	Sco X-1
255.9802 -37.8514    0.5  22.9   24.2   9.7718  23.2    0.5	4U 1700-377
256.4609 -36.4264    1.7  24.4   23.2   3.1084   6.9    1.2	GX 349+2
263.0292 -24.7404    2.3  37.3   22.0   3.2979   5.1    1.1	GX 1+4
264.5371 -44.3962    6.8  22.1   48.2   0.8861   1.7    9.4	4U 1735-44
270.1209 -24.9223    0.0  40.2   31.1   1.3469   1.7   12.9	GX 5-1
270.2215 -25.6089    7.3  39.7   31.8   1.2378   1.6    9.2	GRS 1758-258
274.0057 -14.0364   90.1  51.5   28.3   0.2656   0.1    0.0	GX 17+2
276.0717 -30.3714   11.5  38.6   42.8   0.8167   1.0    7.6	H1820-303
263.0619 -33.8794   16.4  29.4   30.3  -0.3482  -0.7    4.5	GX 354-0
276.5792 -37.1902    2.7  33.7   50.8   2.9437   4.3 ------	UNKNOWN
218.4388  -6.6699    3.8  50.7  -44.5   7.3366   3.1 ------	UNKNOWN
196.0402 -25.5216    2.9  41.0  -82.5   9.3092   3.9 ------	UNKNOWN
Plot creation:
Sun May 31 09:19:44 EDT 2015