Special notes of this burst
Image
Pre-slew 15.0-350.0 keV image (Event data)
#   RAcent    DECcent   POSerr    Theta     Phi              Peak Cts       SNR   Name
  293.9204     2.4244   0.0031    20.3668    42.4564         3.4417314     61.856 TRIG_00291292

Foreground time interval of the image:
 -0.104  15.128 (delta_t =  15.232 [sec])
Background time interval of the image:
-239.912  -0.104 (delta_t = 239.808 [sec])
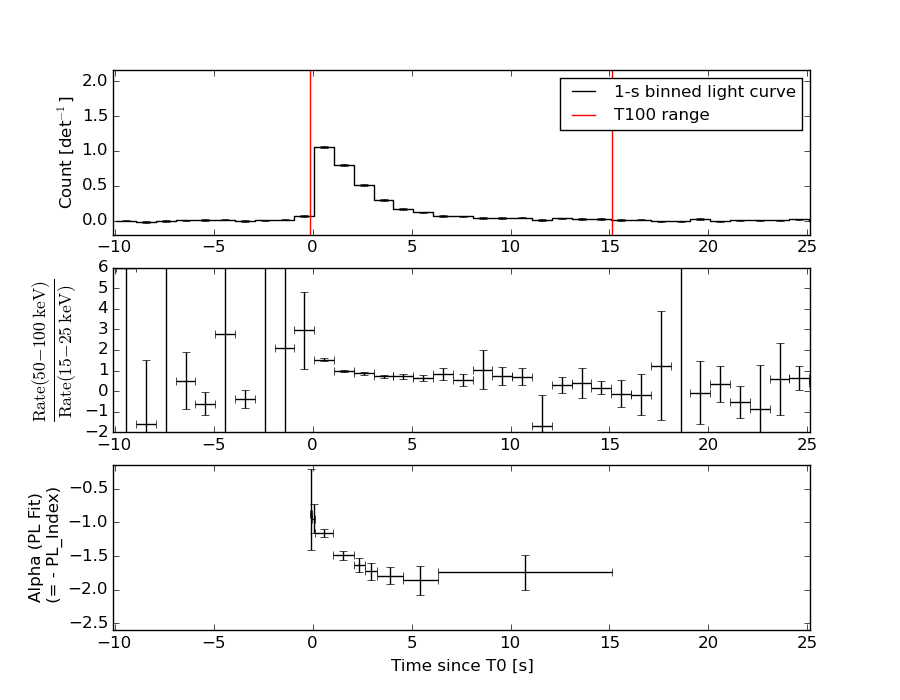
Lightcurves
Notes:
- 1) The mask-weighted light curves are using the flight position.
- 2) Multiple plots of different time binning/intervals are shown to cover all scenarios of short/long GRBs, rate/image triggers, and real/false positives.
- 3) For all the mask-weighted lightcurves, the y-axis units are counts/sec/det where a det is 0.4 x 0.4 = 0.16 sq cm.
- 4) The verticle lines correspond to following: green dotted lines are T50 interval, black dotted lines are T90 interval, blue solid line(s) is a spacecraft slew start time, and orange solid line(s) is a spacecraft slew end time.
- 5) Time of each bin is in the middle of the bin.
1 s binning
From T0-310 s to T0+310 s

From T100_start - 20 s to T100_end + 30 s
Full time interval

64 ms binning
Full time interval
From T100_start to T100_end
From T0-5 sec to T0+5 sec

16 ms binning
From T100_start-5 s to T100_start+5 s
Blue+Cyan dotted lines: Time interval of the scaled map
From 0.000000 to 1.024000
8 ms binning
From T100_start-3 s to T100_start+3 s

Blue+Cyan dotted lines: Time interval of the scaled map
From 0.000000 to 1.024000
2 ms binning
From T100_start-1 s to T100_start+1 s

Blue+Cyan dotted lines: Time interval of the scaled map
From 0.000000 to 1.024000
SN=5 or 10 sec. binning (whichever binning is satisfied first)

SN=5 or 10 sec. binning (T < 200 sec)

Quad-rate summed light curves (from T0-300s to T0+1000s)

Spectral Evolution
Spectra
Notes:
- 1) The fitting includes the systematic errors.
- 2) When the burst includes telescope slew time periods, the fitting uses an average response file made from multiple 5-s response files through out the slew time plus single time preiod for the non-slew times, and weighted by the total counts in the corresponding time period using addrmf. An average response file is needed becuase a spectral fit using the pre-slew DRM will introduce some errors in both a spectral shape and a normalization if the PHA file contains a lot of the slew/post-slew time interval.
- 3) For fits to more complicated models (e.g. a power-law over a cutoff power-law), the BAT team has decided to require a chi-square improvement of more than 6 for each extra dof.
Time averaged spectrum fit using the average DRM
Power-law model
Time interval is from   -0.104 sec. to   15.128 sec.

Spectral model in power-law:
------------------------------------------------------------
Parameters  : value       lower 90%   higher 90%
Photon index: 1.49650     ( -0.0515707   0.0515692 )
Norm@50keV  : 1.46307E-02    ( -0.000388904   0.000388882 )
------------------------------------------------------------
#Fit statistic : Chi-Squared =          42.59 using 59 PHA bins.
# Reduced chi-squared =         0.7472 for     57 degrees of freedom
# Null hypothesis probability =   9.221532e-01

Photon flux (15-150 keV)    in 15.23 sec: 1.82477 ( -0.0537842  0.053956 ) ph/cm2/s
Energy fluence (15-150 keV)             : 2.11504e-06 ( -5.95565e-08  5.96544e-08 ) ergs/cm2
Cutoff power-law model

Time interval is from   -0.104 sec. to   15.128 sec.
Spectral model in the cutoff power-law:
------------------------------------------------------------
Parameters  : value       lower 90%   higher 90%
Photon index: 1.40801     ( -0.199875   0.118152 )
Epeak [keV] : 365.143      ( -365.144 -365.144 )
Norm@50keV  : 1.60693E-02    ( -0.00173504   0.00367108 )
------------------------------------------------------------
#Fit statistic : Chi-Squared =          41.98 using 59 PHA bins.
# Reduced chi-squared =         0.7496 for     56 degrees of freedom
# Null hypothesis probability =   9.178128e-01

Photon flux (15-150 keV)    in 15.23 sec: 1.81217 ( -0.05969  0.05989 ) ph/cm2/s
Energy fluence (15-150 keV)             : 2.1025e-06 ( -6.65399e-08  6.60677e-08 ) ergs/cm2
Band function

Time interval is from   -0.104 sec. to   15.128 sec.

Spectral model in the Band function:
------------------------------------------------------------
Parameters  : value       lower 90%   higher 90%
alpha       : 0.816872   ( -2.99086   -0.816643 )
beta        : -1.52682    ( -0.0667662   0.061935 )
Epeak [keV] : 31.3358      ( -10.5394 89.9827 )
Norm@50keV   : 0.706873    ( -0.705745   695.948 )
------------------------------------------------------------
#Fit statistic : Chi-Squared =          39.53 using 59 PHA bins.
# Reduced chi-squared =         0.7188 for     55 degrees of freedom
# Null hypothesis probability =   9.425148e-01

Photon flux (15-150 keV)    in 15.23 sec:  (    ) ph/cm2/s
Energy fluence (15-150 keV)             : 0 ( 0  0 ) ergs/cm2
Single BB
Spectral model blackbody:
------------------------------------------------------------
Parameters  : value    Lower 90%  Upper 90%
kT [keV]    : 16.6853  (  )
R^2/D10^2   : 0.136316  (   )
(R is the radius in km and D10 is the distance to the source in units of 10 kpc)
------------------------------------------------------------
#Fit statistic : Chi-Squared =         352.22 using 59 PHA bins.
# Reduced chi-squared =         6.1793 for     57 degrees of freedom
# Null hypothesis probability =   3.887134e-44

Energy  Fluence     90% Error
[keV]   [erg/cm2]   [erg/cm2]
15- 25  1.183e-07   6.557e-09
25- 50  5.156e-07   2.048e-08
50-150  1.019e-06   5.315e-08
15-150  1.652e-06   4.950e-08
Thermal bremsstrahlung (OTTB)

Spectral model: thermal bremsstrahlung
------------------------------------------------------------
Parameters  : value         Lower 90%    Upper 90%
kT [keV]    : 200.000       (      )
Norm        : 7.47671       (-0.198893     0.198889)
------------------------------------------------------------
#Fit statistic : Chi-Squared =          53.00 using 59 PHA bins.
# Reduced chi-squared =         0.9298 for     57 degrees of freedom
# Null hypothesis probability =   6.258990e-01

Energy  Fluence     90% Error
[keV]   [erg/cm2]   [erg/cm2]
15- 25  2.836e-07   8.148e-09
25- 50  5.455e-07   1.660e-08
50-150  1.196e-06   3.404e-08
15-150  2.025e-06   6.168e-08
Double BB
Spectral model: bbodyrad<1> + bbodyrad<2>
------------------------------------------------------------
Parameters  : value         Lower 90%    Upper 90%
kT1 [keV]   : 7.59147        (-0.716027      0.768651)
R1^2/D10^2  : 1.42472        (-0.395358      0.592369)
kT2 [keV]   : 29.8896        (-2.93637      3.90723)
R2^2/D10^2  : 1.47999E-02    (-0.00506159   0.00653729)
------------------------------------------------------------
#Fit statistic : Chi-Squared =          44.35 using 59 PHA bins.
# Reduced chi-squared =         0.8064 for     55 degrees of freedom
# Null hypothesis probability =   8.472314e-01

Energy  Fluence     90% Error
[keV]   [erg/cm2]   [erg/cm2]
15- 25  2.484e-07   2.277e-08
25- 50  5.403e-07   3.313e-08
50-150  1.305e-06   1.015e-07
15-150  2.094e-06   1.424e-07
Peak spectrum fit
Power-law model

Time interval is from    0.212 sec. to    1.212 sec.

Spectral model in power-law:
------------------------------------------------------------
Parameters  : value       lower 90%   higher 90%
Photon index: 1.21172     ( -0.0576053   0.0575026 )
Norm@50keV  : 7.28843E-02    ( -0.00229097   0.00229072 )
------------------------------------------------------------
#Fit statistic : Chi-Squared =          36.35 using 59 PHA bins.
# Reduced chi-squared =         0.6378 for     57 degrees of freedom
# Null hypothesis probability =   9.849736e-01

Photon flux (15-150 keV)    in 1 sec: 8.56947 ( -0.281636  0.28206 ) ph/cm2/s
Energy fluence (15-150 keV)             : 7.37017e-07 ( -2.54847e-08  2.5541e-08 ) ergs/cm2
Cutoff power-law model

Time interval is from    0.212 sec. to    1.212 sec.
Spectral model in the cutoff power-law:
------------------------------------------------------------
Parameters  : value       lower 90%   higher 90%
Photon index: 1.05974     ( -0.225823   0.175417 )
Epeak [keV] : 349.092      ( -349.093 -349.093 )
Norm@50keV  : 8.53765E-02    ( -0.0142039   0.0218699 )
------------------------------------------------------------
#Fit statistic : Chi-Squared =          34.91 using 59 PHA bins.
# Reduced chi-squared =         0.6234 for     56 degrees of freedom
# Null hypothesis probability =   9.878706e-01

Photon flux (15-150 keV)    in 1 sec: 8.49880 ( -0.14923  0.29784 ) ph/cm2/s
Energy fluence (15-150 keV)             : 7.31221e-07 ( -2.7162e-08  2.7037e-08 ) ergs/cm2
Band function

Time interval is from    0.212 sec. to    1.212 sec.

Spectral model in the Band function:
------------------------------------------------------------
Parameters  : value       lower 90%   higher 90%
alpha       : 1.42890   ( -3.68832   -1.43146 )
beta        : -1.24730    ( -0.0745432   0.0684821 )
Epeak [keV] : 33.2803      ( -9.88627 81.4241 )
Norm@50keV   : 6.18127    ( -6.29353   1716.18 )
------------------------------------------------------------
#Fit statistic : Chi-Squared =          33.12 using 59 PHA bins.
# Reduced chi-squared =         0.6022 for     55 degrees of freedom
# Null hypothesis probability =   9.915034e-01

Photon flux (15-150 keV)    in 1 sec:  (    ) ph/cm2/s
Energy fluence (15-150 keV)             : 0 ( 0  0 ) ergs/cm2
Single BB
Spectral model blackbody:
------------------------------------------------------------
Parameters  : value    Lower 90%  Upper 90%
kT [keV]    : 19.4758  (  )
R^2/D10^2   : 0.423768  (   )
(R is the radius in km and D10 is the distance to the source in units of 10 kpc)
------------------------------------------------------------
#Fit statistic : Chi-Squared =         231.71 using 59 PHA bins.
# Reduced chi-squared =         4.0651 for     57 degrees of freedom
# Null hypothesis probability =   6.303200e-23

Energy  Fluence     90% Error
[keV]   [erg/cm2]   [erg/cm2]
15- 25  3.131e-08   2.025e-09
25- 50  1.532e-07   6.750e-09
50-150  4.290e-07   2.400e-08
15-150  6.135e-07   2.445e-08
Thermal bremsstrahlung (OTTB)

Spectral model: thermal bremsstrahlung
------------------------------------------------------------
Parameters  : value         Lower 90%    Upper 90%
kT [keV]    : 199.363       (      )
Norm        : 35.7543       (     )
------------------------------------------------------------
#Fit statistic : Chi-Squared =         137.86 using 59 PHA bins.
# Reduced chi-squared =         2.4186 for     57 degrees of freedom
# Null hypothesis probability =   1.192729e-08

Energy  Fluence     90% Error
[keV]   [erg/cm2]   [erg/cm2]
15- 25  8.903e-08   3.035e-09
25- 50  1.713e-07   5.700e-09
50-150  3.756e-07   1.245e-08
15-150  6.359e-07   2.085e-08
Double BB

Spectral model: bbodyrad<1> + bbodyrad<2>
------------------------------------------------------------
Parameters  : value         Lower 90%    Upper 90%
kT1 [keV]   : 8.26678        (-1.00607      1.10769)
R1^2/D10^2  : 4.22424        (-1.34317      2.18931)
kT2 [keV]   : 33.7653        (-3.92046      5.65836)
R2^2/D10^2  : 5.91770E-02    (-0.0230289   0.0300912)
------------------------------------------------------------
#Fit statistic : Chi-Squared =          34.31 using 59 PHA bins.
# Reduced chi-squared =         0.6238 for     55 degrees of freedom
# Null hypothesis probability =   9.870754e-01

Energy  Fluence     90% Error
[keV]   [erg/cm2]   [erg/cm2]
15- 25  6.322e-08   7.660e-09
25- 50  1.621e-07   1.335e-08
50-150  5.102e-07   5.365e-08
15-150  7.355e-07   6.135e-08
Pre-slew spectrum (Pre-slew PHA with pre-slew DRM)
Power-law model

Spectral model in power-law:
------------------------------------------------------------
Parameters  : value       lower 90%   higher 90%
Photon index: 1.49650     ( -0.0515707   0.0515692 )
Norm@50keV  : 1.46307E-02    ( -0.000388904   0.000388882 )
------------------------------------------------------------
#Fit statistic : Chi-Squared =          42.59 using 59 PHA bins.
# Reduced chi-squared =         0.7472 for     57 degrees of freedom
# Null hypothesis probability =   9.221532e-01

Photon flux (15-150 keV)    in 15.23 sec: 1.82477 ( -0.0537842  0.053956 ) ph/cm2/s
Energy fluence (15-150 keV)             : 2.11504e-06 ( -5.95565e-08  5.96544e-08 ) ergs/cm2
Cutoff power-law model

Spectral model in the cutoff power-law:
------------------------------------------------------------
Parameters  : value       lower 90%   higher 90%
Photon index: 1.40801     ( -0.199875   0.118152 )
Epeak [keV] : 365.143      ( -365.144 -365.144 )
Norm@50keV  : 1.60693E-02    ( -0.00173504   0.00367108 )
------------------------------------------------------------
#Fit statistic : Chi-Squared =          41.98 using 59 PHA bins.
# Reduced chi-squared =         0.7496 for     56 degrees of freedom
# Null hypothesis probability =   9.178128e-01

Photon flux (15-150 keV)    in 15.23 sec: 1.81217 ( -0.05969  0.05989 ) ph/cm2/s
Energy fluence (15-150 keV)             : 2.1025e-06 ( -6.65399e-08  6.60677e-08 ) ergs/cm2
Band function

Spectral model in the Band function:
------------------------------------------------------------
Parameters  : value       lower 90%   higher 90%
alpha       : 0.816872   ( -4.35294   -0.816643 )
beta        : -1.52682    ( -0.0667662   0.061935 )
Epeak [keV] : 31.3358      ( -15.2803 83.6759 )
Norm@50keV   : 0.706873    ( -0.705745   777.512 )
------------------------------------------------------------
#Fit statistic : Chi-Squared =          39.53 using 59 PHA bins.
# Reduced chi-squared =         0.7188 for     55 degrees of freedom
# Null hypothesis probability =   9.425148e-01

Photon flux (15-150 keV)    in 15.23 sec:  (    ) ph/cm2/s
Energy fluence (15-150 keV)             : 0 ( 0  0 ) ergs/cm2
S(25-50 keV) vs. S(50-100 keV) plot
S(25-50 keV)  = 5.22e-07
S(50-100 keV) = 7.40e-07
T90 vs. Hardness ratio plot
T90                                   = 8.71999999880791 sec.
Hardness ratio (energy fluence ratio) = 1.41762
Color vs. Color plot

Count Ratio  (25-50 keV) / (15-25 keV) = 1.37337
Count Ratio (50-100 keV) / (15-25 keV) = 1.03025
Mask shadow pattern

IMX = 2.738953237306905E-01, IMY = -2.505954614291482E-01
TIME vs. PHA plot around the trigger time

Blue+Cyan dotted lines: Time interval of the scaled map
From 0.000000 to 1.024000
TIME vs. DetID plot around the trigger time

Blue+Cyan dotted lines: Time interval of the scaled map
From 0.000000 to 1.024000
100 us light curve (15-350 keV)

Blue+Cyan dotted lines: Time interval of the scaled map
From 0.000000 to 1.024000
Spacecraft aspect plot

Bright source in the pre-burst/pre-slew/post-slew images
Pre-burst image of 15-350 keV band
Time interval of the image:
-239.912000 -0.104000

# RAcent  DECcent POSerr Theta    Phi  PeakCts   SNR AngSep     Name
#  [deg]    [deg]    ['] [deg]  [deg]                   [']
244.9760 -15.6495    0.5  32.7 -110.9   7.6998  24.6    0.6	Sco X-1
254.6551  35.4912   62.0  51.2  -33.2   0.1159   0.2   13.2	Her X-1
256.0072 -37.8428    1.0  33.7 -155.9   2.4033  11.1    1.0	4U 1700-377
256.4486 -36.4410    2.8  32.4 -154.7   0.8425   4.1    1.3	GX 349+2
263.0045 -24.8036    2.6  20.2 -144.9   0.7889   4.4    3.5	GX 1+4
264.5595 -44.4722    3.4  35.8 -171.7   0.7496   3.4    8.0	4U 1735-44
268.3345  -1.4545    2.5  13.5  -56.0   0.8389   4.5    2.0	SW J1753.5-0127
270.2779 -25.1075    1.4  16.3 -162.0   1.4415   8.3    1.7	GX 5-1
270.3442 -25.9034   12.0  17.0 -163.5   0.1674   1.0    9.9	GRS 1758-258
274.0819 -14.2005    5.5   5.4 -140.2   0.3414   2.1   10.8	GX 17+2
276.0124 -30.3744    4.8  19.8  177.2   0.4017   2.4    4.5	H1820-303
285.2154 -24.7998    5.4  15.6  147.3   0.3522   2.1   12.2	HT1900.1-2455
288.8514  10.7853    6.7  23.9   18.1   0.3087   1.7   10.1	GRS 1915+105
299.5869  35.2120    0.7  50.1   14.3   8.5372  16.3    0.6	Cyg X-1
263.1465 -33.8722    4.7  27.0 -160.1   0.4636   2.4    8.2	GX 354-0
288.0696 -37.4631    3.3  28.2  154.9   0.7923   3.5 ------	UNKNOWN
277.3096 -23.6895    1.8  13.1  175.2   1.0868   6.3 ------	UNKNOWN
243.7931 -48.6519    2.9  47.6 -158.1   1.4540   4.1 ------	UNKNOWN
237.1303 -39.1962    2.3  46.3 -143.7   2.0476   4.9 ------	UNKNOWN
Pre-slew background subtracted image of 15-350 keV band
Time interval of the image:
-0.104000 15.128000

# RAcent  DECcent POSerr Theta    Phi  PeakCts   SNR AngSep     Name
#  [deg]    [deg]    ['] [deg]  [deg]                   [']
245.1036 -15.7757   12.9  32.6 -111.2  -0.0759  -0.9   10.8	Sco X-1
254.2952  35.2940    4.2  51.2  -33.6   0.4673   2.7    8.5	Her X-1
255.9607 -37.8100  177.8  33.7 -155.8  -0.0039  -0.1    2.4	4U 1700-377
256.2821 -36.3748    3.6  32.5 -154.4   0.1871   3.2    7.9	GX 349+2
263.1785 -24.7104    7.4  20.0 -145.0  -0.0809  -1.6    9.5	GX 1+4
264.6144 -44.3051    6.0  35.6 -171.7   0.1275   1.9   10.3	4U 1735-44
268.1985  -1.5532    7.9  13.5  -56.8   0.0698   1.5   11.8	SW J1753.5-0127
270.2132 -25.0614    6.1  16.3 -161.7  -0.0975  -1.9    4.0	GX 5-1
270.2594 -25.8877    4.1  17.0 -163.2   0.1458   2.8    9.0	GRS 1758-258
273.8926 -14.1697   25.1   5.5 -138.7   0.0214   0.5   10.4	GX 17+2
275.7922 -30.1965    0.0  19.7  177.8   0.0625   1.2   12.3	H1820-303
284.9902 -25.0654    5.2  15.8  148.4   0.1030   2.2    9.0	HT1900.1-2455
288.6725  11.0736    4.6  24.1   17.4   0.1413   2.5   10.7	GRS 1915+105
299.6170  35.2145    4.2  50.1   14.4   0.4775   2.8    1.5	Cyg X-1
263.1401 -33.8969   12.4  27.0 -160.1  -0.0522  -0.9    8.4	GX 354-0
293.9204   2.4244    0.2  20.4   42.5   3.4421  61.9 ------	UNKNOWN
239.3152   2.3216    2.6  40.8  -82.2   0.8418   4.5 ------	UNKNOWN
236.7680  -7.7678    2.9  41.0  -98.1   0.8166   4.0 ------	UNKNOWN
245.6721  27.6740    2.3  49.6  -47.2   1.0503   4.9 ------	UNKNOWN
Post-slew image of 15-350 keV band
Time interval of the image:
539.488580 962.187100

# RAcent  DECcent POSerr Theta    Phi  PeakCts   SNR AngSep     Name
#  [deg]    [deg]    ['] [deg]  [deg]                   [']
244.9811 -15.6470    0.6  41.0  -48.9  11.5038  19.7    0.4	Sco X-1
255.9859 -37.8232    0.6  22.2  -79.4   6.3206  20.4    1.3	4U 1700-377
256.5430 -36.5581    5.8  22.0  -75.9   0.6365   2.0    9.6	GX 349+2
262.9885 -24.7697    1.8  22.3  -40.8   1.6471   6.5    1.8	GX 1+4
264.5288 -44.4320    3.0  16.1 -100.9   0.9212   3.8    9.2	4U 1735-44
268.4046  -1.4178    2.7  39.3   -6.3   1.5670   4.3    3.0	SW J1753.5-0127
270.2812 -25.0868    1.5  17.4  -27.5   1.9183   7.6    0.5	GX 5-1
270.3951 -25.7267    3.8  16.9  -28.6   0.7848   3.2    5.1	GRS 1758-258
274.1028 -14.0275    3.2  25.5   -4.1   1.2650   3.6    5.7	GX 17+2
275.9611 -30.3305    2.5  10.2  -25.2   1.0886   4.6    2.9	H1820-303
285.0946 -25.0602    5.4  12.9   22.9   0.4794   2.1    9.0	HT1900.1-2455
288.8915  10.9651    4.1  49.1   25.3  -3.1178  -2.8    5.6	GRS 1915+105
262.8147 -33.7896    7.6  17.8  -63.9   0.3745   1.5    9.1	GX 354-0
332.2853 -55.7355    3.9  36.4  154.3   1.3300   3.0 ------	UNKNOWN
277.3305 -23.7920    1.7  15.3   -5.3   1.6422   6.8 ------	UNKNOWN
262.0704  13.6976    2.2  55.6   -7.1   4.4658   5.3 ------	UNKNOWN
251.9816   9.6302    3.0  56.3  -20.0   3.6817   3.9 ------	UNKNOWN
205.2942 -70.2636    2.7  51.0 -135.6   6.1264   4.3 ------	UNKNOWN
Plot creation:
Sun May 31 09:17:59 EDT 2015