Click here for the BAT GCN circular template
Image
Pre-slew 15.0-350.0 keV image (Event data)
#   RAcent    DECcent   POSerr    Theta     Phi              Peak Cts       SNR   Name
  100.9720    72.2422   0.0161    14.3977  -153.4907         0.8539508     11.870 TRIG_00291614

Foreground time interval of the image:
 15.180  74.816 (delta_t =  59.636 [sec])
Background time interval of the image:
-239.000  15.180 (delta_t = 254.180 [sec])
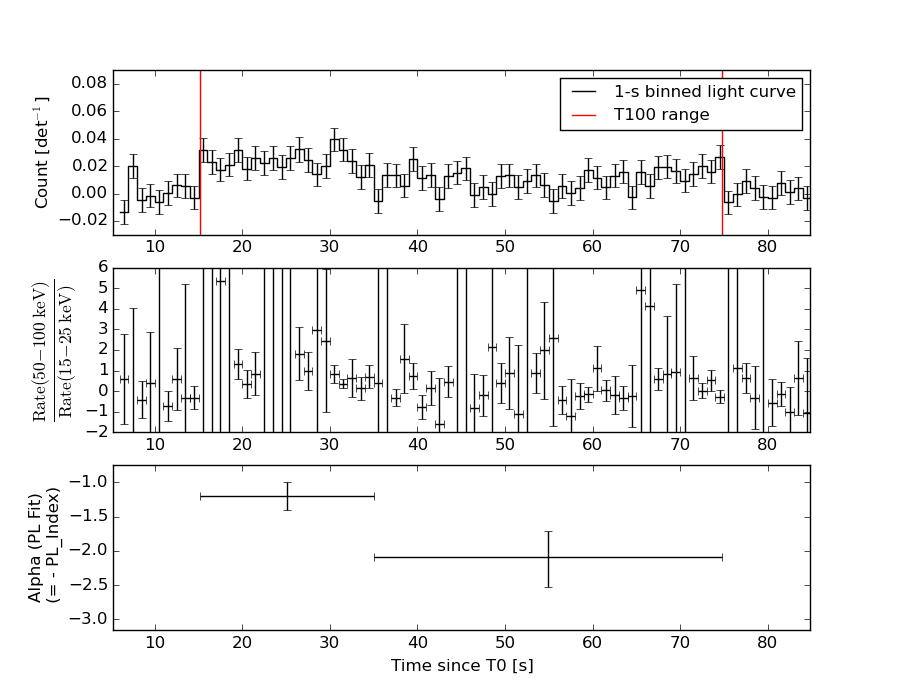
Lightcurves
Notes:
- 1) The mask-weighted light curves are using the flight position.
- 2) Multiple plots of different time binning/intervals are shown to cover all scenarios of short/long GRBs, rate/image triggers, and real/false positives.
- 3) For all the mask-weighted lightcurves, the y-axis units are counts/sec/det where a det is 0.4 x 0.4 = 0.16 sq cm.
- 4) The verticle lines correspond to following: green dotted lines are T50 interval, black dotted lines are T90 interval, blue solid line(s) is a spacecraft slew start time, and orange solid line(s) is a spacecraft slew end time.
- 5) Time of each bin is in the middle of the bin.
1 s binning
From T0-310 s to T0+310 s
From T100_start - 20 s to T100_end + 30 s
Full time interval
64 ms binning
Full time interval
From T100_start to T100_end
From T0-5 sec to T0+5 sec
16 ms binning
From T100_start-5 s to T100_start+5 s
Blue+Cyan dotted lines: Time interval of the scaled map
From 0.000000 to 64.000000
8 ms binning
From T100_start-3 s to T100_start+3 s
Blue+Cyan dotted lines: Time interval of the scaled map
From 0.000000 to 64.000000
2 ms binning
From T100_start-1 s to T100_start+1 s
Blue+Cyan dotted lines: Time interval of the scaled map
From 0.000000 to 64.000000
SN=5 or 10 sec. binning (whichever binning is satisfied first)
SN=5 or 10 sec. binning (T < 200 sec)
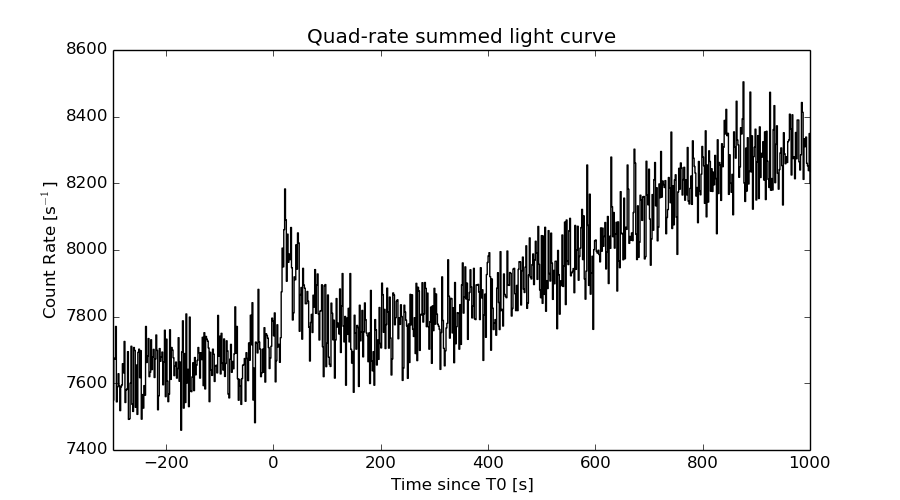
Quad-rate summed light curves (from T0-300s to T0+1000s)
Spectral Evolution
Spectra
Notes:
- 1) The fitting includes the systematic errors.
- 2) When the burst includes telescope slew time periods, the fitting uses an average response file made from multiple 5-s response files through out the slew time plus single time preiod for the non-slew times, and weighted by the total counts in the corresponding time period using addrmf. An average response file is needed becuase a spectral fit using the pre-slew DRM will introduce some errors in both a spectral shape and a normalization if the PHA file contains a lot of the slew/post-slew time interval.
- 3) For fits to more complicated models (e.g. a power-law over a cutoff power-law), the BAT team has decided to require a chi-square improvement of more than 6 for each extra dof.
Time averaged spectrum fit using the average DRM
Power-law model
Time interval is from   15.180 sec. to   74.816 sec.

Spectral model in power-law:
------------------------------------------------------------
Parameters  : value       lower 90%   higher 90%
Photon index: 1.60367     ( -0.207089   0.21286 )
Norm@50keV  : 9.23291E-04    ( -0.000121303   0.000119317 )
------------------------------------------------------------
#Fit statistic : Chi-Squared =          34.06 using 59 PHA bins.
# Reduced chi-squared =         0.5975 for     57 degrees of freedom
# Null hypothesis probability =   9.931980e-01

Photon flux (15-150 keV)    in 59.64 sec: 0.118782 ( -0.0140915  0.0140954 ) ph/cm2/s
Energy fluence (15-150 keV)             : 5.14747e-07 ( -7.25336e-08  7.39965e-08 ) ergs/cm2
Cutoff power-law model

Time interval is from   15.180 sec. to   74.816 sec.
Spectral model in the cutoff power-law:
------------------------------------------------------------
Parameters  : value       lower 90%   higher 90%
Photon index: 1.15647     ( -0.957304   0.429555 )
Epeak [keV] : 85.9279      ( -40.7285 -85.9279 )
Norm@50keV  : 1.62044E-03    ( -0.000793687   0.00376114 )
------------------------------------------------------------
#Fit statistic : Chi-Squared =          33.12 using 59 PHA bins.
# Reduced chi-squared =         0.5914 for     56 degrees of freedom
# Null hypothesis probability =   9.936149e-01

Photon flux (15-150 keV)    in 59.64 sec: 0.116681 ( -0.014588  0.014556 ) ph/cm2/s
Energy fluence (15-150 keV)             : 4.91861e-07 ( -8.27821e-08  8.39516e-08 ) ergs/cm2
Band function

Time interval is from   15.180 sec. to   74.816 sec.

Spectral model in the Band function:
------------------------------------------------------------
Parameters  : value       lower 90%   higher 90%
alpha       : -1.15627   ( -0.462147   0.910331 )
beta        : -10.0000    ( 10   7.10543e-15 )
Epeak [keV] : 85.9010      ( -34.0576 -85.901 )
Norm@50keV   : 1.62062E-03    ( -0.000794049   0.00376238 )
------------------------------------------------------------
#Fit statistic : Chi-Squared =          33.12 using 59 PHA bins.
# Reduced chi-squared =         0.6022 for     55 degrees of freedom
# Null hypothesis probability =   9.914959e-01

Photon flux (15-150 keV)    in 59.64 sec: 0.116658 ( 6.88334  -0.014467 ) ph/cm2/s
Energy fluence (15-150 keV)             : 4.95291e-07 ( 0  0 ) ergs/cm2
Single BB
Spectral model blackbody:
------------------------------------------------------------
Parameters  : value    Lower 90%  Upper 90%
kT [keV]    : 12.3666  (-1.74286  2.1422)
R^2/D10^2   : 2.62555E-02  (-0.0114735   0.0192339)
(R is the radius in km and D10 is the distance to the source in units of 10 kpc)
------------------------------------------------------------
#Fit statistic : Chi-Squared =          46.68 using 59 PHA bins.
# Reduced chi-squared =         0.8190 for     57 degrees of freedom
# Null hypothesis probability =   8.334698e-01

Energy  Fluence     90% Error
[keV]   [erg/cm2]   [erg/cm2]
15- 25  5.075e-08   1.218e-08
25- 50  1.654e-07   2.708e-08
50-150  1.551e-07   4.333e-08
15-150  3.712e-07   6.203e-08
Thermal bremsstrahlung (OTTB)
Spectral model: thermal bremsstrahlung
------------------------------------------------------------
Parameters  : value         Lower 90%    Upper 90%
kT [keV]    : 167.065       (-75.0781      -165.822)
Norm        : 0.488169       (-0.0600146     0.0764902)
------------------------------------------------------------
#Fit statistic : Chi-Squared =          33.17 using 59 PHA bins.
# Reduced chi-squared =         0.5820 for     57 degrees of freedom
# Null hypothesis probability =   9.951485e-01

Energy  Fluence     90% Error
[keV]   [erg/cm2]   [erg/cm2]
15- 25  7.403e-08   4.038e-08
25- 50  1.393e-07   7.500e-08
50-150  2.869e-07   1.611e-07
15-150  5.002e-07   2.737e-07
Double BB
Spectral model: bbodyrad<1> + bbodyrad<2>
------------------------------------------------------------
Parameters  : value         Lower 90%    Upper 90%
kT1 [keV]   : 7.58153        (-2.86985      2.6493)
R1^2/D10^2  : 0.105294        (-0.0617487      0.366039)
kT2 [keV]   : 27.4727        (-10.8403      46.0512)
R2^2/D10^2  : 1.06151E-03    (-0.000959478   0.00385154)
------------------------------------------------------------
#Fit statistic : Chi-Squared =          32.93 using 59 PHA bins.
# Reduced chi-squared =         0.5987 for     55 degrees of freedom
# Null hypothesis probability =   9.920854e-01

Energy  Fluence     90% Error
[keV]   [erg/cm2]   [erg/cm2]
15- 25  7.041e-08   4.047e-08
25- 50  1.463e-07   7.774e-08
50-150  2.786e-07   1.543e-07
15-150  4.952e-07   2.554e-07
Peak spectrum fit
Power-law model
Time interval is from   30.452 sec. to   31.452 sec.

Spectral model in power-law:
------------------------------------------------------------
Parameters  : value       lower 90%   higher 90%
Photon index: 1.76938     ( -0.511168   0.587009 )
Norm@50keV  : 2.52230E-03    ( -0.000957075   0.000914477 )
------------------------------------------------------------
#Fit statistic : Chi-Squared =          55.01 using 59 PHA bins.
# Reduced chi-squared =         0.9651 for     57 degrees of freedom
# Null hypothesis probability =   5.501029e-01

Photon flux (15-150 keV)    in 1 sec: 0.343527 ( -0.106788  0.106789 ) ph/cm2/s
Energy fluence (15-150 keV)             : 2.32522e-08 ( -8.58463e-09  9.1564e-09 ) ergs/cm2
Cutoff power-law model
Time interval is from   30.452 sec. to   31.452 sec.
Spectral model in the cutoff power-law:
------------------------------------------------------------
Parameters  : value       lower 90%   higher 90%
Photon index: 0.523380     ( -3.1916   1.6432 )
Epeak [keV] : 51.9916      ( -52.0232 -52.0232 )
Norm@50keV  : 1.25973E-02    ( -0.0125598   1.0048 )
------------------------------------------------------------
#Fit statistic : Chi-Squared =          53.86 using 59 PHA bins.
# Reduced chi-squared =         0.9618 for     56 degrees of freedom
# Null hypothesis probability =   5.561865e-01

Photon flux (15-150 keV)    in 1 sec: 0.333215 ( -0.106204  0.107331 ) ph/cm2/s
Energy fluence (15-150 keV)             : 2.11998e-08 ( -8.1804e-09  9.5939e-09 ) ergs/cm2
Band function

Time interval is from   30.452 sec. to   31.452 sec.

Spectral model in the Band function:
------------------------------------------------------------
Parameters  : value       lower 90%   higher 90%
alpha       : -0.736020   ( -6.19001   -4.19001 )
beta        : -9.37167    ( -1.83153   0.793699 )
Epeak [keV] : 55.1065      ( -37.7276 -55.0881 )
Norm@50keV   : 9.40797E-03    ( -0.0094158   585971 )
------------------------------------------------------------
#Fit statistic : Chi-Squared =          53.89 using 59 PHA bins.
# Reduced chi-squared =         0.9799 for     55 degrees of freedom
# Null hypothesis probability =   5.169096e-01

Photon flux (15-150 keV)    in 1 sec:  (    ) ph/cm2/s
Energy fluence (15-150 keV)             : 0 ( 0  0 ) ergs/cm2
Single BB
Spectral model blackbody:
------------------------------------------------------------
Parameters  : value    Lower 90%  Upper 90%
kT [keV]    : 11.7287  (-3.96599  5.71358)
R^2/D10^2   : 9.44291E-02  (-0.0939732   0.326311)
(R is the radius in km and D10 is the distance to the source in units of 10 kpc)
------------------------------------------------------------
#Fit statistic : Chi-Squared =          55.34 using 59 PHA bins.
# Reduced chi-squared =         0.9708 for     57 degrees of freedom
# Null hypothesis probability =   5.376935e-01

Energy  Fluence     90% Error
[keV]   [erg/cm2]   [erg/cm2]
15- 25  2.741e-09   1.734e-09
25- 50  8.396e-09   5.150e-09
50-150  6.837e-09   5.040e-09
15-150  1.797e-08   1.105e-08
Thermal bremsstrahlung (OTTB)
Spectral model: thermal bremsstrahlung
------------------------------------------------------------
Parameters  : value         Lower 90%    Upper 90%
kT [keV]    : 95.3911       (-58.2827      -95.3736)
Norm        : 1.56172       (-0.535585     0.852869)
------------------------------------------------------------
#Fit statistic : Chi-Squared =          54.23 using 59 PHA bins.
# Reduced chi-squared =         0.9515 for     57 degrees of freedom
# Null hypothesis probability =   5.795325e-01

Energy  Fluence     90% Error
[keV]   [erg/cm2]   [erg/cm2]
15- 25  4.080e-09   2.475e-09
25- 50  6.987e-09   4.345e-09
50-150  1.102e-08   8.740e-09
15-150  2.209e-08   1.543e-08
Double BB
Spectral model: bbodyrad<1> + bbodyrad<2>
------------------------------------------------------------
Parameters  : value         Lower 90%    Upper 90%
kT1 [keV]   : 5.77575        (-5.76867      -5.76867)
R1^2/D10^2  : 0.689169        (-0.691606      -0.691606)
kT2 [keV]   : 17.6952        (-17.673      -17.673)
R2^2/D10^2  : 1.58939E-02    (-0.0160188   0.19421)
------------------------------------------------------------
#Fit statistic : Chi-Squared =          53.45 using 59 PHA bins.
# Reduced chi-squared =         0.9718 for     55 degrees of freedom
# Null hypothesis probability =   5.339954e-01

Energy  Fluence     90% Error
[keV]   [erg/cm2]   [erg/cm2]
15- 25  3.888e-09   2.418e-09
25- 50  7.220e-09   4.121e-09
50-150  1.055e-08   6.445e-09
15-150  2.166e-08   1.177e-08
Pre-slew spectrum (Pre-slew PHA with pre-slew DRM)
Power-law model

Spectral model in power-law:
------------------------------------------------------------
Parameters  : value       lower 90%   higher 90%
Photon index: 1.60367     ( -0.207089   0.21286 )
Norm@50keV  : 9.23291E-04    ( -0.000121303   0.000119317 )
------------------------------------------------------------
#Fit statistic : Chi-Squared =          34.06 using 59 PHA bins.
# Reduced chi-squared =         0.5975 for     57 degrees of freedom
# Null hypothesis probability =   9.931980e-01

Photon flux (15-150 keV)    in 59.64 sec: 0.118782 ( -0.0140915  0.0140954 ) ph/cm2/s
Energy fluence (15-150 keV)             : 5.14747e-07 ( -7.25336e-08  7.39965e-08 ) ergs/cm2
Cutoff power-law model
Spectral model in the cutoff power-law:
------------------------------------------------------------
Parameters  : value       lower 90%   higher 90%
Photon index: 1.15647     ( -0.957304   0.429555 )
Epeak [keV] : 85.9279      ( -40.7285 -85.9279 )
Norm@50keV  : 1.62044E-03    ( -0.000793687   0.00376114 )
------------------------------------------------------------
#Fit statistic : Chi-Squared =          33.12 using 59 PHA bins.
# Reduced chi-squared =         0.5914 for     56 degrees of freedom
# Null hypothesis probability =   9.936149e-01

Photon flux (15-150 keV)    in 59.64 sec: 0.116681 ( -0.014588  0.014556 ) ph/cm2/s
Energy fluence (15-150 keV)             : 4.91861e-07 ( -8.27821e-08  8.39516e-08 ) ergs/cm2
Band function

Spectral model in the Band function:
------------------------------------------------------------
Parameters  : value       lower 90%   higher 90%
alpha       : -1.15627   ( -0.462147   0.910331 )
beta        : -10.0000    ( 10   20 )
Epeak [keV] : 85.9010      ( -34.0576 -85.901 )
Norm@50keV   : 1.62062E-03    ( -0.000794049   0.00376238 )
------------------------------------------------------------
#Fit statistic : Chi-Squared =          33.12 using 59 PHA bins.
# Reduced chi-squared =         0.6022 for     55 degrees of freedom
# Null hypothesis probability =   9.914959e-01

Photon flux (15-150 keV)    in 59.64 sec: 0.116658 ( 6.88334  -0.014467 ) ph/cm2/s
Energy fluence (15-150 keV)             : 4.95291e-07 ( 0  0 ) ergs/cm2
S(25-50 keV) vs. S(50-100 keV) plot
S(25-50 keV)  = 1.34e-07
S(50-100 keV) = 1.76e-07
T90 vs. Hardness ratio plot
T90                                   = 55.7600000202656 sec.
Hardness ratio (energy fluence ratio) = 1.31343
Color vs. Color plot
Count Ratio  (25-50 keV) / (15-25 keV) = 1.24912
Count Ratio (50-100 keV) / (15-25 keV) = 0.719093
Mask shadow pattern
IMX = -2.297229043253134E-01, IMY = 1.145821390813567E-01
TIME vs. PHA plot around the trigger time
Blue+Cyan dotted lines: Time interval of the scaled map
From 0.000000 to 64.000000
TIME vs. DetID plot around the trigger time
Blue+Cyan dotted lines: Time interval of the scaled map
From 0.000000 to 64.000000
100 us light curve (15-350 keV)
Blue+Cyan dotted lines: Time interval of the scaled map
From 0.000000 to 64.000000
Spacecraft aspect plot
Bright source in the pre-burst/pre-slew/post-slew images
Pre-burst image of 15-350 keV band
Time interval of the image:
-239.000000 15.180000

# RAcent  DECcent POSerr Theta    Phi  PeakCts   SNR AngSep     Name
#  [deg]    [deg]    ['] [deg]  [deg]                   [']
 83.6293  22.0143    0.3  37.1   12.1  10.7189  43.3    0.2	Crab
Pre-slew background subtracted image of 15-350 keV band
Time interval of the image:
15.180000 74.816000

# RAcent  DECcent POSerr Theta    Phi  PeakCts   SNR AngSep     Name
#  [deg]    [deg]    ['] [deg]  [deg]                   [']
 83.5906  21.8758    4.5  37.3   12.2  -0.3021  -2.6    8.7	Crab
 42.8649  32.4538    1.8  39.1   74.7   1.8702   6.4 ------	UNKNOWN
345.6086  73.4808    2.4  37.3  160.7   0.5617   4.9 ------	UNKNOWN
333.5373  79.1592    2.1  36.3  171.2   0.5315   5.5 ------	UNKNOWN
100.9719  72.2423    1.0  14.4 -153.5   0.8550  11.9 ------	UNKNOWN
129.9640  38.1034    2.2  34.8  -64.4   0.6259   5.1 ------	UNKNOWN
Post-slew image of 15-350 keV band
Time interval of the image:
384.400590 963.078800

# RAcent  DECcent POSerr Theta    Phi  PeakCts   SNR AngSep     Name
#  [deg]    [deg]    ['] [deg]  [deg]                   [']
 83.6304  22.0097    0.3  36.7   38.3  23.5197  36.2    0.3	Crab
107.8166  69.1893    2.4  19.1  161.6   1.5624   4.8 ------	UNKNOWN
123.8451  -7.8927    3.6  58.9  -24.2   7.7268   3.2 ------	UNKNOWN
137.9677   3.9832    3.0  50.7  -44.5   7.8491   3.8 ------	UNKNOWN
136.7151   2.2464    4.2  51.9  -42.3   5.4485   2.8 ------	UNKNOWN
Plot creation:
Sun May 31 09:16:22 EDT 2015