Special notes of this burst
Image
Pre-slew 15.0-350.0 keV image (Event data)
# RAcent DECcent POSerr Theta Phi Peak Cts SNR Name
0.1180 -34.8456 0.0062 7.8147 155.7131 1.6092794 30.933 TRIG_00291728
Foreground time interval of the image:
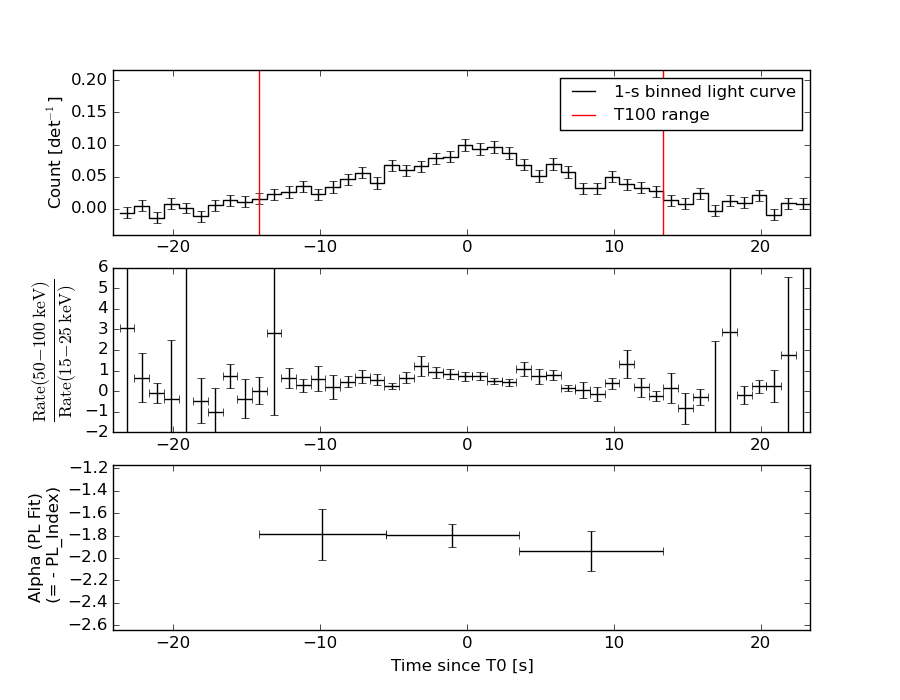
-14.120 13.352 (delta_t = 27.472 [sec])
Background time interval of the image:
-105.723 -14.120 (delta_t = 91.603 [sec])
Lightcurves
Notes:
- 1) The mask-weighted light curves are using the flight position.
- 2) Multiple plots of different time binning/intervals are shown to cover all scenarios of short/long GRBs, rate/image triggers, and real/false positives.
- 3) For all the mask-weighted lightcurves, the y-axis units are counts/sec/det where a det is 0.4 x 0.4 = 0.16 sq cm.
- 4) The verticle lines correspond to following: green dotted lines are T50 interval, black dotted lines are T90 interval, blue solid line(s) is a spacecraft slew start time, and orange solid line(s) is a spacecraft slew end time.
- 5) Time of each bin is in the middle of the bin.
1 s binning
From T0-310 s to T0+310 s
From T100_start - 20 s to T100_end + 30 s
Full time interval

64 ms binning
Full time interval
From T100_start to T100_end
From T0-5 sec to T0+5 sec
16 ms binning
From T100_start-5 s to T100_start+5 s

Blue+Cyan dotted lines: Time interval of the scaled map
From 0.000000 to 1.024000
8 ms binning
From T100_start-3 s to T100_start+3 s
Blue+Cyan dotted lines: Time interval of the scaled map
From 0.000000 to 1.024000
2 ms binning
From T100_start-1 s to T100_start+1 s
Blue+Cyan dotted lines: Time interval of the scaled map
From 0.000000 to 1.024000
SN=5 or 10 sec. binning (whichever binning is satisfied first)
SN=5 or 10 sec. binning (T < 200 sec)
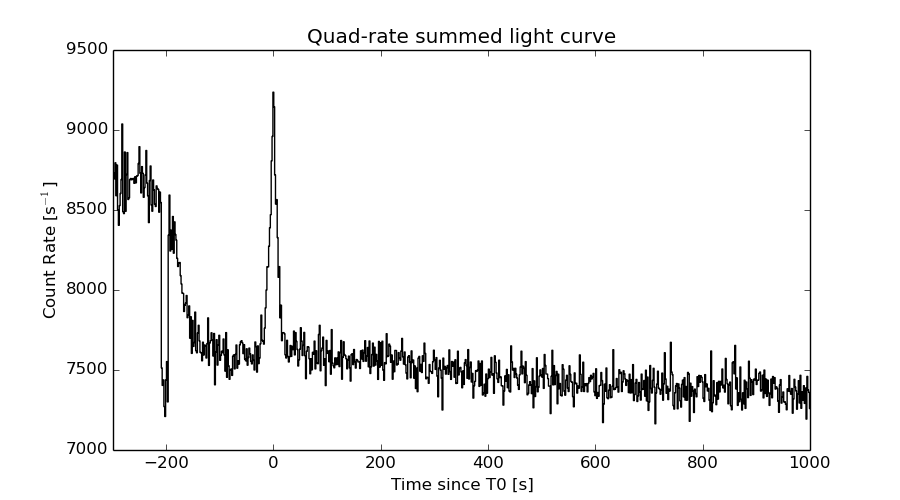
Quad-rate summed light curves (from T0-300s to T0+1000s)
Spectral Evolution
Spectra
Notes:
- 1) The fitting includes the systematic errors.
- 2) When the burst includes telescope slew time periods, the fitting uses an average response file made from multiple 5-s response files through out the slew time plus single time preiod for the non-slew times, and weighted by the total counts in the corresponding time period using addrmf. An average response file is needed becuase a spectral fit using the pre-slew DRM will introduce some errors in both a spectral shape and a normalization if the PHA file contains a lot of the slew/post-slew time interval.
- 3) For fits to more complicated models (e.g. a power-law over a cutoff power-law), the BAT team has decided to require a chi-square improvement of more than 6 for each extra dof.
Time averaged spectrum fit using the average DRM
Power-law model
Time interval is from  -14.120 sec. to   13.352 sec.

Spectral model in power-law:
------------------------------------------------------------
Parameters  : value       lower 90%   higher 90%
Photon index: 1.87483     ( -0.0922454   0.093857 )
Norm@50keV  : 3.21014E-03    ( -0.000191917   0.000190491 )
------------------------------------------------------------
#Fit statistic : Chi-Squared =          79.01 using 59 PHA bins.
# Reduced chi-squared =          1.386 for     57 degrees of freedom
# Null hypothesis probability =   2.844897e-02

Photon flux (15-150 keV)    in 27.47 sec: 0.455846 ( -0.0236672  0.0236819 ) ph/cm2/s
Energy fluence (15-150 keV)             : 8.10656e-07 ( -4.81362e-08  4.85999e-08 ) ergs/cm2
Cutoff power-law model
Time interval is from  -14.120 sec. to   13.352 sec.
Spectral model in the cutoff power-law:
------------------------------------------------------------
Parameters  : value       lower 90%   higher 90%
Photon index: 0.385418     ( -0.624621   0.541302 )
Epeak [keV] : 44.7173      ( -3.81235 5.19255 )
Norm@50keV  : 2.29283E-02    ( -0.0116758   0.0298197 )
------------------------------------------------------------
#Fit statistic : Chi-Squared =          51.00 using 59 PHA bins.
# Reduced chi-squared =         0.9107 for     56 degrees of freedom
# Null hypothesis probability =   6.641043e-01

Photon flux (15-150 keV)    in 27.47 sec: 0.426072 ( -0.025406  0.025477 ) ph/cm2/s
Energy fluence (15-150 keV)             : 6.95112e-07 ( -5.4039e-08  5.74453e-08 ) ergs/cm2
Band function
Time interval is from  -14.120 sec. to   13.352 sec.

Spectral model in the Band function:
------------------------------------------------------------
Parameters  : value       lower 90%   higher 90%
alpha       : 0.475029   ( -1.02295   1.9089 )
beta        : -2.58139    ( -0.609919   0.314165 )
Epeak [keV] : 38.9545      ( -5.49013 6.10053 )
Norm@50keV   : 8.45215E-02    ( -0.10811   1.8443 )
------------------------------------------------------------
#Fit statistic : Chi-Squared =          45.05 using 59 PHA bins.
# Reduced chi-squared =         0.8192 for     55 degrees of freedom
# Null hypothesis probability =   8.283717e-01

Photon flux (15-150 keV)    in 27.47 sec:  (    ) ph/cm2/s
Energy fluence (15-150 keV)             : 7.30554e-07 ( -7.30361e-07  -5.49949e-08 ) ergs/cm2
Single BB

Spectral model blackbody:
------------------------------------------------------------
Parameters  : value    Lower 90%  Upper 90%
kT [keV]    : 10.5956  (-0.565112  0.60363)
R^2/D10^2   : 0.174408  (-0.0334982   0.040975)
(R is the radius in km and D10 is the distance to the source in units of 10 kpc)
------------------------------------------------------------
#Fit statistic : Chi-Squared =          71.99 using 59 PHA bins.
# Reduced chi-squared =          1.263 for     57 degrees of freedom
# Null hypothesis probability =   8.727722e-02

Energy  Fluence     90% Error
[keV]   [erg/cm2]   [erg/cm2]
15- 25  1.114e-07   9.299e-09
25- 50  3.000e-07   1.621e-08
50-150  1.847e-07   2.509e-08
15-150  5.962e-07   3.626e-08
Thermal bremsstrahlung (OTTB)

Spectral model: thermal bremsstrahlung
------------------------------------------------------------
Parameters  : value         Lower 90%    Upper 90%
kT [keV]    : 77.4939       (-12.1242      16.0289)
Norm        : 2.17232       (-0.171555     0.189591)
------------------------------------------------------------
#Fit statistic : Chi-Squared =          59.38 using 59 PHA bins.
# Reduced chi-squared =          1.042 for     57 degrees of freedom
# Null hypothesis probability =   3.888659e-01

Energy  Fluence     90% Error
[keV]   [erg/cm2]   [erg/cm2]
15- 25  1.545e-07   1.130e-08
25- 50  2.524e-07   1.346e-08
50-150  3.486e-07   4.711e-08
15-150  7.555e-07   5.247e-08
Double BB

Spectral model: bbodyrad<1> + bbodyrad<2>
------------------------------------------------------------
Parameters  : value         Lower 90%    Upper 90%
kT1 [keV]   : 8.83399        (-1.3158      0.989419)
R1^2/D10^2  : 0.296725        (-0.0757155      0.160361)
kT2 [keV]   : 33.1463        (-14.8598      111.784)
R2^2/D10^2  : 1.12773E-03    (-0.000952576   0.00530999)
------------------------------------------------------------
#Fit statistic : Chi-Squared =          44.73 using 59 PHA bins.
# Reduced chi-squared =         0.8133 for     55 degrees of freedom
# Null hypothesis probability =   8.372412e-01

Energy  Fluence     90% Error
[keV]   [erg/cm2]   [erg/cm2]
15- 25  1.276e-07   1.696e-08
25- 50  2.851e-07   4.349e-08
50-150  3.288e-07   1.307e-07
15-150  7.415e-07   1.861e-07
Peak spectrum fit
Power-law model
Time interval is from   -1.044 sec. to   -0.044 sec.

Spectral model in power-law:
------------------------------------------------------------
Parameters  : value       lower 90%   higher 90%
Photon index: 1.66733     ( -0.249685   0.257682 )
Norm@50keV  : 6.39529E-03    ( -0.00101239   0.000983376 )
------------------------------------------------------------
#Fit statistic : Chi-Squared =          54.51 using 59 PHA bins.
# Reduced chi-squared =         0.9563 for     57 degrees of freedom
# Null hypothesis probability =   5.691513e-01

Photon flux (15-150 keV)    in 1 sec: 0.839902 ( -0.113451  0.113462 ) ph/cm2/s
Energy fluence (15-150 keV)             : 5.93789e-08 ( -9.86548e-09  1.01297e-08 ) ergs/cm2
Cutoff power-law model

Time interval is from   -1.044 sec. to   -0.044 sec.
Spectral model in the cutoff power-law:
------------------------------------------------------------
Parameters  : value       lower 90%   higher 90%
Photon index: 1.67315     ( -0.257659   0.25248 )
Epeak [keV] : 9999.35      ( -9999.35 -9999.36 )
Norm@50keV  : 6.39162E-03    ( -0.00100655   0.00759847 )
------------------------------------------------------------
#Fit statistic : Chi-Squared =          54.51 using 59 PHA bins.
# Reduced chi-squared =         0.9735 for     56 degrees of freedom
# Null hypothesis probability =   5.312444e-01

Photon flux (15-150 keV)    in 1 sec: 0.839973 ( -0.113466  0.113319 ) ph/cm2/s
Energy fluence (15-150 keV)             : 5.94428e-08 ( -5.0713e-09  9.722e-09 ) ergs/cm2
Band function
Time interval is from   -1.044 sec. to   -0.044 sec.

Spectral model in the Band function:
------------------------------------------------------------
Parameters  : value       lower 90%   higher 90%
alpha       : 4.73088   ( -4.73088   -4.73088 )
beta        : -1.75373    ( -0.316345   0.284701 )
Epeak [keV] : 21.8162      ( -21.8162 7.49996 )
Norm@50keV   : 1157.30    ( -155.863   5.0481e+06 )
------------------------------------------------------------
#Fit statistic : Chi-Squared =          53.99 using 59 PHA bins.
# Reduced chi-squared =         0.9817 for     55 degrees of freedom
# Null hypothesis probability =   5.131373e-01

Photon flux (15-150 keV)    in 1 sec:  (    ) ph/cm2/s
Energy fluence (15-150 keV)             : 0 ( 0  0 ) ergs/cm2
Single BB

Spectral model blackbody:
------------------------------------------------------------
Parameters  : value    Lower 90%  Upper 90%
kT [keV]    : 9.92473  (-1.47044  1.85972)
R^2/D10^2   : 0.404409  (-0.193151   0.335589)
(R is the radius in km and D10 is the distance to the source in units of 10 kpc)
------------------------------------------------------------
#Fit statistic : Chi-Squared =          69.12 using 59 PHA bins.
# Reduced chi-squared =          1.213 for     57 degrees of freedom
# Null hypothesis probability =   1.303646e-01

Energy  Fluence     90% Error
[keV]   [erg/cm2]   [erg/cm2]
15- 25  8.092e-09   2.061e-09
25- 50  1.990e-08   3.985e-09
50-150  1.016e-08   4.057e-09
15-150  3.816e-08   7.610e-09
Thermal bremsstrahlung (OTTB)

Spectral model: thermal bremsstrahlung
------------------------------------------------------------
Parameters  : value         Lower 90%    Upper 90%
kT [keV]    : 149.030       (-74.9138      -146.998)
Norm        : 3.44397       (-0.506839     0.756888)
------------------------------------------------------------
#Fit statistic : Chi-Squared =          56.10 using 59 PHA bins.
# Reduced chi-squared =         0.9841 for     57 degrees of freedom
# Null hypothesis probability =   5.089921e-01

Energy  Fluence     90% Error
[keV]   [erg/cm2]   [erg/cm2]
15- 25  8.850e-09   4.947e-09
25- 50  1.639e-08   9.010e-09
50-150  3.226e-08   1.915e-08
15-150  5.750e-08   3.292e-08
Double BB

Spectral model: bbodyrad<1> + bbodyrad<2>
------------------------------------------------------------
Parameters  : value         Lower 90%    Upper 90%
kT1 [keV]   : 8.09770        (-1.14634      1.34812)
R1^2/D10^2  : 0.771430        (-0.255259      0.859935)
kT2 [keV]   : 185.304        (-147.466      -184.761)
R2^2/D10^2  : 1.38894E-04    (-5.38897e-05   0.00295659)
------------------------------------------------------------
#Fit statistic : Chi-Squared =          47.06 using 59 PHA bins.
# Reduced chi-squared =         0.8557 for     55 degrees of freedom
# Null hypothesis probability =   7.679340e-01

Energy  Fluence     90% Error
[keV]   [erg/cm2]   [erg/cm2]
15- 25  9.393e-09   2.774e-09
25- 50  1.789e-08   5.890e-09
50-150  3.788e-08   9.979e-09
15-150  6.517e-08   1.700e-08
Pre-slew spectrum (Pre-slew PHA with pre-slew DRM)
Power-law model

Spectral model in power-law:
------------------------------------------------------------
Parameters  : value       lower 90%   higher 90%
Photon index: 1.87483     ( -0.0922454   0.093857 )
Norm@50keV  : 3.21014E-03    ( -0.000191917   0.000190491 )
------------------------------------------------------------
#Fit statistic : Chi-Squared =          79.01 using 59 PHA bins.
# Reduced chi-squared =          1.386 for     57 degrees of freedom
# Null hypothesis probability =   2.844897e-02

Photon flux (15-150 keV)    in 27.47 sec: 0.455846 ( -0.0236672  0.0236819 ) ph/cm2/s
Energy fluence (15-150 keV)             : 8.10656e-07 ( -4.81362e-08  4.85999e-08 ) ergs/cm2
Cutoff power-law model

Spectral model in the cutoff power-law:
------------------------------------------------------------
Parameters  : value       lower 90%   higher 90%
Photon index: 0.385418     ( -0.624621   0.541302 )
Epeak [keV] : 44.7173      ( -3.81235 5.19255 )
Norm@50keV  : 2.29283E-02    ( -0.0116758   0.0298197 )
------------------------------------------------------------
#Fit statistic : Chi-Squared =          51.00 using 59 PHA bins.
# Reduced chi-squared =         0.9107 for     56 degrees of freedom
# Null hypothesis probability =   6.641043e-01

Photon flux (15-150 keV)    in 27.47 sec: 0.426072 ( -0.025406  0.025477 ) ph/cm2/s
Energy fluence (15-150 keV)             : 6.95112e-07 ( -5.4039e-08  5.74453e-08 ) ergs/cm2
Band function

Spectral model in the Band function:
------------------------------------------------------------
Parameters  : value       lower 90%   higher 90%
alpha       : 0.475029   ( -1.02295   1.9089 )
beta        : -2.58139    ( -0.609919   0.314165 )
Epeak [keV] : 38.9545      ( -5.49013 6.10053 )
Norm@50keV   : 8.45215E-02    ( -0.10811   1.8443 )
------------------------------------------------------------
#Fit statistic : Chi-Squared =          45.05 using 59 PHA bins.
# Reduced chi-squared =         0.8192 for     55 degrees of freedom
# Null hypothesis probability =   8.283717e-01

Photon flux (15-150 keV)    in 27.47 sec:  (    ) ph/cm2/s
Energy fluence (15-150 keV)             : 7.30554e-07 ( -7.30361e-07  -5.49949e-08 ) ergs/cm2
S(25-50 keV) vs. S(50-100 keV) plot
S(25-50 keV)  = 2.34e-07
S(50-100 keV) = 2.56e-07
T90 vs. Hardness ratio plot
T90                                   = 22.2560000121593 sec.
Hardness ratio (energy fluence ratio) = 1.09402
Color vs. Color plot
Count Ratio  (25-50 keV) / (15-25 keV) = 1.38198
Count Ratio (50-100 keV) / (15-25 keV) = 0.568832
Mask shadow pattern
IMX = -1.250973248164751E-01, IMY = -5.644920245335627E-02
TIME vs. PHA plot around the trigger time
Blue+Cyan dotted lines: Time interval of the scaled map
From 0.000000 to 1.024000
TIME vs. DetID plot around the trigger time
Blue+Cyan dotted lines: Time interval of the scaled map
From 0.000000 to 1.024000
100 us light curve (15-350 keV)
Blue+Cyan dotted lines: Time interval of the scaled map
From 0.000000 to 1.024000
Spacecraft aspect plot
Bright source in the pre-burst/pre-slew/post-slew images
Pre-burst image of 15-350 keV band
Time interval of the image:
-105.723400 -14.120000

# RAcent  DECcent POSerr Theta    Phi  PeakCts   SNR AngSep     Name
#  [deg]    [deg]    ['] [deg]  [deg]                   [']
285.0522 -24.9976   14.0  56.8   -6.9   0.3858   0.8    4.7	HT1900.1-2455
324.5652  -1.2730    2.2  44.6   50.2   2.2713   5.2 ------	UNKNOWN
 58.9484 -63.7931    2.6  46.4 -124.0   1.6872   4.5 ------	UNKNOWN
Pre-slew background subtracted image of 15-350 keV band
Time interval of the image:
-14.120000 13.352000

# RAcent  DECcent POSerr Theta    Phi  PeakCts   SNR AngSep     Name
#  [deg]    [deg]    ['] [deg]  [deg]                   [']
285.0345 -24.8809   12.2  56.9   -6.8   0.2852   1.0    2.4	HT1900.1-2455
329.0418 -30.6612    2.4  20.0   16.5   0.2849   4.9 ------	UNKNOWN
  0.1180 -34.8456    0.4   7.8  155.7   1.6095  30.9 ------	UNKNOWN
Post-slew image of 15-350 keV band
Time interval of the image:
739.676580 962.490400

# RAcent  DECcent POSerr Theta    Phi  PeakCts   SNR AngSep     Name
#  [deg]    [deg]    ['] [deg]  [deg]                   [']
 61.0845   9.9266    2.3  54.9  165.6   4.4443   5.1 ------	UNKNOWN
 49.0320   0.0494    2.7  40.0  159.4   1.1621   4.3 ------	UNKNOWN
 53.7315  -5.0620    2.4  38.5  170.1   1.0740   4.8 ------	UNKNOWN
338.5309 -63.5572    2.5  41.8  -29.2   1.0261   4.7 ------	UNKNOWN
Plot creation:
Sun May 31 09:14:43 EDT 2015