Special notes of this burst
Image
Pre-slew 15.0-350.0 keV image (Event data)
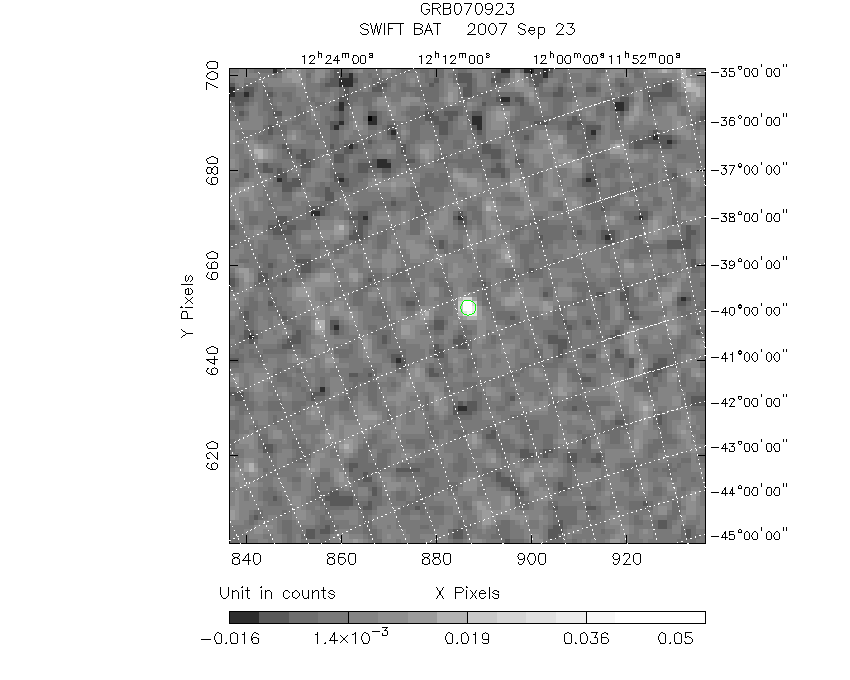
#   RAcent    DECcent   POSerr    Theta     Phi              Peak Cts       SNR   Name
  184.6412   -38.2813   0.0158    20.1521   -92.3035         0.0561092     12.198 TRIG_00292004

Foreground time interval of the image:
 -0.004   0.040 (delta_t =   0.044 [sec])
Background time interval of the image:
-239.932  -0.004 (delta_t = 239.928 [sec])
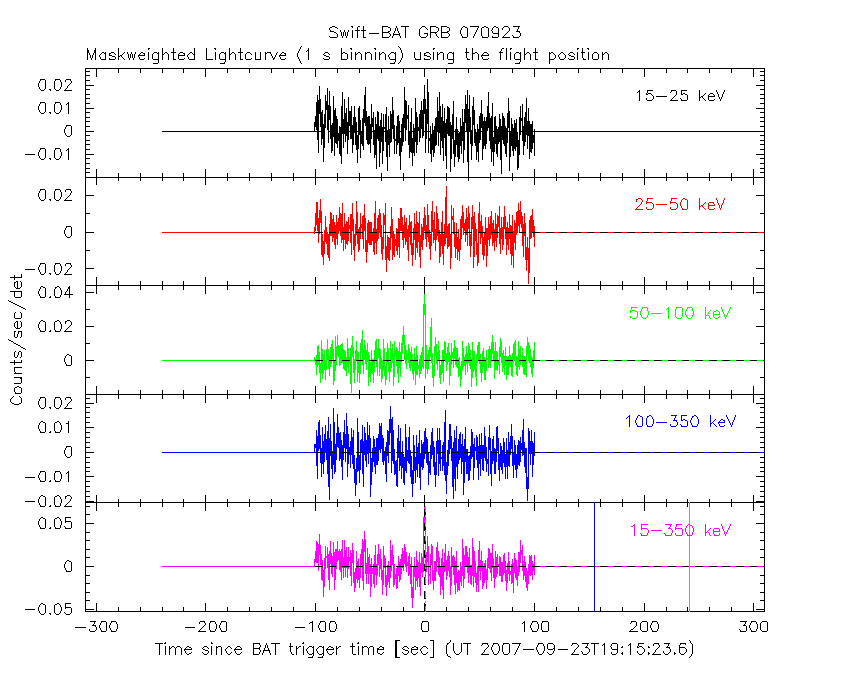
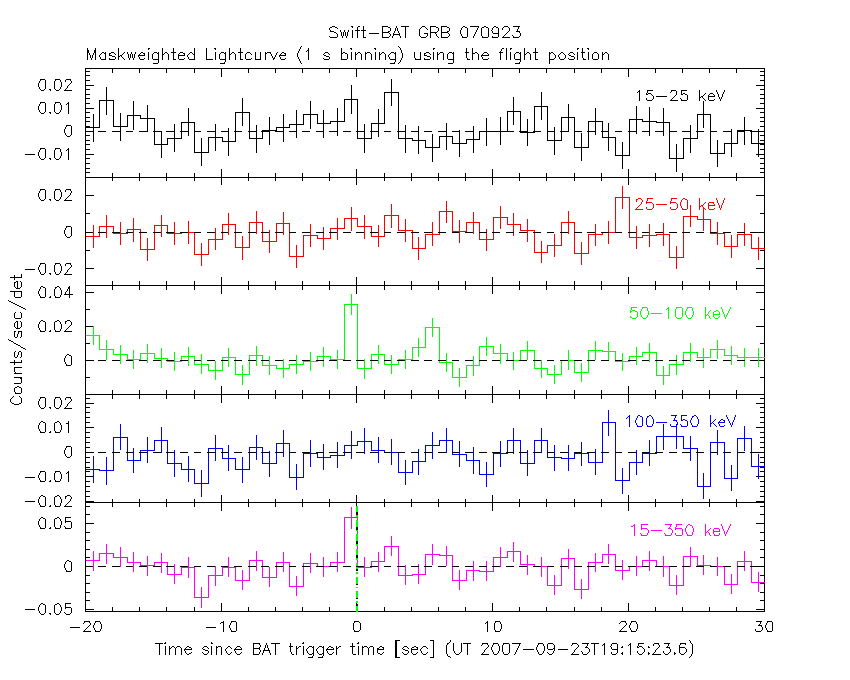
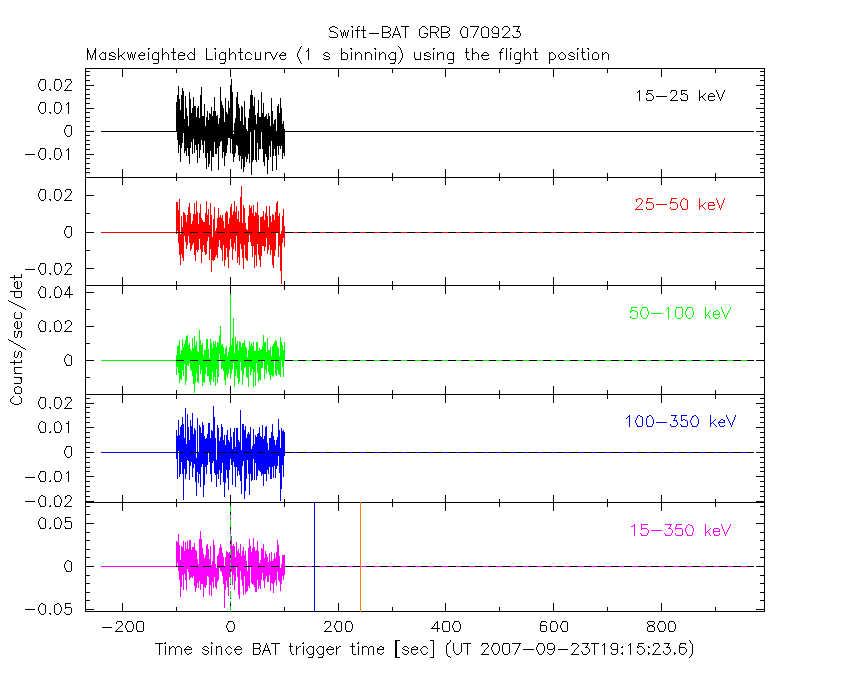
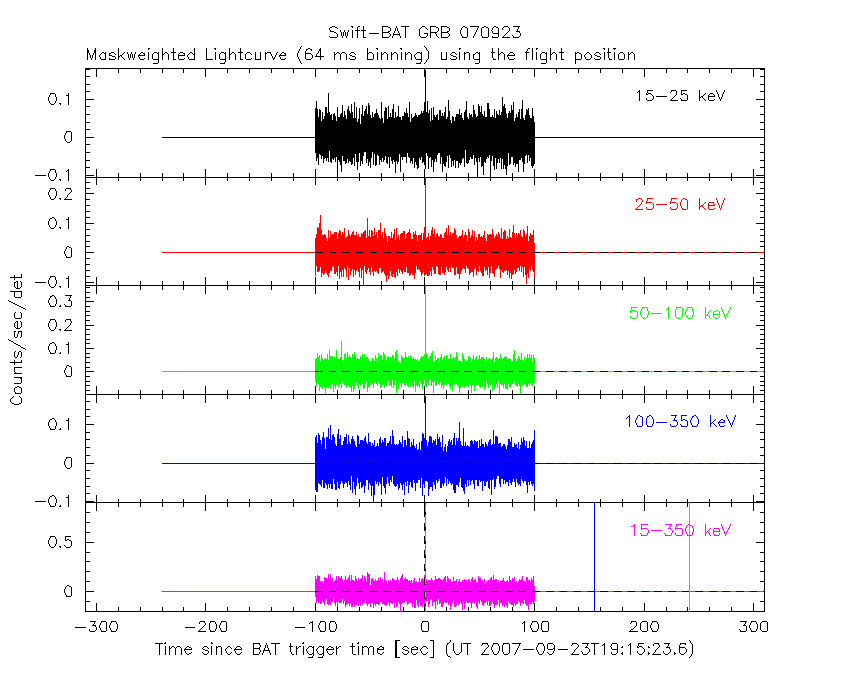
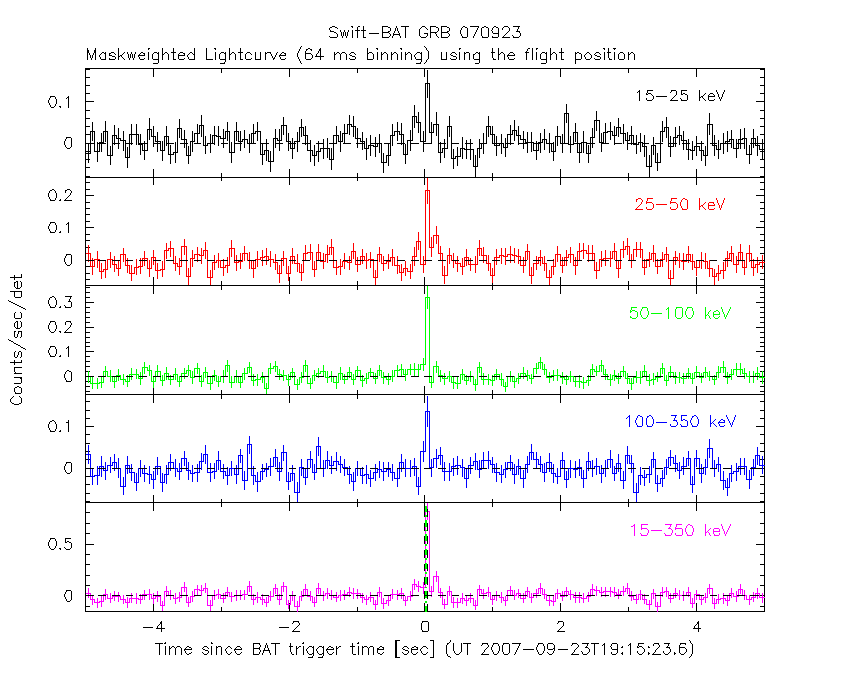
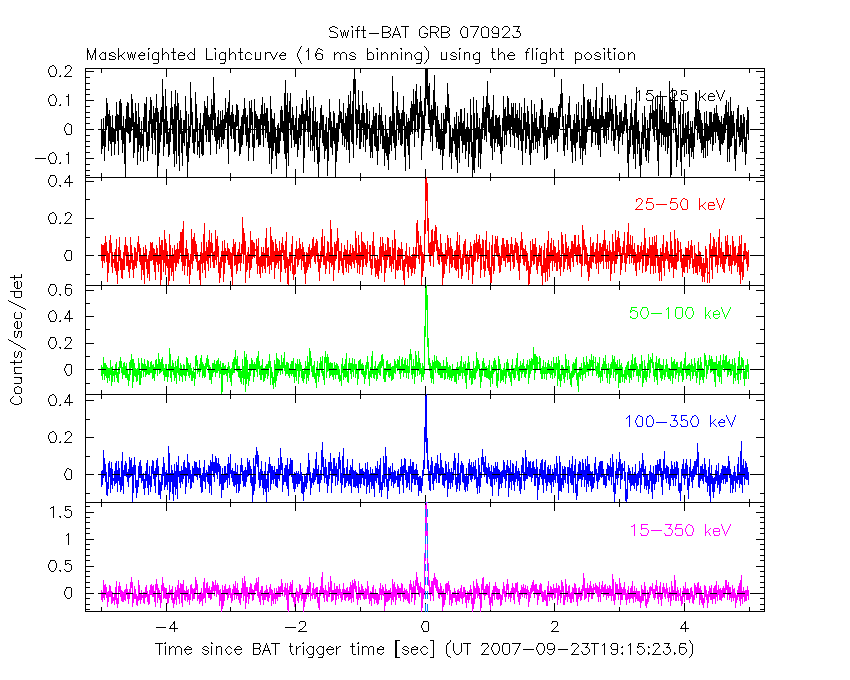
Lightcurves
Notes:
- 1) The mask-weighted light curves are using the flight position.
- 2) Multiple plots of different time binning/intervals are shown to cover all scenarios of short/long GRBs, rate/image triggers, and real/false positives.
- 3) For all the mask-weighted lightcurves, the y-axis units are counts/sec/det where a det is 0.4 x 0.4 = 0.16 sq cm.
- 4) The verticle lines correspond to following: green dotted lines are T50 interval, black dotted lines are T90 interval, blue solid line(s) is a spacecraft slew start time, and orange solid line(s) is a spacecraft slew end time.
- 5) Time of each bin is in the middle of the bin.
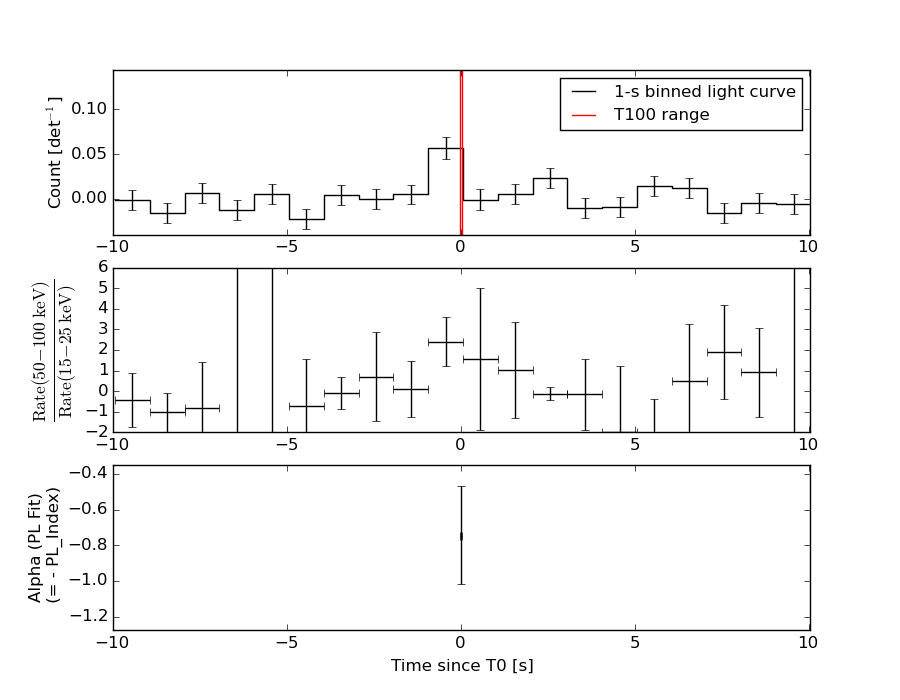
1 s binning
From T0-310 s to T0+310 s
From T100_start - 20 s to T100_end + 30 s
Full time interval
64 ms binning
Full time interval
From T100_start to T100_end
From T0-5 sec to T0+5 sec
16 ms binning
From T100_start-5 s to T100_start+5 s
Blue+Cyan dotted lines: Time interval of the scaled map
From 0.000000 to 0.032000
8 ms binning
From T100_start-3 s to T100_start+3 s
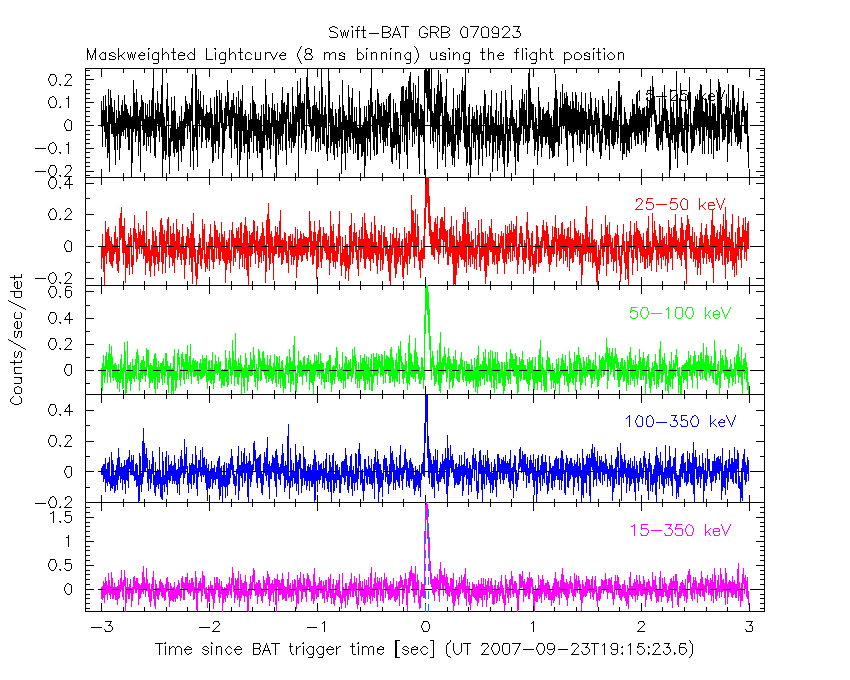
Blue+Cyan dotted lines: Time interval of the scaled map
From 0.000000 to 0.032000
2 ms binning
From T100_start-1 s to T100_start+1 s
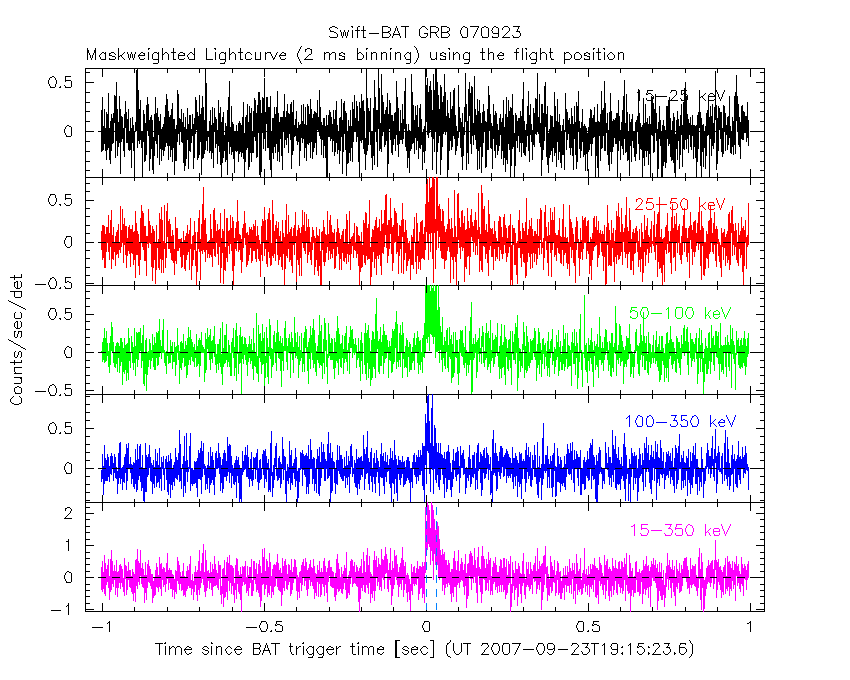
Blue+Cyan dotted lines: Time interval of the scaled map
From 0.000000 to 0.032000
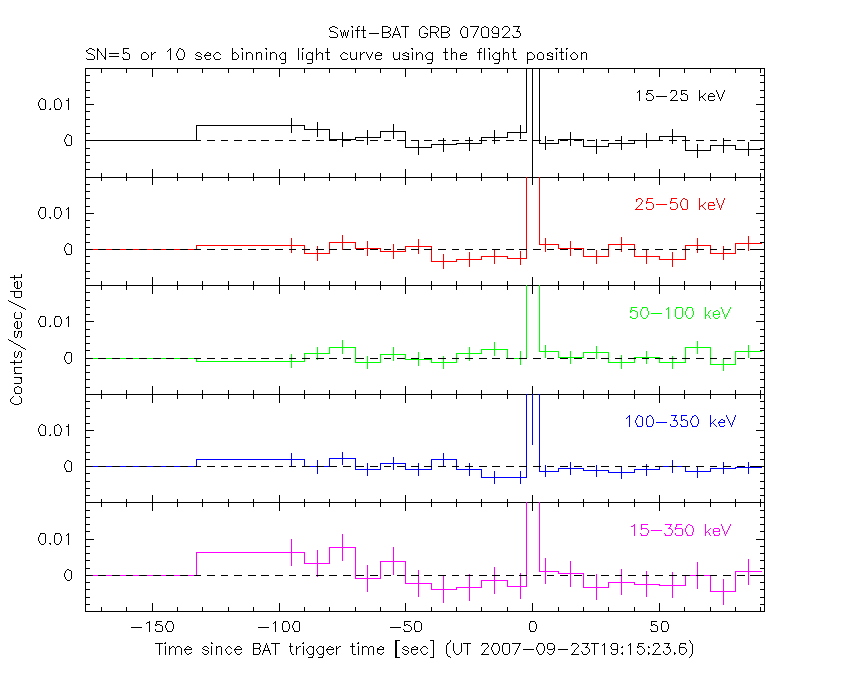
SN=5 or 10 sec. binning (whichever binning is satisfied first)
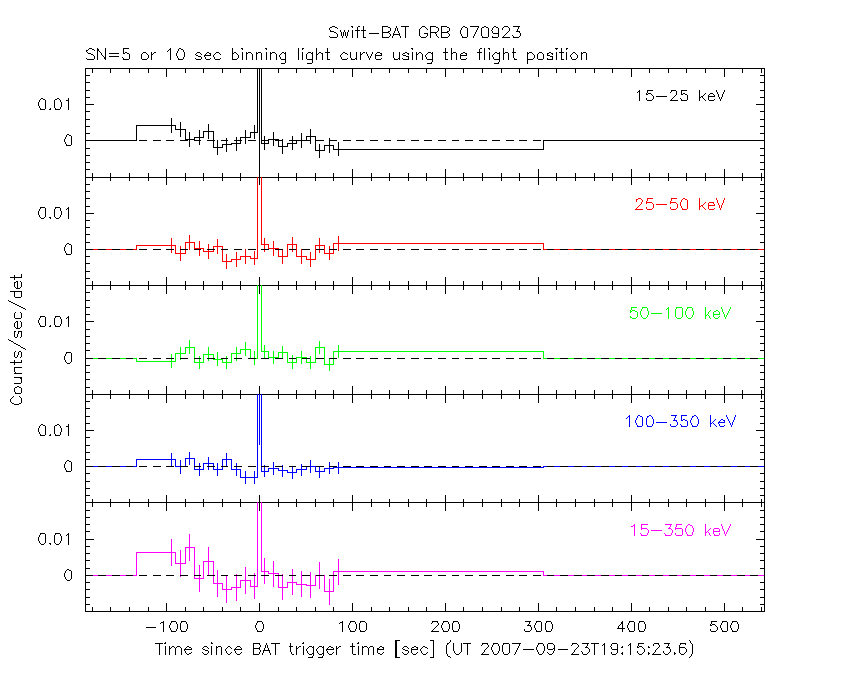
SN=5 or 10 sec. binning (T < 200 sec)
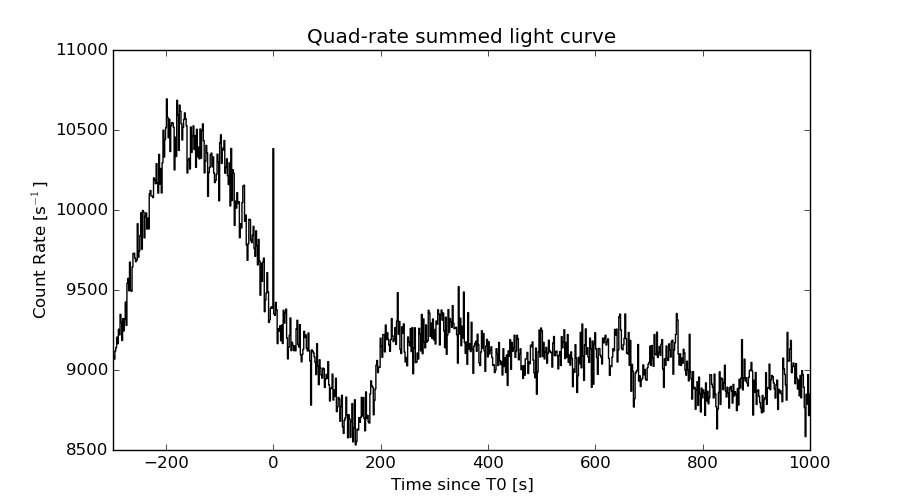
Quad-rate summed light curves (from T0-300s to T0+1000s)
Spectral Evolution
Spectra
Notes:
- 1) The fitting includes the systematic errors.
- 2) When the burst includes telescope slew time periods, the fitting uses an average response file made from multiple 5-s response files through out the slew time plus single time preiod for the non-slew times, and weighted by the total counts in the corresponding time period using addrmf. An average response file is needed becuase a spectral fit using the pre-slew DRM will introduce some errors in both a spectral shape and a normalization if the PHA file contains a lot of the slew/post-slew time interval.
- 3) For fits to more complicated models (e.g. a power-law over a cutoff power-law), the BAT team has decided to require a chi-square improvement of more than 6 for each extra dof.
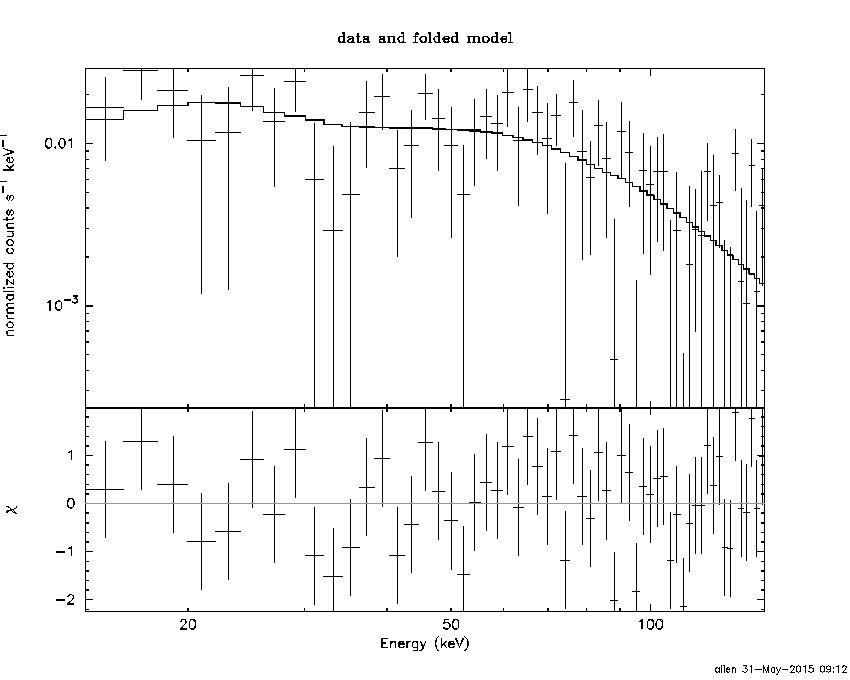
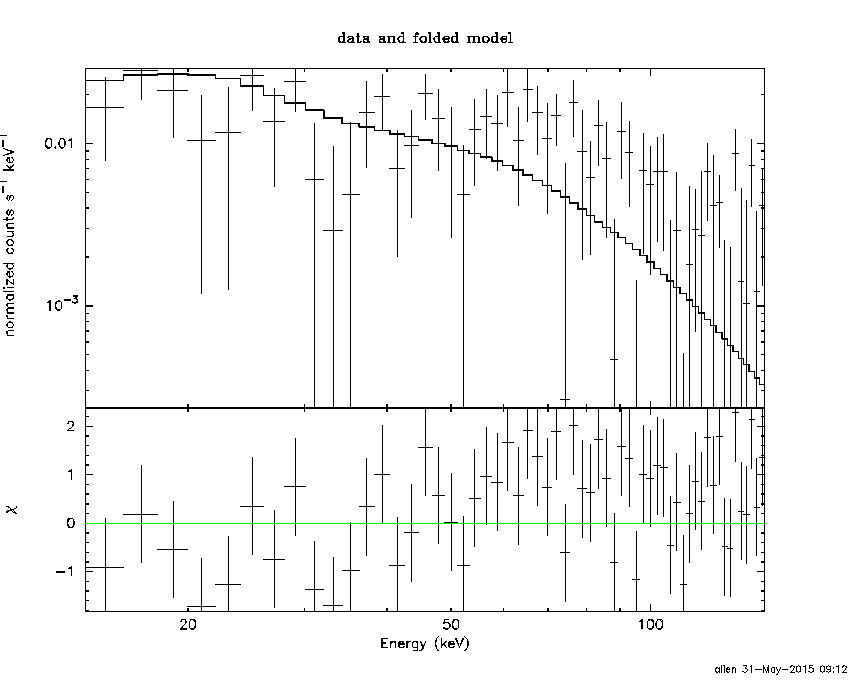
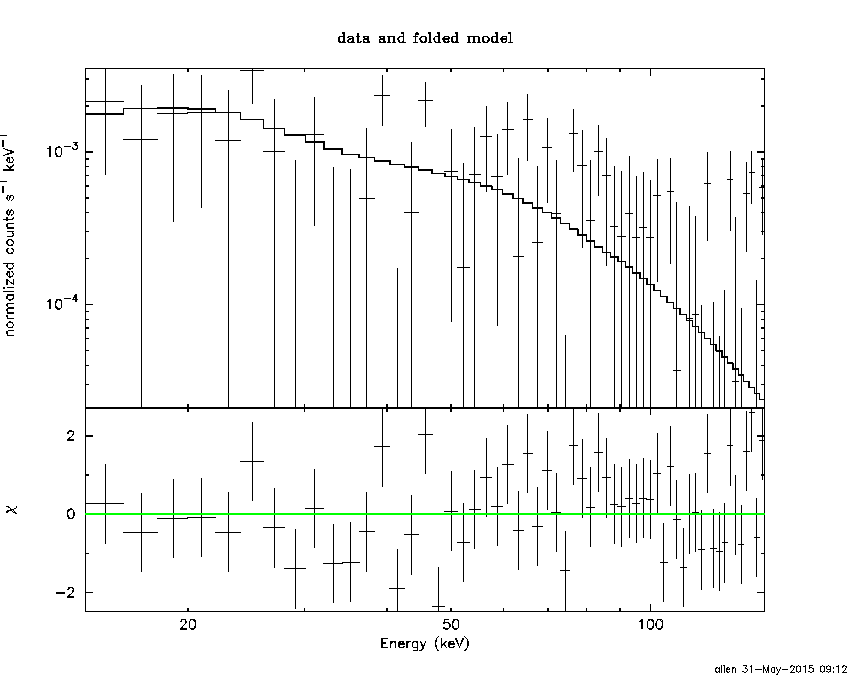
Time averaged spectrum fit using the average DRM
Power-law model

Time interval is from   -0.004 sec. to    0.040 sec.

Spectral model in power-law:
------------------------------------------------------------
Parameters  : value       lower 90%   higher 90%
Photon index: 0.750084     ( -0.28065   0.26986 )
Norm@50keV  : 7.33989E-02    ( -0.0111179   0.0110269 )
------------------------------------------------------------
#Fit statistic : Chi-Squared =          53.55 using 59 PHA bins.
# Reduced chi-squared =         0.9395 for     57 degrees of freedom
# Null hypothesis probability =   6.052387e-01

Photon flux (15-150 keV)    in 0.044 sec: 8.45539 ( -1.2537  1.25432 ) ph/cm2/s
Energy fluence (15-150 keV)             : 3.85552e-08 ( -6.59098e-09  6.64796e-09 ) ergs/cm2
Cutoff power-law model

Time interval is from   -0.004 sec. to    0.040 sec.
Spectral model in the cutoff power-law:
------------------------------------------------------------
Parameters  : value       lower 90%   higher 90%
Photon index: 0.742575     ( -0.835962   0.346429 )
Epeak [keV] : 1.00000E+04      (   )
Norm@50keV  : 7.39459E-02    (     )
------------------------------------------------------------
#Fit statistic : Chi-Squared =          53.57 using 59 PHA bins.
# Reduced chi-squared =         0.9565 for     56 degrees of freedom
# Null hypothesis probability =   5.675645e-01

Photon flux (15-150 keV)    in 0.044 sec: 8.45450 ( -1.25244  1.25279 ) ph/cm2/s
Energy fluence (15-150 keV)             : 3.83841e-08 ( -6.41898e-09  1.00203e-08 ) ergs/cm2
Band function
Time interval is from   -0.004 sec. to    0.040 sec.

Spectral model in the Band function:
------------------------------------------------------------
Parameters  : value       lower 90%   higher 90%
alpha       : -0.912139   ( 0.912139   0.912139 )
beta        : -0.750088    ( -0.269856   0.280647 )
Epeak [keV] : 15.5788      ( -15.5788 -15.5788 )
Norm@50keV   : 0.103432    ( -0.0409428   0 )
------------------------------------------------------------
#Fit statistic : Chi-Squared =          53.55 using 59 PHA bins.
# Reduced chi-squared =         0.9737 for     55 degrees of freedom
# Null hypothesis probability =   5.301264e-01

Photon flux (15-150 keV)    in 0.044 sec:  (    ) ph/cm2/s
Energy fluence (15-150 keV)             : 0 ( 0  0 ) ergs/cm2
Single BB
Spectral model blackbody:
------------------------------------------------------------
Parameters  : value    Lower 90%  Upper 90%
kT [keV]    : 26.7624  (-5.24303  7.53015)
R^2/D10^2   : 0.178954  (-0.0891929   0.15602)
(R is the radius in km and D10 is the distance to the source in units of 10 kpc)
------------------------------------------------------------
#Fit statistic : Chi-Squared =          61.63 using 59 PHA bins.
# Reduced chi-squared =          1.081 for     57 degrees of freedom
# Null hypothesis probability =   3.141652e-01

Energy  Fluence     90% Error
[keV]   [erg/cm2]   [erg/cm2]
15- 25  9.438e-10   3.069e-10
25- 50  5.537e-09   1.432e-09
50-150  2.903e-08   8.292e-09
15-150  3.551e-08   9.255e-09
Thermal bremsstrahlung (OTTB)
Spectral model: thermal bremsstrahlung
------------------------------------------------------------
Parameters  : value         Lower 90%    Upper 90%
kT [keV]    : 200.000       (      )
Norm        : 30.4999       (-4.92943     4.92943)
------------------------------------------------------------
#Fit statistic : Chi-Squared =          75.30 using 59 PHA bins.
# Reduced chi-squared =          1.321 for     57 degrees of freedom
# Null hypothesis probability =   5.262808e-02

Energy  Fluence     90% Error
[keV]   [erg/cm2]   [erg/cm2]
15- 25  3.322e-09   1.888e-09
25- 50  6.390e-09   3.650e-09
50-150  1.401e-08   8.089e-09
15-150  2.373e-08   1.349e-08
Double BB
Spectral model: bbodyrad<1> + bbodyrad<2>
------------------------------------------------------------
Parameters  : value         Lower 90%    Upper 90%
kT1 [keV]   : 4.09406        (-2.18843      4.71705)
R1^2/D10^2  : 39.0447        (-36.9062      3274.26)
kT2 [keV]   : 32.5088        (-7.72654      17.4883)
R2^2/D10^2  : 9.79164E-02    (-0.0674698   0.081746)
------------------------------------------------------------
#Fit statistic : Chi-Squared =          52.70 using 59 PHA bins.
# Reduced chi-squared =         0.9582 for     55 degrees of freedom
# Null hypothesis probability =   5.628885e-01

Energy  Fluence     90% Error
[keV]   [erg/cm2]   [erg/cm2]
15- 25  2.424e-09   1.206e-09
25- 50  4.984e-09   1.822e-09
50-150  3.106e-08   1.254e-08
15-150  3.847e-08   1.410e-08
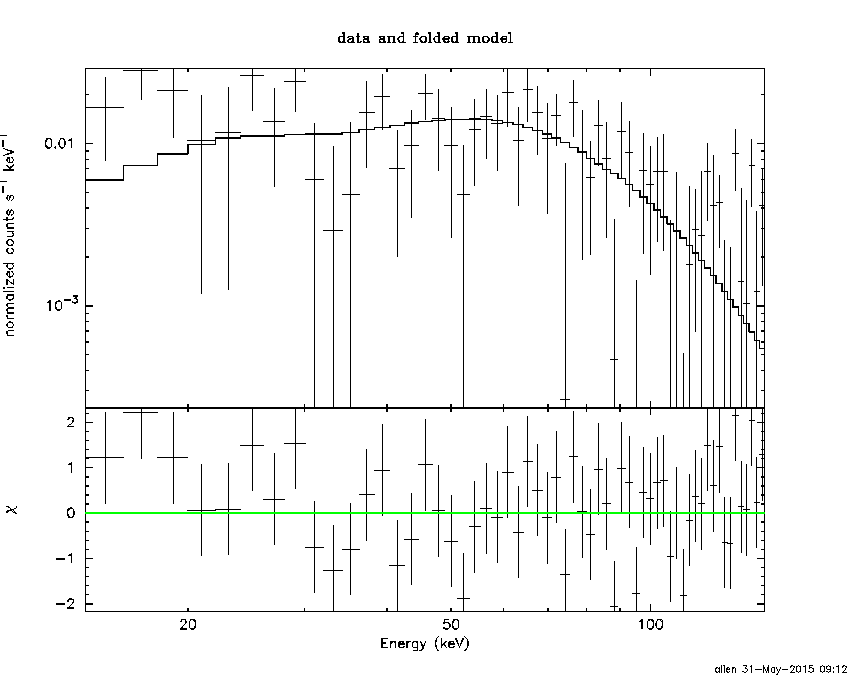
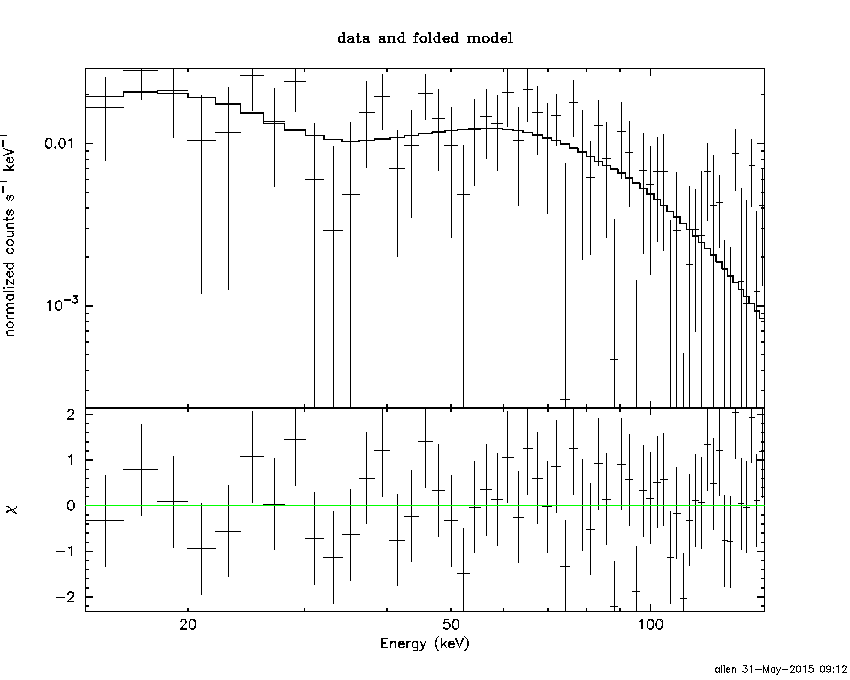
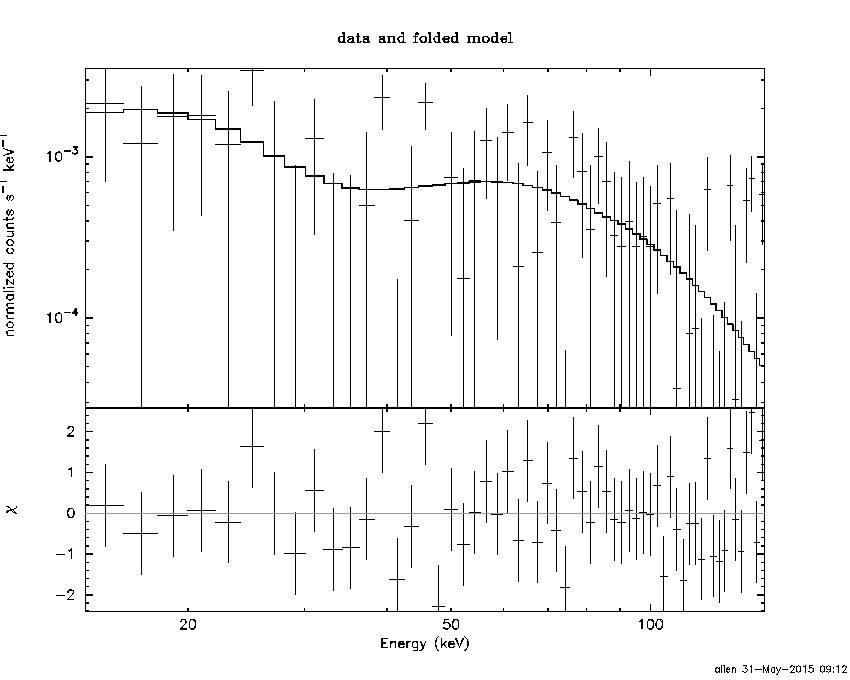
Peak spectrum fit
Power-law model

Time interval is from   -0.480 sec. to    0.520 sec.

Spectral model in power-law:
------------------------------------------------------------
Parameters  : value       lower 90%   higher 90%
Photon index: 0.961571     ( -0.592194   0.540749 )
Norm@50keV  : 4.69875E-03    ( -0.00132249   0.00128231 )
------------------------------------------------------------
#Fit statistic : Chi-Squared =          65.75 using 59 PHA bins.
# Reduced chi-squared =          1.154 for     57 degrees of freedom
# Null hypothesis probability =   1.996795e-01

Photon flux (15-150 keV)    in 1 sec: 0.540026 ( -0.150358  0.151303 ) ph/cm2/s
Energy fluence (15-150 keV)             : 5.1529e-08 ( -1.53769e-08  1.5605e-08 ) ergs/cm2
Cutoff power-law model
Time interval is from   -0.480 sec. to    0.520 sec.
Spectral model in the cutoff power-law:
------------------------------------------------------------
Parameters  : value       lower 90%   higher 90%
Photon index: 0.966704     ( -0.608093   0.534241 )
Epeak [keV] : 9999.33      ( -9999.36 -9999.36 )
Norm@50keV  : 4.73252E-03    ( -0.00128727   0.0165685 )
------------------------------------------------------------
#Fit statistic : Chi-Squared =          65.76 using 59 PHA bins.
# Reduced chi-squared =          1.174 for     56 degrees of freedom
# Null hypothesis probability =   1.747238e-01

Photon flux (15-150 keV)    in 1 sec: 0.542066 (    ) ph/cm2/s
Energy fluence (15-150 keV)             : 5.15345e-08 ( -1.53615e-08  1.54012e-08 ) ergs/cm2
Band function

Time interval is from   -0.480 sec. to    0.520 sec.

Spectral model in the Band function:
------------------------------------------------------------
Parameters  : value       lower 90%   higher 90%
alpha       : -0.861971   ( 0.861866   0.861866 )
beta        : -0.961526    ( 0.9615   0.592231 )
Epeak [keV] : 23.5354      ( -23.6769 -23.6769 )
Norm@50keV   : 7.13071E-03    ( -0.00368878   0.094068 )
------------------------------------------------------------
#Fit statistic : Chi-Squared =          65.75 using 59 PHA bins.
# Reduced chi-squared =          1.195 for     55 degrees of freedom
# Null hypothesis probability =   1.520662e-01

Photon flux (15-150 keV)    in 1 sec:  (    ) ph/cm2/s
Energy fluence (15-150 keV)             : 0 ( 0  0 ) ergs/cm2
Single BB
Spectral model blackbody:
------------------------------------------------------------
Parameters  : value    Lower 90%  Upper 90%
kT [keV]    : 26.4611  (-8.65556  18.3268)
R^2/D10^2   : 1.08470E-02  (-0.0108458   0.0254178)
(R is the radius in km and D10 is the distance to the source in units of 10 kpc)
------------------------------------------------------------
#Fit statistic : Chi-Squared =          69.02 using 59 PHA bins.
# Reduced chi-squared =          1.211 for     57 degrees of freedom
# Null hypothesis probability =   1.320745e-01

Energy  Fluence     90% Error
[keV]   [erg/cm2]   [erg/cm2]
15- 25  1.279e-09   8.125e-10
25- 50  7.463e-09   4.476e-09
50-150  3.835e-08   2.381e-08
15-150  4.710e-08   2.845e-08
Thermal bremsstrahlung (OTTB)
Spectral model: thermal bremsstrahlung
------------------------------------------------------------
Parameters  : value         Lower 90%    Upper 90%
kT [keV]    : 200.000       (      )
Norm        : 2.19548       (-0.619814     0.619788)
------------------------------------------------------------
#Fit statistic : Chi-Squared =          69.52 using 59 PHA bins.
# Reduced chi-squared =          1.220 for     57 degrees of freedom
# Null hypothesis probability =   1.234298e-01

Energy  Fluence     90% Error
[keV]   [erg/cm2]   [erg/cm2]
15- 25  5.469e-09   3.324e-09
25- 50  1.052e-08   6.445e-09
50-150  2.307e-08   1.422e-08
15-150  3.907e-08   2.327e-08
Double BB
Spectral model: bbodyrad<1> + bbodyrad<2>
------------------------------------------------------------
Parameters  : value         Lower 90%    Upper 90%
kT1 [keV]   : 4.13060        (-2.76543      4.81825)
R1^2/D10^2  : 4.07109        (-3.93466      6967.59)
kT2 [keV]   : 33.4045        (-12.2744      49.5616)
R2^2/D10^2  : 5.21124E-03    (-0.00459152   0.00805416)
------------------------------------------------------------
#Fit statistic : Chi-Squared =          63.96 using 59 PHA bins.
# Reduced chi-squared =          1.163 for     55 degrees of freedom
# Null hypothesis probability =   1.908111e-01

Energy  Fluence     90% Error
[keV]   [erg/cm2]   [erg/cm2]
15- 25  5.166e-09   3.054e-09
25- 50  7.169e-09   3.788e-09
50-150  4.099e-08   2.503e-08
15-150  5.333e-08   2.897e-08
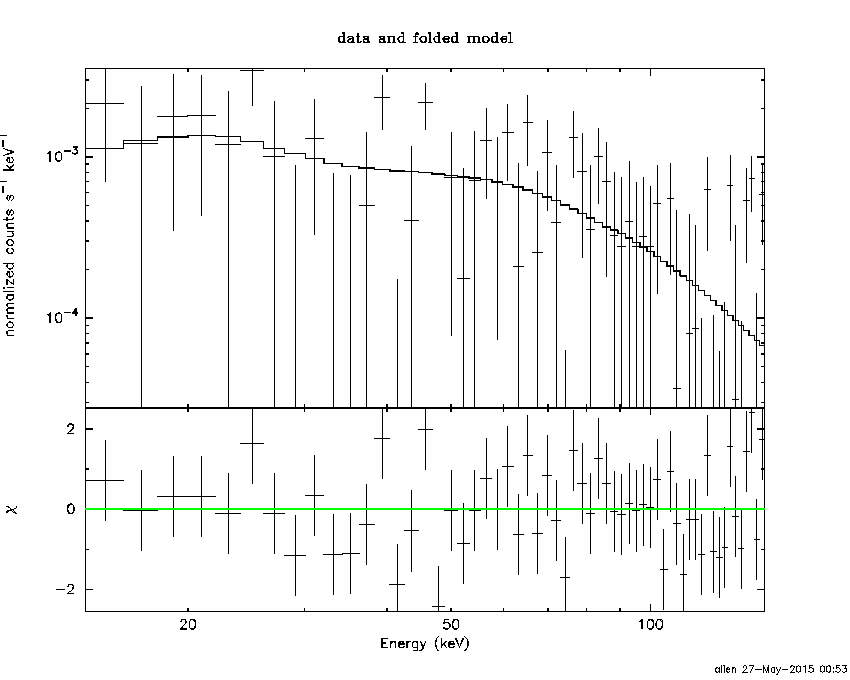
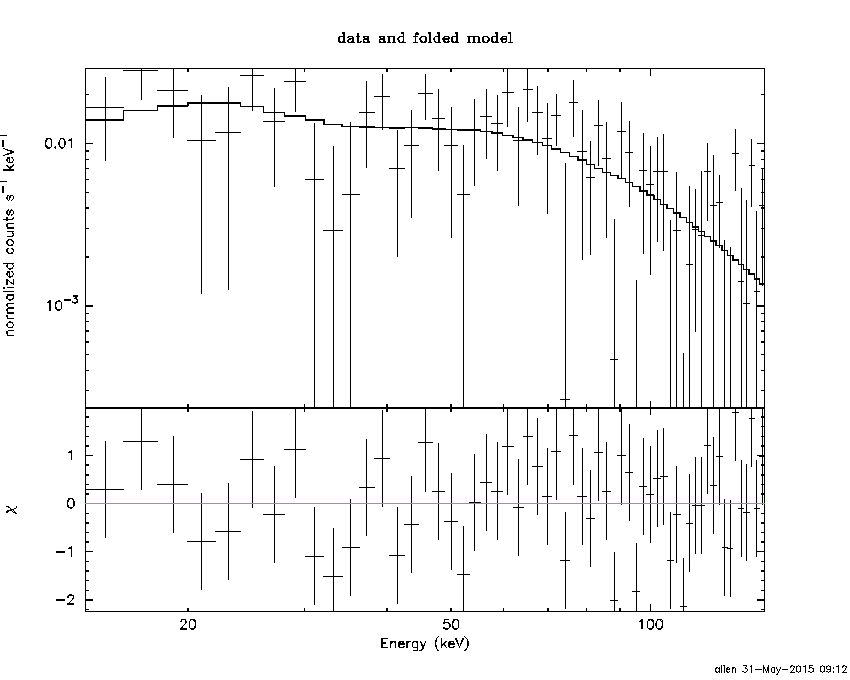
Pre-slew spectrum (Pre-slew PHA with pre-slew DRM)
Power-law model

Spectral model in power-law:
------------------------------------------------------------
Parameters  : value       lower 90%   higher 90%
Photon index: 0.750084     ( -0.28065   0.26986 )
Norm@50keV  : 7.33989E-02    ( -0.0111179   0.0110269 )
------------------------------------------------------------
#Fit statistic : Chi-Squared =          53.55 using 59 PHA bins.
# Reduced chi-squared =         0.9395 for     57 degrees of freedom
# Null hypothesis probability =   6.052387e-01

Photon flux (15-150 keV)    in 0.044 sec: 8.45539 ( -1.2537  1.25432 ) ph/cm2/s
Energy fluence (15-150 keV)             : 3.85552e-08 ( -6.59098e-09  6.64796e-09 ) ergs/cm2
Cutoff power-law model
Spectral model in the cutoff power-law:
------------------------------------------------------------
Parameters  : value       lower 90%   higher 90%
Photon index: 0.742575     ( -0.835962   0.346429 )
Epeak [keV] : 1.00000E+04      (   )
Norm@50keV  : 7.39459E-02    (     )
------------------------------------------------------------
#Fit statistic : Chi-Squared =          53.57 using 59 PHA bins.
# Reduced chi-squared =         0.9565 for     56 degrees of freedom
# Null hypothesis probability =   5.675645e-01

Photon flux (15-150 keV)    in 0.044 sec: 8.45450 ( -1.25244  1.25279 ) ph/cm2/s
Energy fluence (15-150 keV)             : 3.83841e-08 ( -6.41898e-09  1.00203e-08 ) ergs/cm2
Band function

Spectral model in the Band function:
------------------------------------------------------------
Parameters  : value       lower 90%   higher 90%
alpha       : -0.912139   ( 0.912139   0.912139 )
beta        : -0.750088    ( -0.269856   0.280647 )
Epeak [keV] : 15.5788      ( -15.5788 -15.5788 )
Norm@50keV   : 0.103432    ( -0.0409428   0 )
------------------------------------------------------------
#Fit statistic : Chi-Squared =          53.55 using 59 PHA bins.
# Reduced chi-squared =         0.9737 for     55 degrees of freedom
# Null hypothesis probability =   5.301264e-01

Photon flux (15-150 keV)    in 0.044 sec:  (    ) ph/cm2/s
Energy fluence (15-150 keV)             : 0 ( 0  0 ) ergs/cm2
S(25-50 keV) vs. S(50-100 keV) plot
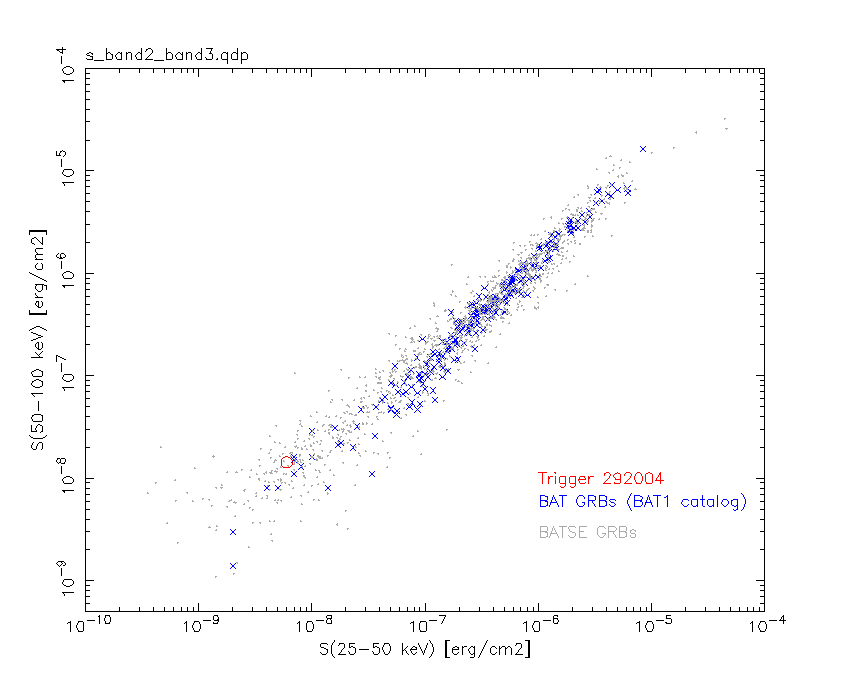
S(25-50 keV)  = 6.00e-09
S(50-100 keV) = 1.43e-08
T90 vs. Hardness ratio plot
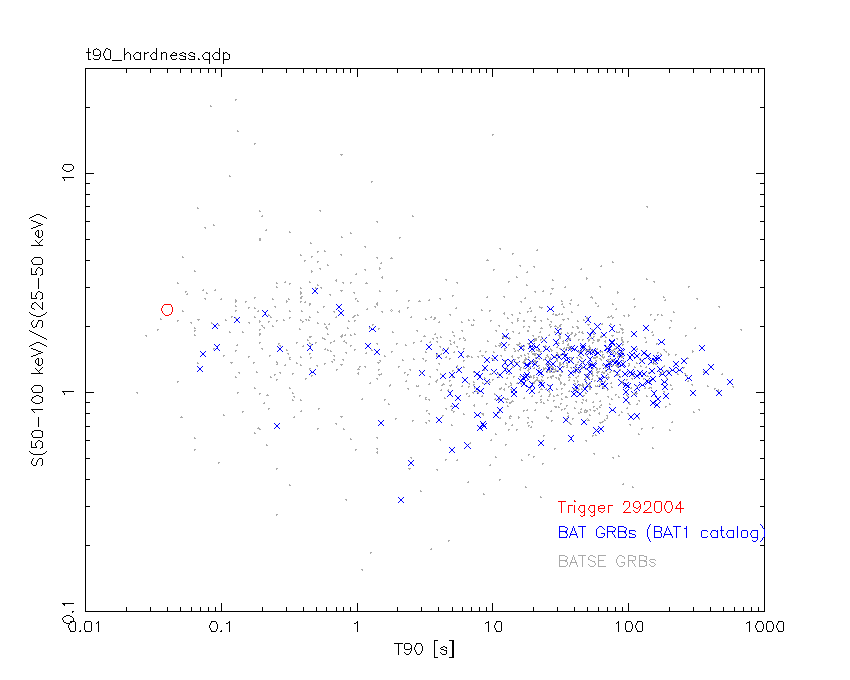
T90                                   = 0.0399999916553497 sec.
Hardness ratio (energy fluence ratio) = 2.38333
Color vs. Color plot
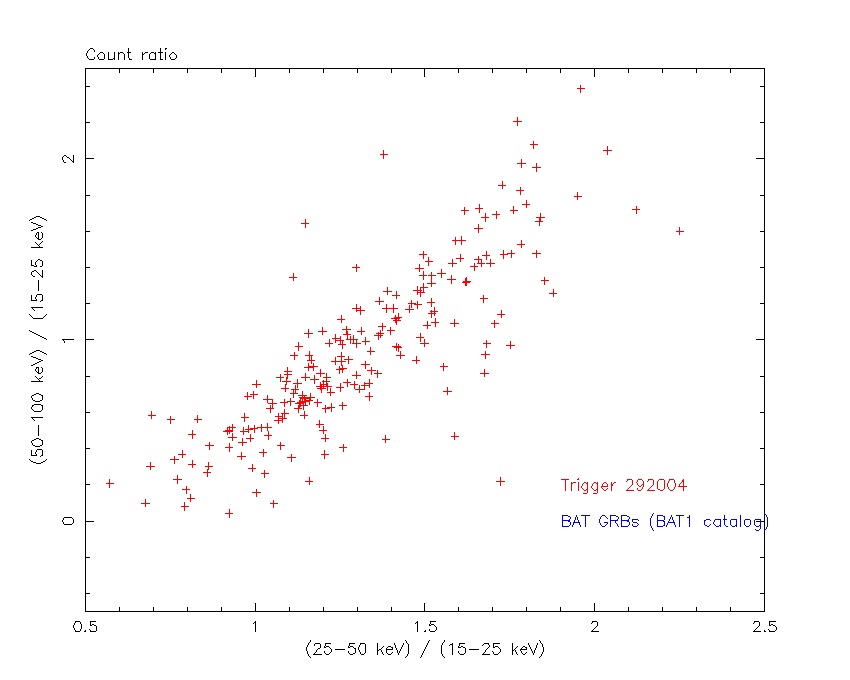
Count Ratio  (25-50 keV) / (15-25 keV) = 1.58996
Count Ratio (50-100 keV) / (15-25 keV) = 2.5171
Mask shadow pattern
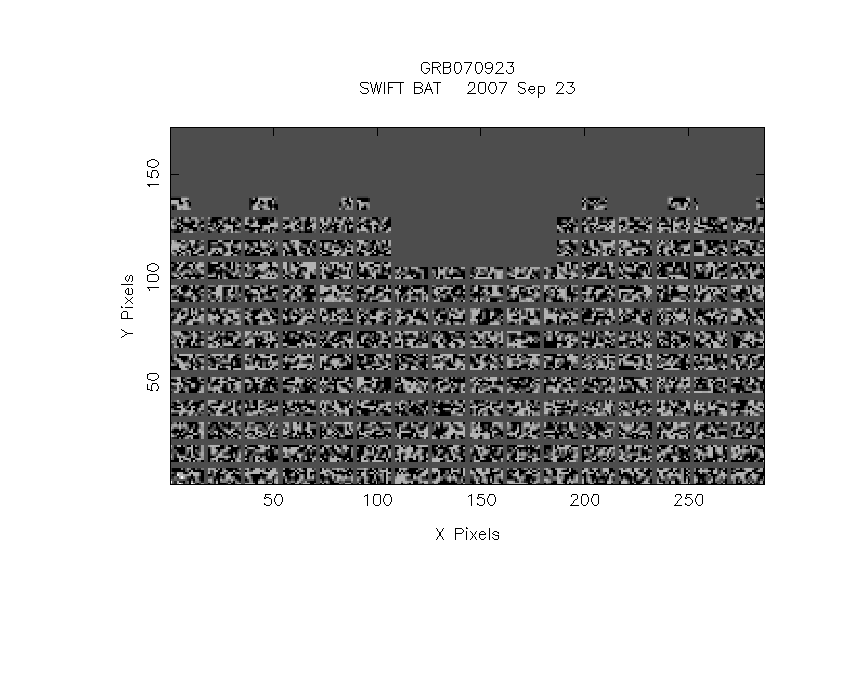
IMX = -1.474964381518899E-02, IMY = 3.666820475980682E-01
TIME vs. PHA plot around the trigger time
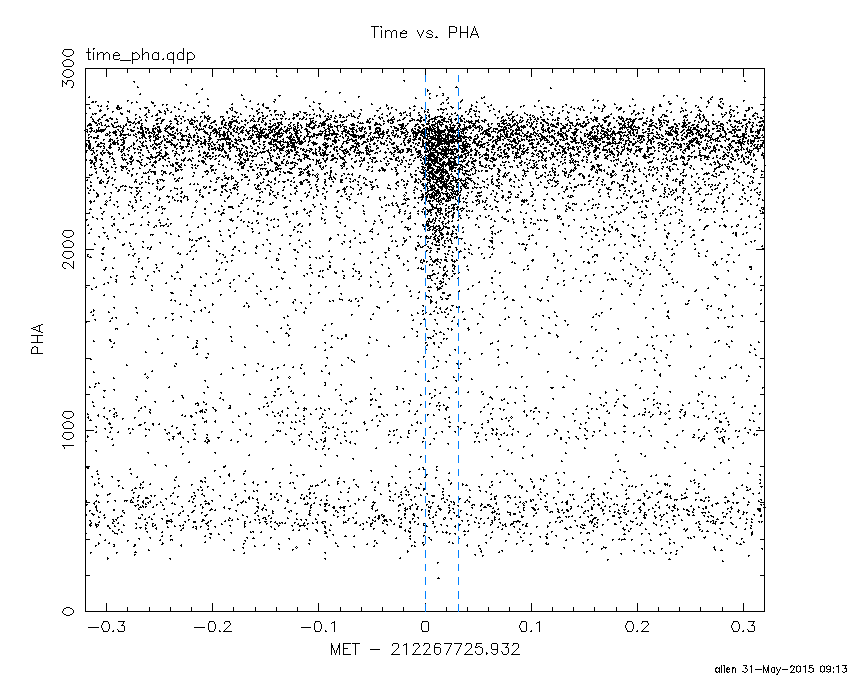
Blue+Cyan dotted lines: Time interval of the scaled map
From 0.000000 to 0.032000
TIME vs. DetID plot around the trigger time
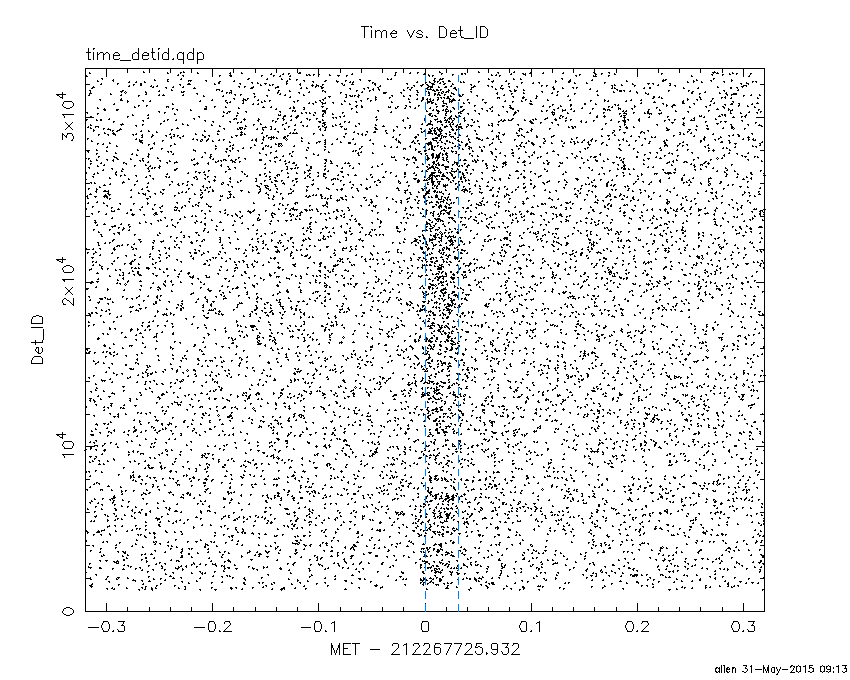
Blue+Cyan dotted lines: Time interval of the scaled map
From 0.000000 to 0.032000
100 us light curve (15-350 keV)
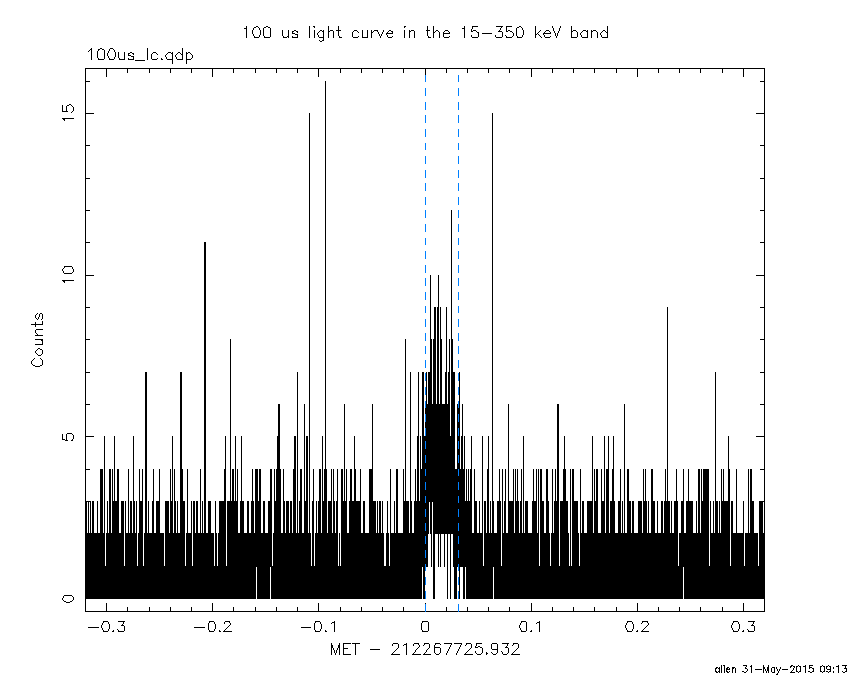
Blue+Cyan dotted lines: Time interval of the scaled map
From 0.000000 to 0.032000
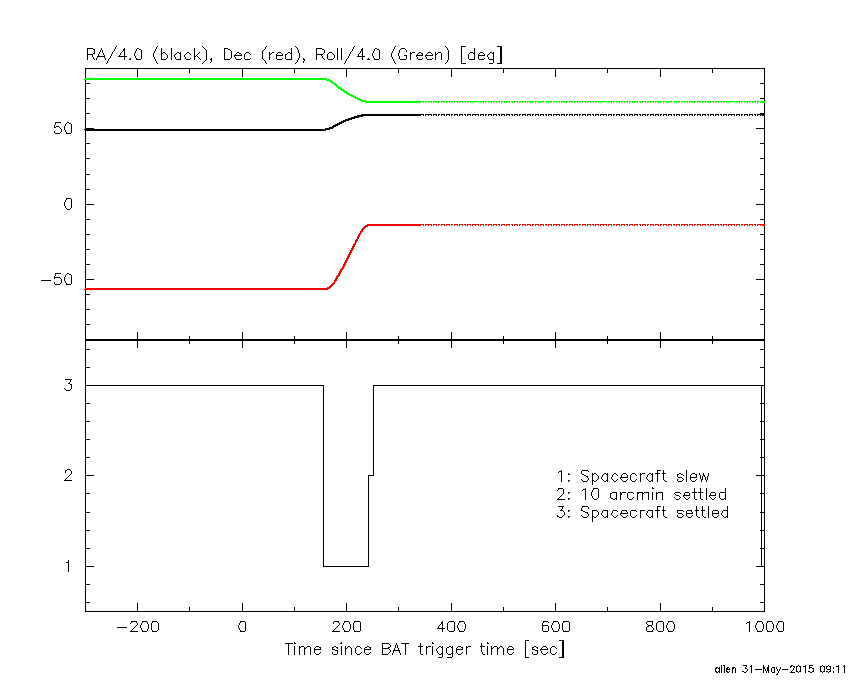
Spacecraft aspect plot
Bright source in the pre-burst/pre-slew/post-slew images
Pre-burst image of 15-350 keV band
Time interval of the image:
-239.932000 -0.004000

# RAcent  DECcent POSerr Theta    Phi  PeakCts   SNR AngSep     Name
#  [deg]    [deg]    ['] [deg]  [deg]                   [']
135.5232 -40.5447    1.0  42.6 -156.4   2.2928  11.4    0.6	Vela X-1
169.9843 -60.4931    0.0  15.1 -178.0   0.1359   1.1   12.5	Cen X-3
186.3947 -62.7432    3.9   8.6  157.0   0.3225   3.0    7.4	GX 301-2
244.9706 -15.6419    1.1  54.0   -0.1   4.8682  10.1    0.5	Sco X-1
255.9559 -37.7911   11.6  42.1   28.5   0.2586   1.0    3.5	4U 1700-377
256.3895 -36.4185   12.3  43.3   27.4  -0.2852  -0.9    2.2	GX 349+2
264.5875 -44.3241    9.5  42.4   42.2   0.4246   1.2   10.1	4U 1735-44
262.9772 -33.8859    7.5  48.8   30.6   0.9205   1.5    3.1	GX 354-0
324.3382 -85.7918    2.5  36.2  113.5   1.2767   4.6 ------	UNKNOWN
258.3404 -35.7700    3.4  44.9   28.4   1.0500   3.4 ------	UNKNOWN
Pre-slew background subtracted image of 15-350 keV band
Time interval of the image:
-0.004000 0.040000

# RAcent  DECcent POSerr Theta    Phi  PeakCts   SNR AngSep     Name
#  [deg]    [deg]    ['] [deg]  [deg]                   [']
135.5366 -40.4354    7.8  42.7 -156.2   0.0096   1.5    7.2	Vela X-1
170.4052 -60.7639 1013.0  14.9 -179.1   0.0000   0.0    8.9	Cen X-3
186.4171 -62.6512   18.5   8.5  157.5  -0.0024  -0.6    9.7	GX 301-2
245.0241 -15.6529   13.5  54.0   -0.1   0.0138   0.9    2.7	Sco X-1
255.9493 -37.8368    2.9  42.1   28.5   0.0324   4.0    1.8	4U 1700-377
256.5099 -36.4057    4.9  43.4   27.5   0.0210   2.3    3.7	GX 349+2
264.7434 -44.4847   12.6  42.3   42.5   0.0091   0.9    2.1	4U 1735-44
263.0294 -33.8957    4.7  48.9   30.6   0.0364   2.4    4.2	GX 354-0
113.2122 -61.3184    2.1  41.0  166.1   0.0360   5.4 ------	UNKNOWN
244.0632 -11.8923    2.5  56.8   -3.3   0.1028   4.6 ------	UNKNOWN
184.6412 -38.2812    0.9  20.2  -92.3   0.0561  12.2 ------	UNKNOWN
214.9528  -5.3493    2.7  52.8  -39.3   0.0855   4.3 ------	UNKNOWN
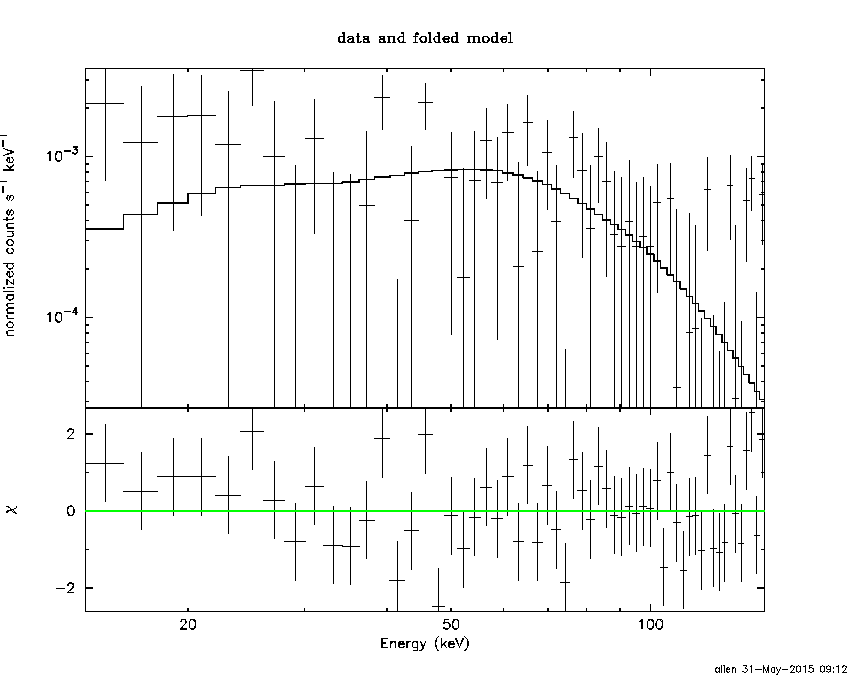
Post-slew image of 15-350 keV band
Time interval of the image:
Plot creation:
Sun May 31 09:13:07 EDT 2015