Click here for the BAT GCN circular template
Image
Pre-slew 15.0-350.0 keV image (Event data)
#   RAcent    DECcent   POSerr    Theta     Phi              Peak Cts       SNR   Name
  301.8580    10.9546   0.0053    31.7436    57.9141        11.4289109     36.546 TRIG_00292934

Foreground time interval of the image:
 -7.568 124.421 (delta_t = 131.989 [sec])
Background time interval of the image:
-239.280  -7.568 (delta_t = 231.712 [sec])
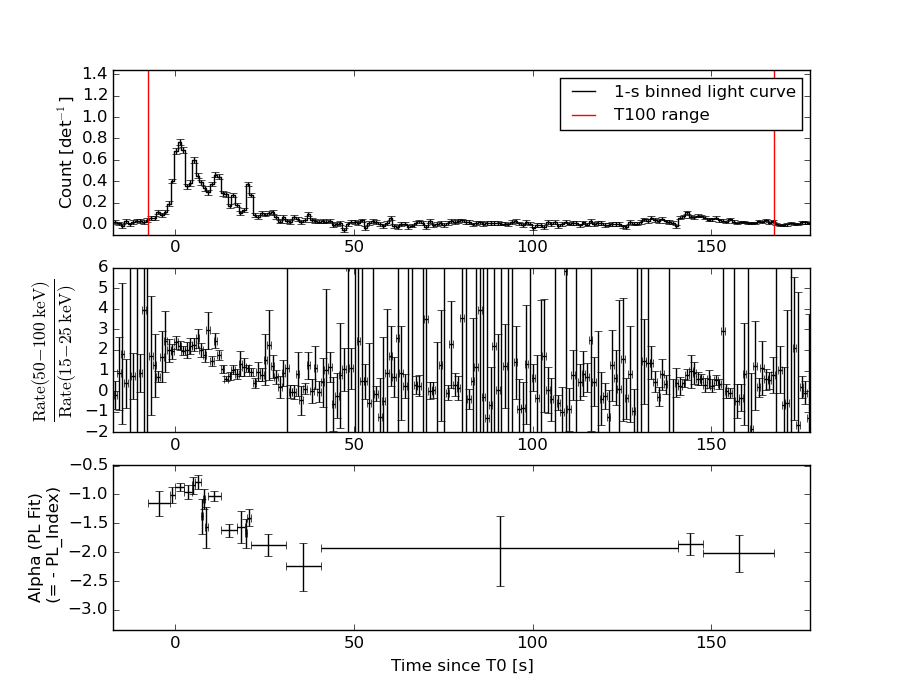
Lightcurves
Notes:
- 1) The mask-weighted light curves are using the flight position.
- 2) Multiple plots of different time binning/intervals are shown to cover all scenarios of short/long GRBs, rate/image triggers, and real/false positives.
- 3) For all the mask-weighted lightcurves, the y-axis units are counts/sec/det where a det is 0.4 x 0.4 = 0.16 sq cm.
- 4) The verticle lines correspond to following: green dotted lines are T50 interval, black dotted lines are T90 interval, blue solid line(s) is a spacecraft slew start time, and orange solid line(s) is a spacecraft slew end time.
- 5) Time of each bin is in the middle of the bin.
1 s binning
From T0-310 s to T0+310 s
From T100_start - 20 s to T100_end + 30 s
Full time interval
64 ms binning
Full time interval

From T100_start to T100_end
From T0-5 sec to T0+5 sec
16 ms binning
From T100_start-5 s to T100_start+5 s

Blue+Cyan dotted lines: Time interval of the scaled map
From 0.000000 to 1.024000
8 ms binning
From T100_start-3 s to T100_start+3 s

Blue+Cyan dotted lines: Time interval of the scaled map
From 0.000000 to 1.024000
2 ms binning
From T100_start-1 s to T100_start+1 s
Blue+Cyan dotted lines: Time interval of the scaled map
From 0.000000 to 1.024000
SN=5 or 10 sec. binning (whichever binning is satisfied first)
SN=5 or 10 sec. binning (T < 200 sec)
Quad-rate summed light curves (from T0-300s to T0+1000s)

Spectral Evolution
Spectra
Notes:
- 1) The fitting includes the systematic errors.
- 2) When the burst includes telescope slew time periods, the fitting uses an average response file made from multiple 5-s response files through out the slew time plus single time preiod for the non-slew times, and weighted by the total counts in the corresponding time period using addrmf. An average response file is needed becuase a spectral fit using the pre-slew DRM will introduce some errors in both a spectral shape and a normalization if the PHA file contains a lot of the slew/post-slew time interval.
- 3) For fits to more complicated models (e.g. a power-law over a cutoff power-law), the BAT team has decided to require a chi-square improvement of more than 6 for each extra dof.
Time averaged spectrum fit using the average DRM
Power-law model
Time interval is from   -7.568 sec. to  167.596 sec.

Spectral model in power-law:
------------------------------------------------------------
Parameters  : value       lower 90%   higher 90%
Photon index: 1.33513     ( -0.0619154   0.0617006 )
Norm@50keV  : 4.86468E-03    ( -0.00015442   0.000154401 )
------------------------------------------------------------
#Fit statistic : Chi-Squared =          53.14 using 59 PHA bins.
# Reduced chi-squared =         0.9323 for     57 degrees of freedom
# Null hypothesis probability =   6.205363e-01

Photon flux (15-150 keV)    in 175.2 sec: 0.584292 ( -0.0201601  0.0202434 ) ph/cm2/s
Energy fluence (15-150 keV)             : 8.35233e-06 ( -2.85301e-07  2.86259e-07 ) ergs/cm2
Cutoff power-law model
Time interval is from   -7.568 sec. to  167.596 sec.
Spectral model in the cutoff power-law:
------------------------------------------------------------
Parameters  : value       lower 90%   higher 90%
Photon index: 1.33151     ( -0.0623894   0.0620381 )
Epeak [keV] : 9998.65      ( -9998.67 -9998.67 )
Norm@50keV  : 4.88314E-03    ( -0.000154863   0.000567069 )
------------------------------------------------------------
#Fit statistic : Chi-Squared =          53.17 using 59 PHA bins.
# Reduced chi-squared =         0.9494 for     56 degrees of freedom
# Null hypothesis probability =   5.828379e-01

Photon flux (15-150 keV)    in 175.2 sec: 0.584337 ( -0.020512  0.01989 ) ph/cm2/s
Energy fluence (15-150 keV)             : 8.32263e-06 ( -2.84858e-07  3.3924e-07 ) ergs/cm2
Band function

Time interval is from   -7.568 sec. to  167.596 sec.

Spectral model in the Band function:
------------------------------------------------------------
Parameters  : value       lower 90%   higher 90%
alpha       : -0.189332   ( 0.803105   0.803105 )
beta        : -1.35988    ( -0.0837843   0.0702178 )
Epeak [keV] : 43.7625      ( -43.7859 104.839 )
Norm@50keV   : 3.07710E-02    ( -0.0310778   440.923 )
------------------------------------------------------------
#Fit statistic : Chi-Squared =          52.04 using 59 PHA bins.
# Reduced chi-squared =         0.9462 for     55 degrees of freedom
# Null hypothesis probability =   5.883190e-01

Photon flux (15-150 keV)    in 175.2 sec:  (    ) ph/cm2/s
Energy fluence (15-150 keV)             : 0 ( 0  0 ) ergs/cm2
Single BB
Spectral model blackbody:
------------------------------------------------------------
Parameters  : value    Lower 90%  Upper 90%
kT [keV]    : 18.5714  (  )
R^2/D10^2   : 3.16631E-02  (   )
(R is the radius in km and D10 is the distance to the source in units of 10 kpc)
------------------------------------------------------------
#Fit statistic : Chi-Squared =         284.69 using 59 PHA bins.
# Reduced chi-squared =         4.9945 for     57 degrees of freedom
# Null hypothesis probability =   5.389342e-32

Energy  Fluence     90% Error
[keV]   [erg/cm2]   [erg/cm2]
15- 25  3.791e-07   2.567e-08
25- 50  1.794e-06   8.269e-08
50-150  4.525e-06   2.742e-07
15-150  6.699e-06   2.514e-07
Thermal bremsstrahlung (OTTB)

Spectral model: thermal bremsstrahlung
------------------------------------------------------------
Parameters  : value         Lower 90%    Upper 90%
kT [keV]    : 200.000       (      )
Norm        : 2.45011       (-0.0784253     0.0783896)
------------------------------------------------------------
#Fit statistic : Chi-Squared =         100.09 using 59 PHA bins.
# Reduced chi-squared =         1.7559 for     57 degrees of freedom
# Null hypothesis probability =   3.686367e-04

Energy  Fluence     90% Error
[keV]   [erg/cm2]   [erg/cm2]
15- 25  1.069e-06   3.784e-08
25- 50  2.057e-06   7.621e-08
50-150  4.511e-06   1.507e-07
15-150  7.637e-06   2.628e-07
Double BB
Spectral model: bbodyrad<1> + bbodyrad<2>
------------------------------------------------------------
Parameters  : value         Lower 90%    Upper 90%
kT1 [keV]   : 7.62239        (-0.774338      0.850612)
R1^2/D10^2  : 0.429729        (-0.129537      0.197051)
kT2 [keV]   : 33.0863        (-3.65285      5.02337)
R2^2/D10^2  : 3.99652E-03    (-0.00142498   0.00186551)
------------------------------------------------------------
#Fit statistic : Chi-Squared =          48.79 using 59 PHA bins.
# Reduced chi-squared =         0.8871 for     55 degrees of freedom
# Null hypothesis probability =   7.094373e-01

Energy  Fluence     90% Error
[keV]   [erg/cm2]   [erg/cm2]
15- 25  8.740e-07   9.837e-08
25- 50  1.945e-06   1.380e-07
50-150  5.613e-06   5.457e-07
15-150  8.432e-06   7.288e-07
Peak spectrum fit
Power-law model

Time interval is from    0.372 sec. to    1.372 sec.

Spectral model in power-law:
------------------------------------------------------------
Parameters  : value       lower 90%   higher 90%
Photon index: 0.841377     ( -0.107581   0.106099 )
Norm@50keV  : 5.52901E-02    ( -0.00322008   0.00320711 )
------------------------------------------------------------
#Fit statistic : Chi-Squared =          42.51 using 59 PHA bins.
# Reduced chi-squared =         0.7458 for     57 degrees of freedom
# Null hypothesis probability =   9.234892e-01

Photon flux (15-150 keV)    in 1 sec: 6.34768 ( -0.365794  0.366457 ) ph/cm2/s
Energy fluence (15-150 keV)             : 6.35142e-07 ( -4.01897e-08  4.03334e-08 ) ergs/cm2
Cutoff power-law model

Time interval is from    0.372 sec. to    1.372 sec.
Spectral model in the cutoff power-law:
------------------------------------------------------------
Parameters  : value       lower 90%   higher 90%
Photon index: 0.833534     ( -0.197384   0.107635 )
Epeak [keV] : 9994.70      ( -9996.58 -9996.58 )
Norm@50keV  : 5.56652E-02    ( -0.00318052   0.0197409 )
------------------------------------------------------------
#Fit statistic : Chi-Squared =          42.53 using 59 PHA bins.
# Reduced chi-squared =         0.7595 for     56 degrees of freedom
# Null hypothesis probability =   9.077863e-01

Photon flux (15-150 keV)    in 1 sec: 6.34575 ( -0.36592  0.36612 ) ph/cm2/s
Energy fluence (15-150 keV)             : 6.35518e-07 ( -4.0269e-08  3.9919e-08 ) ergs/cm2
Band function
Time interval is from    0.372 sec. to    1.372 sec.

Spectral model in the Band function:
------------------------------------------------------------
Parameters  : value       lower 90%   higher 90%
alpha       : -0.818954   ( 0.818954   0.818954 )
beta        : -0.841386    ( -0.106028   0.107788 )
Epeak [keV] : 18.9911      ( -18.9911 -18.9911 )
Norm@50keV   : 7.50436E-02    ( -0.0229259   0 )
------------------------------------------------------------
#Fit statistic : Chi-Squared =          42.51 using 59 PHA bins.
# Reduced chi-squared =         0.7729 for     55 degrees of freedom
# Null hypothesis probability =   8.907059e-01

Photon flux (15-150 keV)    in 1 sec:  (    ) ph/cm2/s
Energy fluence (15-150 keV)             : 0 ( 0  0 ) ergs/cm2
Single BB
Spectral model blackbody:
------------------------------------------------------------
Parameters  : value    Lower 90%  Upper 90%
kT [keV]    : 25.8685  (-2.1768  2.48539)
R^2/D10^2   : 0.143326  (-0.0335162   0.0423557)
(R is the radius in km and D10 is the distance to the source in units of 10 kpc)
------------------------------------------------------------
#Fit statistic : Chi-Squared =          94.92 using 59 PHA bins.
# Reduced chi-squared =          1.665 for     57 degrees of freedom
# Null hypothesis probability =   1.204784e-03

Energy  Fluence     90% Error
[keV]   [erg/cm2]   [erg/cm2]
15- 25  1.636e-08   1.880e-09
25- 50  9.440e-08   9.030e-09
50-150  4.658e-07   4.185e-08
15-150  5.765e-07   4.570e-08
Thermal bremsstrahlung (OTTB)
Spectral model: thermal bremsstrahlung
------------------------------------------------------------
Parameters  : value         Lower 90%    Upper 90%
kT [keV]    : 199.363       (      )
Norm        : 24.7782       (     )
------------------------------------------------------------
#Fit statistic : Chi-Squared =         161.04 using 59 PHA bins.
# Reduced chi-squared =         2.8253 for     57 degrees of freedom
# Null hypothesis probability =   7.274630e-12

Energy  Fluence     90% Error
[keV]   [erg/cm2]   [erg/cm2]
15- 25  6.170e-08   4.065e-09
25- 50  1.187e-07   9.850e-09
50-150  2.603e-07   7.370e-08
15-150  4.407e-07   7.515e-08
Double BB

Spectral model: bbodyrad<1> + bbodyrad<2>
------------------------------------------------------------
Parameters  : value         Lower 90%    Upper 90%
kT1 [keV]   : 6.75204        (-2.00061      2.661)
R1^2/D10^2  : 4.50451        (-2.94438      12.7949)
kT2 [keV]   : 36.3943        (-5.72916      10.2939)
R2^2/D10^2  : 4.88363E-02    (-0.024746   0.0324291)
------------------------------------------------------------
#Fit statistic : Chi-Squared =          42.92 using 59 PHA bins.
# Reduced chi-squared =         0.7804 for     55 degrees of freedom
# Null hypothesis probability =   8.818034e-01

Energy  Fluence     90% Error
[keV]   [erg/cm2]   [erg/cm2]
15- 25  4.065e-08   1.729e-08
25- 50  9.956e-08   2.505e-08
50-150  5.058e-07   8.130e-08
15-150  6.460e-07   1.037e-07
Pre-slew spectrum (Pre-slew PHA with pre-slew DRM)
Power-law model
Spectral model in power-law:
------------------------------------------------------------
Parameters  : value       lower 90%   higher 90%
Photon index: 1.26002     ( -0.0629472   0.0626065 )
Norm@50keV  : 5.76054E-03    ( -0.000187752   0.000187631 )
------------------------------------------------------------
#Fit statistic : Chi-Squared =          51.84 using 59 PHA bins.
# Reduced chi-squared =         0.9096 for     57 degrees of freedom
# Null hypothesis probability =   6.683060e-01

Photon flux (15-150 keV)    in 132 sec: 0.682442 ( -0.0240124  0.0241092 ) ph/cm2/s
Energy fluence (15-150 keV)             : 7.59004e-06 ( -2.64434e-07  2.65283e-07 ) ergs/cm2
Cutoff power-law model
Spectral model in the cutoff power-law:
------------------------------------------------------------
Parameters  : value       lower 90%   higher 90%
Photon index: 1.25585     ( -0.208845   0.0675428 )
Epeak [keV] : 1.00000E+04      (   )
Norm@50keV  : 5.78579E-03    ( -0.000187613   0.000187478 )
------------------------------------------------------------
#Fit statistic : Chi-Squared =          51.87 using 59 PHA bins.
# Reduced chi-squared =         0.9262 for     56 degrees of freedom
# Null hypothesis probability =   6.319265e-01

Photon flux (15-150 keV)    in 132 sec: 0.682417 (    ) ph/cm2/s
Energy fluence (15-150 keV)             : 7.58773e-06 ( -2.55222e-07  2.68488e-07 ) ergs/cm2
Band function
Spectral model in the Band function:
------------------------------------------------------------
Parameters  : value       lower 90%   higher 90%
alpha       : -5.70193E-03   ( -2.5722   -2.5722 )
beta        : -1.28347    ( -0.0667731   0.0663616 )
Epeak [keV] : 43.1205      ( -43.1097 107.704 )
Norm@50keV   : 4.44454E-02    ( -0.0447656   236.264 )
------------------------------------------------------------
#Fit statistic : Chi-Squared =          50.72 using 59 PHA bins.
# Reduced chi-squared =         0.9223 for     55 degrees of freedom
# Null hypothesis probability =   6.386066e-01

Photon flux (15-150 keV)    in 132 sec:  (    ) ph/cm2/s
Energy fluence (15-150 keV)             : 0 ( 0  0 ) ergs/cm2
S(25-50 keV) vs. S(50-100 keV) plot

S(25-50 keV)  = 1.90e-06
S(50-100 keV) = 3.01e-06
T90 vs. Hardness ratio plot
T90                                   = 148.387999981642 sec.
Hardness ratio (energy fluence ratio) = 1.58421
Color vs. Color plot
Count Ratio  (25-50 keV) / (15-25 keV) = 1.59863
Count Ratio (50-100 keV) / (15-25 keV) = 1.37973
Mask shadow pattern
IMX = 3.286278128282195E-01, IMY = -5.241649970967113E-01
TIME vs. PHA plot around the trigger time

Blue+Cyan dotted lines: Time interval of the scaled map
From 0.000000 to 1.024000
TIME vs. DetID plot around the trigger time

Blue+Cyan dotted lines: Time interval of the scaled map
From 0.000000 to 1.024000
100 us light curve (15-350 keV)

Blue+Cyan dotted lines: Time interval of the scaled map
From 0.000000 to 1.024000
Spacecraft aspect plot
Bright source in the pre-burst/pre-slew/post-slew images
Pre-burst image of 15-350 keV band
Time interval of the image:
-239.280000 -7.568000

# RAcent  DECcent POSerr Theta    Phi  PeakCts   SNR AngSep     Name
#  [deg]    [deg]    ['] [deg]  [deg]                   [']
244.9885 -15.6428    0.6  32.9  -92.6   6.8446  20.5    0.5	Sco X-1
254.4898  35.3393    6.2  51.2  -15.2   0.8476   1.9    1.6	Her X-1
255.8180 -37.8883   22.1  34.0 -137.3   0.1310   0.5    8.4	4U 1700-377
256.6218 -36.5322    3.8  32.6 -136.5   0.6937   3.0   11.1	GX 349+2
262.9904 -24.6447    3.2  20.3 -126.1   0.6867   3.7    6.1	GX 1+4
264.7656 -44.3055   11.3  35.7 -153.4   0.2221   1.0    8.7	4U 1735-44
268.4158  -1.3509    2.1  13.5  -37.8   0.9932   5.6    6.7	SW J1753.5-0127
270.2580 -25.1451    2.6  16.5 -143.4   0.7844   4.5    4.2	GX 5-1
270.4776 -25.8119    5.1  17.0 -145.1   0.4039   2.3   10.3	GRS 1758-258
273.9420 -14.0574    2.3   5.6 -119.5   0.8537   5.0    3.9	GX 17+2
275.8839 -30.4335    4.6  20.0 -163.8   0.4372   2.5    4.5	H1820-303
284.8814 -24.9534    6.7  15.7  167.5   0.2817   1.7    8.6	HT1900.1-2455
288.8041  10.9495    1.1  23.9   35.9   2.0128  10.1    0.4	GRS 1915+105
263.0334 -33.8380    2.8  27.2 -141.4   0.8468   4.1    2.2	GX 354-0
283.5865 -24.5195    3.0  14.8  171.0   0.6251   3.9 ------	UNKNOWN
282.4781 -42.4426    2.4  32.1 -175.8   1.0323   4.9 ------	UNKNOWN
267.8185  30.5885    2.7  42.4   -3.7   1.3208   4.3 ------	UNKNOWN
270.4332 -20.4853    2.7  12.5 -133.5   0.7611   4.3 ------	UNKNOWN
252.5306  41.7940    2.7  57.5  -12.8   3.9691   4.3 ------	UNKNOWN
258.5012 -66.1998    2.3  57.3 -160.7   4.6951   4.9 ------	UNKNOWN
236.6418   5.9591    2.8  44.7  -60.3   3.0598   4.1 ------	UNKNOWN
Pre-slew background subtracted image of 15-350 keV band
Time interval of the image:
-7.568000 124.420590

# RAcent  DECcent POSerr Theta    Phi  PeakCts   SNR AngSep     Name
#  [deg]    [deg]    ['] [deg]  [deg]                   [']
245.1355 -15.7623   56.0  32.7  -92.9  -0.0566  -0.2   11.6	Sco X-1
254.3572  35.4682    8.6  51.3  -15.2  -0.5513  -1.3    9.0	Her X-1
255.9461 -37.9695   14.9  34.0 -137.6  -0.1619  -0.8    7.8	4U 1700-377
256.3831 -36.4775   18.1  32.7 -136.2   0.1311   0.6    4.1	GX 349+2
263.0091 -24.7458   37.6  20.4 -126.3   0.0527   0.3    0.0	GX 1+4
264.5663 -44.4712   20.5  35.9 -153.2  -0.1172  -0.6    7.7	4U 1735-44
268.3300  -1.5239   10.0  13.5  -38.6   0.1931   1.1    4.8	SW J1753.5-0127
270.2859 -25.2277    8.5  16.6 -143.6   0.2280   1.4    8.9	GX 5-1
270.2189 -25.8998    5.3  17.2 -144.5   0.3719   2.2   10.4	GRS 1758-258
273.9413 -13.8949    4.0   5.5 -118.1   0.4422   2.9    9.3	GX 17+2
275.8502 -30.4935    3.8  20.1 -163.8  -0.5033  -3.1    8.5	H1820-303
285.0460 -24.7996    7.3  15.6  166.8   0.2617   1.6    7.3	HT1900.1-2455
288.7504  10.9245    5.1  23.8   35.8   0.4282   2.3    3.1	GRS 1915+105
262.8767 -33.7923    6.9  27.2 -141.1  -0.2947  -1.7    6.2	GX 354-0
301.8580  10.9546    0.3  31.7   57.9  11.4253  36.5 ------	UNKNOWN
293.4995  33.5633    2.4  46.4   27.3   2.5786   4.8 ------	UNKNOWN
262.1638  32.8993    2.8  46.1   -9.1   1.1913   4.1 ------	UNKNOWN
273.6470 -61.2439    2.7  50.8 -167.2   1.5741   4.2 ------	UNKNOWN
262.7278 -63.4969    2.5  54.1 -161.6   2.1166   4.6 ------	UNKNOWN
247.4020  27.3032    2.6  48.3  -27.9   1.5949   4.3 ------	UNKNOWN
236.8574 -25.5810    3.7  42.0 -106.8   2.4369   3.8 ------	UNKNOWN
	UNKNOWN
Post-slew image of 15-350 keV band
Time interval of the image:
161.820600 723.220590

# RAcent  DECcent POSerr Theta    Phi  PeakCts   SNR AngSep     Name
#  [deg]    [deg]    ['] [deg]  [deg]                   [']
255.9015 -37.9522   11.7  44.7 -121.9   1.4416   1.0    7.6	4U 1700-377
256.4540 -36.3769    6.8  43.6 -120.2   2.2267   1.7    2.9	GX 349+2
262.9857 -24.7073   10.4  33.7 -106.7   0.6716   1.1    2.6	GX 1+4
264.9576 -44.6119    0.0  43.1 -135.4  -1.4286  -1.9   13.4	4U 1735-44
268.2524  -1.4687    2.5  27.9  -60.6   1.8913   4.6    7.0	SW J1753.5-0127
270.2523 -25.1472    2.5  27.9 -112.8   2.0824   4.7    4.4	GX 5-1
270.2284 -25.6854    9.4  28.1 -113.8   0.5809   1.3    5.3	GRS 1758-258
274.0069 -13.9917    1.5  20.8  -89.7   3.0223   7.8    2.7	GX 17+2
275.9245 -30.3236    4.5  26.9 -128.4   1.0755   2.6    2.6	H1820-303
284.9370 -24.9669    5.6  17.7 -135.5   0.7100   2.1    6.1	HT1900.1-2455
288.8246  10.9353    0.8  21.9   -3.2   5.3812  15.2    1.7	GRS 1915+105
299.5929  35.2080    0.4  45.5   18.5  24.4007  28.3    0.4	Cyg X-1
262.9962 -33.8020    4.0  37.7 -120.8   1.8801   2.9    2.0	GX 354-0
281.4515  11.2998    2.3  25.2  -19.3   1.7058   5.1 ------	UNKNOWN
277.3797 -23.8045    1.6  21.7 -118.4   2.3997   7.1 ------	UNKNOWN
Plot creation:
Sun May 31 09:09:44 EDT 2015