Special notes of this burst
Image
Pre-slew 15.0-350.0 keV image (Event data)
# RAcent DECcent POSerr Theta Phi Peak Cts SNR Name
150.5326 45.7345 0.0024 29.0366 -10.8583 8.5071341 81.264 TRIG_00293795
Foreground time interval of the image:
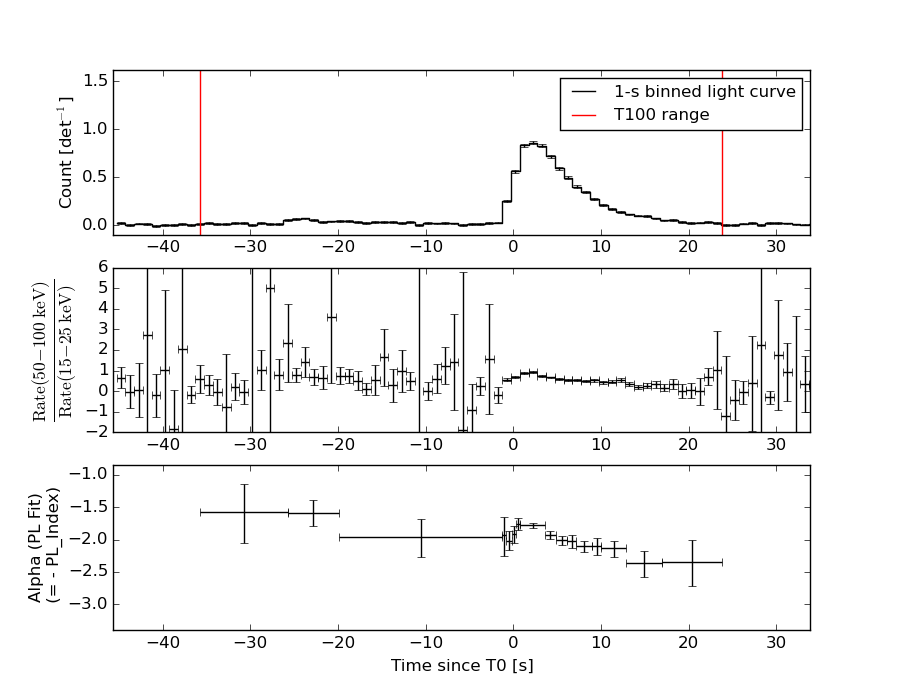
-35.740 23.828 (delta_t = 59.568 [sec])
Background time interval of the image:
-239.272 -35.740 (delta_t = 203.532 [sec])
Lightcurves
Notes:
- 1) The mask-weighted light curves are using the flight position.
- 2) Multiple plots of different time binning/intervals are shown to cover all scenarios of short/long GRBs, rate/image triggers, and real/false positives.
- 3) For all the mask-weighted lightcurves, the y-axis units are counts/sec/det where a det is 0.4 x 0.4 = 0.16 sq cm.
- 4) The verticle lines correspond to following: green dotted lines are T50 interval, black dotted lines are T90 interval, blue solid line(s) is a spacecraft slew start time, and orange solid line(s) is a spacecraft slew end time.
- 5) Time of each bin is in the middle of the bin.
1 s binning
From T0-310 s to T0+310 s

From T100_start - 20 s to T100_end + 30 s
Full time interval

64 ms binning
Full time interval

From T100_start to T100_end
From T0-5 sec to T0+5 sec
16 ms binning
From T100_start-5 s to T100_start+5 s

Blue+Cyan dotted lines: Time interval of the scaled map
From 0.000000 to 0.512000
8 ms binning
From T100_start-3 s to T100_start+3 s

Blue+Cyan dotted lines: Time interval of the scaled map
From 0.000000 to 0.512000
2 ms binning
From T100_start-1 s to T100_start+1 s

Blue+Cyan dotted lines: Time interval of the scaled map
From 0.000000 to 0.512000
SN=5 or 10 sec. binning (whichever binning is satisfied first)
SN=5 or 10 sec. binning (T < 200 sec)
Quad-rate summed light curves (from T0-300s to T0+1000s)

Spectral Evolution
Spectra
Notes:
- 1) The fitting includes the systematic errors.
- 2) When the burst includes telescope slew time periods, the fitting uses an average response file made from multiple 5-s response files through out the slew time plus single time preiod for the non-slew times, and weighted by the total counts in the corresponding time period using addrmf. An average response file is needed becuase a spectral fit using the pre-slew DRM will introduce some errors in both a spectral shape and a normalization if the PHA file contains a lot of the slew/post-slew time interval.
- 3) For fits to more complicated models (e.g. a power-law over a cutoff power-law), the BAT team has decided to require a chi-square improvement of more than 6 for each extra dof.
Time averaged spectrum fit using the average DRM
Power-law model
Time interval is from  -35.740 sec. to   23.828 sec.

Spectral model in power-law:
------------------------------------------------------------
Parameters  : value       lower 90%   higher 90%
Photon index: 1.96623     ( -0.04345   0.0436488 )
Norm@50keV  : 8.41959E-03    ( -0.000188963   0.00018875 )
------------------------------------------------------------
#Fit statistic : Chi-Squared =          58.90 using 59 PHA bins.
# Reduced chi-squared =          1.033 for     57 degrees of freedom
# Null hypothesis probability =   4.057364e-01

Photon flux (15-150 keV)    in 59.57 sec: 1.24373 ( -0.0323732  0.0325453 ) ph/cm2/s
Energy fluence (15-150 keV)             : 4.61821e-06 ( -1.02077e-07  1.02114e-07 ) ergs/cm2
Cutoff power-law model

Time interval is from  -35.740 sec. to   23.828 sec.
Spectral model in the cutoff power-law:
------------------------------------------------------------
Parameters  : value       lower 90%   higher 90%
Photon index: 1.52011     ( -0.195191   0.186976 )
Epeak [keV] : 54.7823      ( -5.51245 7.23816 )
Norm@50keV  : 1.38248E-02    ( -0.00254094   0.00328225 )
------------------------------------------------------------
#Fit statistic : Chi-Squared =          41.44 using 59 PHA bins.
# Reduced chi-squared =         0.7400 for     56 degrees of freedom
# Null hypothesis probability =   9.268449e-01

Photon flux (15-150 keV)    in 59.57 sec: 1.19262 ( -0.0376  0.03792 ) ph/cm2/s
Energy fluence (15-150 keV)             : 4.45062e-06 ( -1.22833e-07  1.22524e-07 ) ergs/cm2
Band function
Time interval is from  -35.740 sec. to   23.828 sec.

Spectral model in the Band function:
------------------------------------------------------------
Parameters  : value       lower 90%   higher 90%
alpha       : -1.14476   ( -0.43215   1.11691 )
beta        : -2.17804    ( -0.496365   0.123757 )
Epeak [keV] : 45.2480      ( -10.9203 10.9732 )
Norm@50keV   : 2.30665E-02    ( -0.00995066   0.105755 )
------------------------------------------------------------
#Fit statistic : Chi-Squared =          38.55 using 59 PHA bins.
# Reduced chi-squared =         0.7008 for     55 degrees of freedom
# Null hypothesis probability =   9.549298e-01

Photon flux (15-150 keV)    in 59.57 sec:  (    ) ph/cm2/s
Energy fluence (15-150 keV)             : 4.44038e-06 ( -4.43997e-06  -1.19408e-07 ) ergs/cm2
Single BB

Spectral model blackbody:
------------------------------------------------------------
Parameters  : value    Lower 90%  Upper 90%
kT [keV]    : 12.8728  (  )
R^2/D10^2   : 0.205498  (   )
(R is the radius in km and D10 is the distance to the source in units of 10 kpc)
------------------------------------------------------------
#Fit statistic : Chi-Squared =         415.83 using 59 PHA bins.
# Reduced chi-squared =         7.2952 for     57 degrees of freedom
# Null hypothesis probability =   5.602356e-56

Energy  Fluence     90% Error
[keV]   [erg/cm2]   [erg/cm2]
15- 25  4.303e-07   1.844e-08
25- 50  1.466e-06   3.842e-08
50-150  1.527e-06   7.059e-08
15-150  3.424e-06   8.102e-08
Thermal bremsstrahlung (OTTB)

Spectral model: thermal bremsstrahlung
------------------------------------------------------------
Parameters  : value         Lower 90%    Upper 90%
kT [keV]    : 85.3547       (-6.19663      7.00643)
Norm        : 5.49062       (-0.216255     0.227027)
------------------------------------------------------------
#Fit statistic : Chi-Squared =          44.32 using 59 PHA bins.
# Reduced chi-squared =         0.7776 for     57 degrees of freedom
# Null hypothesis probability =   8.897934e-01

Energy  Fluence     90% Error
[keV]   [erg/cm2]   [erg/cm2]
15- 25  8.517e-07   3.098e-08
25- 50  1.424e-06   3.544e-08
50-150  2.097e-06   8.906e-08
15-150  4.372e-06   1.066e-07
Double BB

Spectral model: bbodyrad<1> + bbodyrad<2>
------------------------------------------------------------
Parameters  : value         Lower 90%    Upper 90%
kT1 [keV]   : 7.11963        (-0.57542      0.593073)
R1^2/D10^2  : 1.36737        (-0.330361      0.483555)
kT2 [keV]   : 22.8830        (-2.00195      2.54451)
R2^2/D10^2  : 1.62205E-02    (-0.00564941   0.00757369)
------------------------------------------------------------
#Fit statistic : Chi-Squared =          51.03 using 59 PHA bins.
# Reduced chi-squared =         0.9278 for     55 degrees of freedom
# Null hypothesis probability =   6.271297e-01

Energy  Fluence     90% Error
[keV]   [erg/cm2]   [erg/cm2]
15- 25  7.667e-07   6.046e-08
25- 50  1.452e-06   6.731e-08
50-150  2.113e-06   1.516e-07
15-150  4.332e-06   2.022e-07
Peak spectrum fit
Power-law model

Time interval is from    1.396 sec. to    2.396 sec.

Spectral model in power-law:
------------------------------------------------------------
Parameters  : value       lower 90%   higher 90%
Photon index: 1.73527     ( -0.0576373   0.0580533 )
Norm@50keV  : 5.71272E-02    ( -0.00193658   0.00193321 )
------------------------------------------------------------
#Fit statistic : Chi-Squared =          86.28 using 59 PHA bins.
# Reduced chi-squared =          1.514 for     57 degrees of freedom
# Null hypothesis probability =   7.402267e-03

Photon flux (15-150 keV)    in 1 sec: 7.68303 ( -0.270055  0.270606 ) ph/cm2/s
Energy fluence (15-150 keV)             : 5.27603e-07 ( -1.84246e-08  1.84578e-08 ) ergs/cm2
Cutoff power-law model
Time interval is from    1.396 sec. to    2.396 sec.
Spectral model in the cutoff power-law:
------------------------------------------------------------
Parameters  : value       lower 90%   higher 90%
Photon index: 1.00081     ( -0.274932   0.258952 )
Epeak [keV] : 68.5324      ( -6.98412 11.7319 )
Norm@50keV  : 0.132532    ( -0.0333663   0.048133 )
------------------------------------------------------------
#Fit statistic : Chi-Squared =          60.40 using 59 PHA bins.
# Reduced chi-squared =          1.078 for     56 degrees of freedom
# Null hypothesis probability =   3.200344e-01

Photon flux (15-150 keV)    in 1 sec: 7.37147 ( -0.28699  0.28789 ) ph/cm2/s
Energy fluence (15-150 keV)             : 5.03536e-07 ( -2.0364e-08  2.0337e-08 ) ergs/cm2
Band function
Time interval is from    1.396 sec. to    2.396 sec.

Spectral model in the Band function:
------------------------------------------------------------
Parameters  : value       lower 90%   higher 90%
alpha       : -0.489912   ( -0.583656   1.19025 )
beta        : -2.11168    ( -0.876065   0.187178 )
Epeak [keV] : 52.6974      ( -13.3973 17.6262 )
Norm@50keV   : 0.269481    ( -0.141884   1.39242 )
------------------------------------------------------------
#Fit statistic : Chi-Squared =          57.60 using 59 PHA bins.
# Reduced chi-squared =          1.047 for     55 degrees of freedom
# Null hypothesis probability =   3.793566e-01

Photon flux (15-150 keV)    in 1 sec: 7.30065 ( -0.30065  -0.29443 ) ph/cm2/s
Energy fluence (15-150 keV)             : 5.04807e-07 ( -5.048e-07  -1.9834e-08 ) ergs/cm2
Single BB

Spectral model blackbody:
------------------------------------------------------------
Parameters  : value    Lower 90%  Upper 90%
kT [keV]    : 13.6249  (  )
R^2/D10^2   : 1.16985  (   )
(R is the radius in km and D10 is the distance to the source in units of 10 kpc)
------------------------------------------------------------
#Fit statistic : Chi-Squared =         202.06 using 59 PHA bins.
# Reduced chi-squared =         3.5449 for     57 degrees of freedom
# Null hypothesis probability =   4.196448e-18

Energy  Fluence     90% Error
[keV]   [erg/cm2]   [erg/cm2]
15- 25  4.597e-08   2.985e-09
25- 50  1.664e-07   6.850e-09
50-150  2.005e-07   1.395e-08
15-150  4.128e-07   1.565e-08
Thermal bremsstrahlung (OTTB)
Spectral model: thermal bremsstrahlung
------------------------------------------------------------
Parameters  : value         Lower 90%    Upper 90%
kT [keV]    : 128.353       (-18.3927      18.1953)
Norm        : 31.9792       (-1.33341     1.69831)
------------------------------------------------------------
#Fit statistic : Chi-Squared =          63.74 using 59 PHA bins.
# Reduced chi-squared =          1.118 for     57 degrees of freedom
# Null hypothesis probability =   2.514801e-01

Energy  Fluence     90% Error
[keV]   [erg/cm2]   [erg/cm2]
15- 25  8.303e-08   5.495e-09
25- 50  1.502e-07   8.000e-09
50-150  2.769e-07   6.415e-08
15-150  5.102e-07   6.855e-08
Double BB
Spectral model: bbodyrad<1> + bbodyrad<2>
------------------------------------------------------------
Parameters  : value         Lower 90%    Upper 90%
kT1 [keV]   : 7.92069        (-0.970464      0.988824)
R1^2/D10^2  : 5.46449        (-1.62029      2.73859)
kT2 [keV]   : 24.4400        (-3.18968      4.7291)
R2^2/D10^2  : 9.26961E-02    (-0.0469949   0.0739081)
------------------------------------------------------------
#Fit statistic : Chi-Squared =          60.49 using 59 PHA bins.
# Reduced chi-squared =          1.100 for     55 degrees of freedom
# Null hypothesis probability =   2.842175e-01

Energy  Fluence     90% Error
[keV]   [erg/cm2]   [erg/cm2]
15- 25  7.126e-08   7.540e-09
25- 50  1.604e-07   1.320e-08
50-150  2.693e-07   4.530e-08
15-150  5.010e-07   5.865e-08
Pre-slew spectrum (Pre-slew PHA with pre-slew DRM)
Power-law model

Spectral model in power-law:
------------------------------------------------------------
Parameters  : value       lower 90%   higher 90%
Photon index: 1.96623     ( -0.04345   0.0436488 )
Norm@50keV  : 8.41959E-03    ( -0.000188963   0.00018875 )
------------------------------------------------------------
#Fit statistic : Chi-Squared =          58.90 using 59 PHA bins.
# Reduced chi-squared =          1.033 for     57 degrees of freedom
# Null hypothesis probability =   4.057364e-01

Photon flux (15-150 keV)    in 59.57 sec: 1.24373 ( -0.0323732  0.0325453 ) ph/cm2/s
Energy fluence (15-150 keV)             : 4.61821e-06 ( -1.02077e-07  1.02114e-07 ) ergs/cm2
Cutoff power-law model

Spectral model in the cutoff power-law:
------------------------------------------------------------
Parameters  : value       lower 90%   higher 90%
Photon index: 1.52011     ( -0.195191   0.186976 )
Epeak [keV] : 54.7823      ( -5.51245 7.23816 )
Norm@50keV  : 1.38248E-02    ( -0.00254094   0.00328225 )
------------------------------------------------------------
#Fit statistic : Chi-Squared =          41.44 using 59 PHA bins.
# Reduced chi-squared =         0.7400 for     56 degrees of freedom
# Null hypothesis probability =   9.268449e-01

Photon flux (15-150 keV)    in 59.57 sec: 1.19262 ( -0.0376  0.03792 ) ph/cm2/s
Energy fluence (15-150 keV)             : 4.45062e-06 ( -1.22833e-07  1.22524e-07 ) ergs/cm2
Band function

Spectral model in the Band function:
------------------------------------------------------------
Parameters  : value       lower 90%   higher 90%
alpha       : -1.14476   ( -0.43215   1.11691 )
beta        : -2.17804    ( -0.496365   0.123757 )
Epeak [keV] : 45.2480      ( -10.9203 10.9732 )
Norm@50keV   : 2.30665E-02    ( -0.00995066   0.105755 )
------------------------------------------------------------
#Fit statistic : Chi-Squared =          38.55 using 59 PHA bins.
# Reduced chi-squared =         0.7008 for     55 degrees of freedom
# Null hypothesis probability =   9.549298e-01

Photon flux (15-150 keV)    in 59.57 sec:  (    ) ph/cm2/s
Energy fluence (15-150 keV)             : 4.44038e-06 ( -4.43997e-06  -1.19408e-07 ) ergs/cm2
S(25-50 keV) vs. S(50-100 keV) plot

S(25-50 keV)  = 1.38e-06
S(50-100 keV) = 1.41e-06
T90 vs. Hardness ratio plot
T90                                   = 36.1240000128746 sec.
Hardness ratio (energy fluence ratio) = 1.02174
Color vs. Color plot

Count Ratio  (25-50 keV) / (15-25 keV) = 1.16859
Count Ratio (50-100 keV) / (15-25 keV) = 0.638325
Mask shadow pattern

IMX = 5.452047759902531E-01, IMY = 1.045785973572260E-01
TIME vs. PHA plot around the trigger time

Blue+Cyan dotted lines: Time interval of the scaled map
From 0.000000 to 0.512000
TIME vs. DetID plot around the trigger time

Blue+Cyan dotted lines: Time interval of the scaled map
From 0.000000 to 0.512000
100 us light curve (15-350 keV)
Blue+Cyan dotted lines: Time interval of the scaled map
From 0.000000 to 0.512000
Spacecraft aspect plot

Bright source in the pre-burst/pre-slew/post-slew images
Pre-burst image of 15-350 keV band
Time interval of the image:
-239.272000 -35.740000

# RAcent  DECcent POSerr Theta    Phi  PeakCts   SNR AngSep     Name
#  [deg]    [deg]    ['] [deg]  [deg]                   [']
254.4131  35.4883  347.2  48.1 -158.1  -0.0095  -0.0    9.0	Her X-1
143.0678  24.3775    2.7  50.9  -16.8   1.2866   4.3 ------	UNKNOWN
253.9330  35.9569    2.4  47.5 -158.0   1.2999   4.7 ------	UNKNOWN
186.1344  24.2859    2.2  42.3  -70.4   3.0985   5.4 ------	UNKNOWN
195.5676  25.7410    3.6  41.0  -83.3   1.9959   3.2 ------	UNKNOWN
Pre-slew background subtracted image of 15-350 keV band
Time interval of the image:
-35.740000 23.828000

# RAcent  DECcent POSerr Theta    Phi  PeakCts   SNR AngSep     Name
#  [deg]    [deg]    ['] [deg]  [deg]                   [']
254.3629  35.4682    9.3  48.1 -158.1  -0.2547  -1.2    8.9	Her X-1
 50.7364  70.5900    2.2  39.9   85.5   2.0522   5.3 ------	UNKNOWN
150.5326  45.7345    0.1  29.0  -10.9   8.5072  81.3 ------	UNKNOWN
Post-slew image of 15-350 keV band
Time interval of the image:
144.028620 610.428620

# RAcent  DECcent POSerr Theta    Phi  PeakCts   SNR AngSep     Name
#  [deg]    [deg]    ['] [deg]  [deg]                   [']
244.9917 -15.6360    0.8  51.0 -140.9  15.8387  13.8    0.8	Sco X-1
254.3734  35.1856    5.9  11.9  131.1   0.4327   1.9   10.3	Her X-1
268.2933  -1.5287    5.1  45.3 -176.6   1.0487   2.2    6.4	SW J1753.5-0127
288.7950  10.9330    2.4  50.5  151.8   5.7313   4.7    0.8	GRS 1915+105
242.6181  81.5093    3.0  46.4   46.2   4.1810   3.8 ------	UNKNOWN
221.5690  15.0704    3.3  25.9  -90.6   1.1675   3.5 ------	UNKNOWN
Plot creation:
Sun May 31 09:03:16 EDT 2015