Click here for the BAT GCN circular template
Image
Pre-slew 15.0-350.0 keV image (Event data)
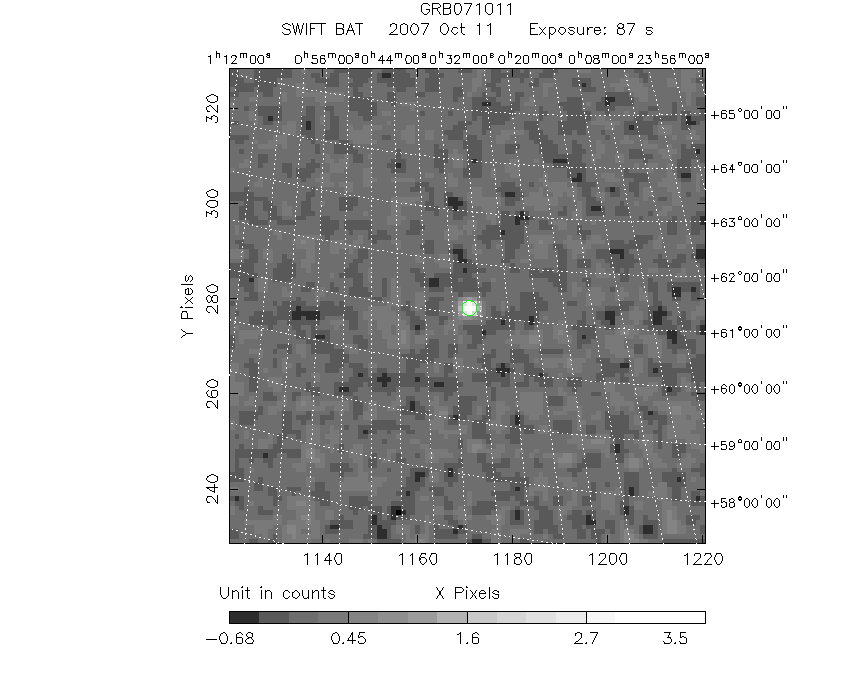
#   RAcent    DECcent   POSerr    Theta     Phi              Peak Cts       SNR   Name
    8.3922    61.1334   0.0091    36.5268   145.7169         3.9627253     21.161 TRIG_00293924

Foreground time interval of the image:
 -9.472  77.652 (delta_t =  87.124 [sec])
Background time interval of the image:
-239.128  -9.472 (delta_t = 229.656 [sec])
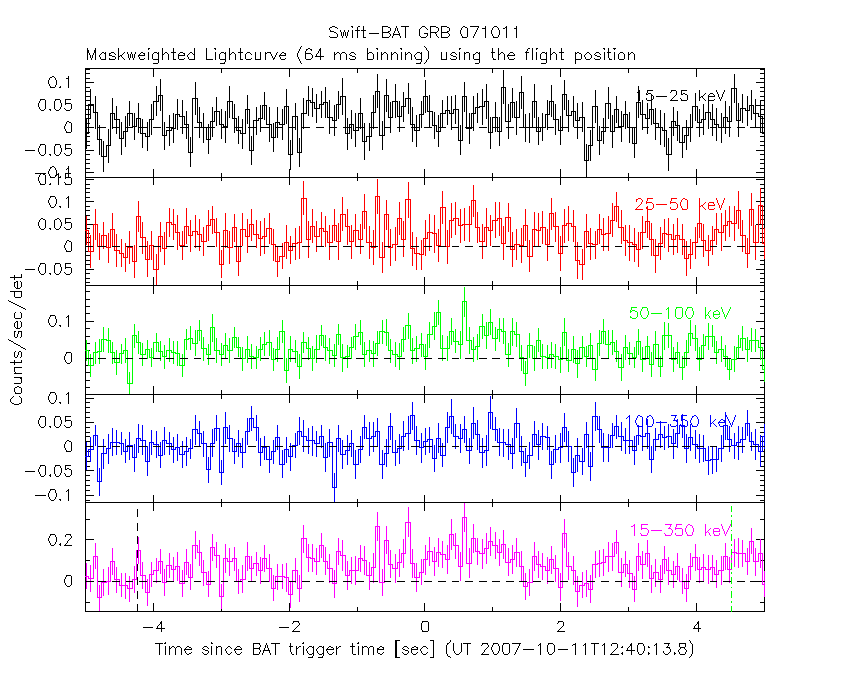
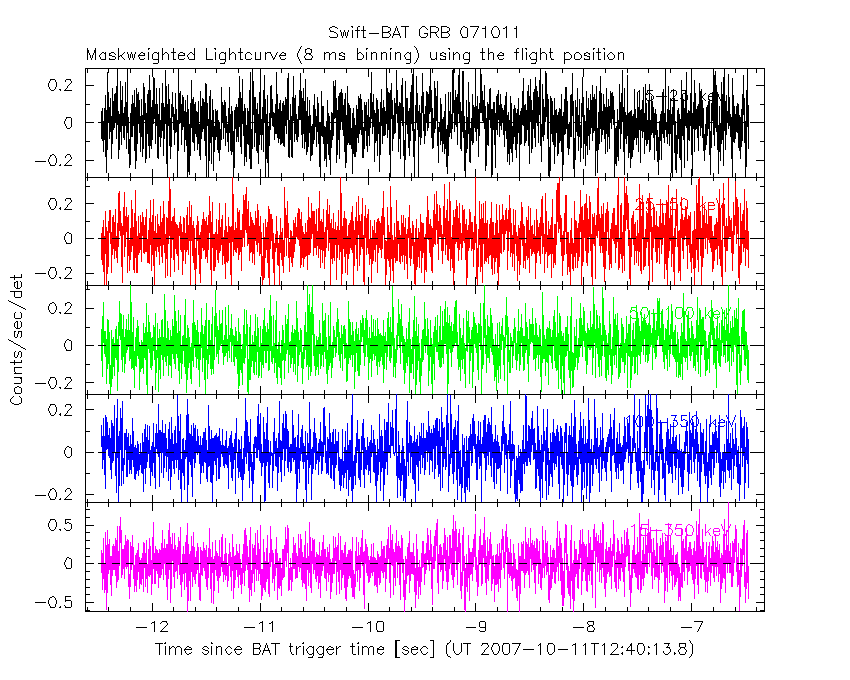
Lightcurves
Notes:
- 1) The mask-weighted light curves are using the flight position.
- 2) Multiple plots of different time binning/intervals are shown to cover all scenarios of short/long GRBs, rate/image triggers, and real/false positives.
- 3) For all the mask-weighted lightcurves, the y-axis units are counts/sec/det where a det is 0.4 x 0.4 = 0.16 sq cm.
- 4) The verticle lines correspond to following: green dotted lines are T50 interval, black dotted lines are T90 interval, blue solid line(s) is a spacecraft slew start time, and orange solid line(s) is a spacecraft slew end time.
- 5) Time of each bin is in the middle of the bin.
1 s binning
From T0-310 s to T0+310 s

From T100_start - 20 s to T100_end + 30 s
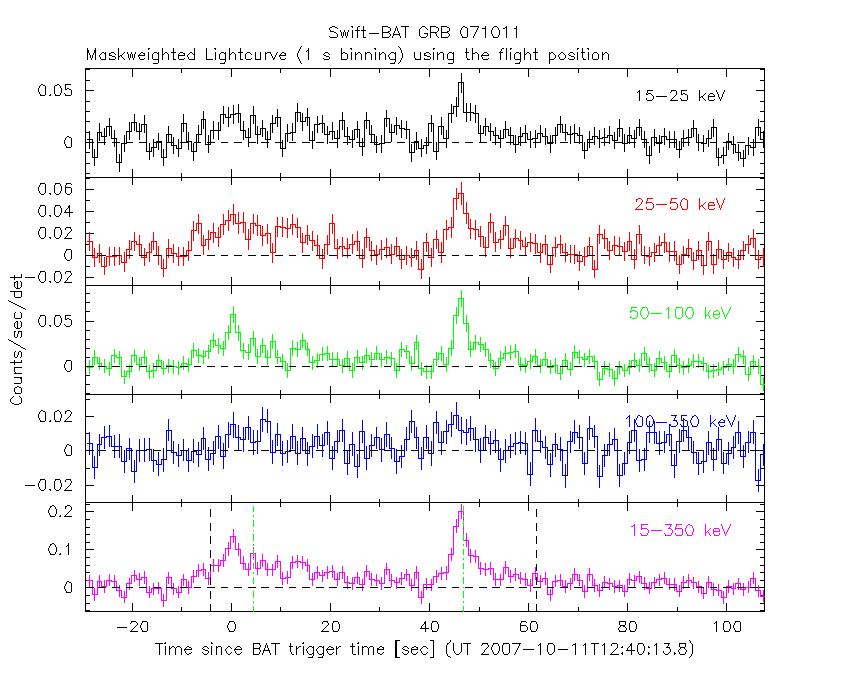
Full time interval

64 ms binning
Full time interval

From T100_start to T100_end

From T0-5 sec to T0+5 sec
16 ms binning
From T100_start-5 s to T100_start+5 s

Blue+Cyan dotted lines: Time interval of the scaled map
From 0.000000 to 1.024000
8 ms binning
From T100_start-3 s to T100_start+3 s
Blue+Cyan dotted lines: Time interval of the scaled map
From 0.000000 to 1.024000
2 ms binning
From T100_start-1 s to T100_start+1 s

Blue+Cyan dotted lines: Time interval of the scaled map
From 0.000000 to 1.024000
SN=5 or 10 sec. binning (whichever binning is satisfied first)

SN=5 or 10 sec. binning (T < 200 sec)

Quad-rate summed light curves (from T0-300s to T0+1000s)

Spectral Evolution

Spectra
Notes:
- 1) The fitting includes the systematic errors.
- 2) When the burst includes telescope slew time periods, the fitting uses an average response file made from multiple 5-s response files through out the slew time plus single time preiod for the non-slew times, and weighted by the total counts in the corresponding time period using addrmf. An average response file is needed becuase a spectral fit using the pre-slew DRM will introduce some errors in both a spectral shape and a normalization if the PHA file contains a lot of the slew/post-slew time interval.
- 3) For fits to more complicated models (e.g. a power-law over a cutoff power-law), the BAT team has decided to require a chi-square improvement of more than 6 for each extra dof.
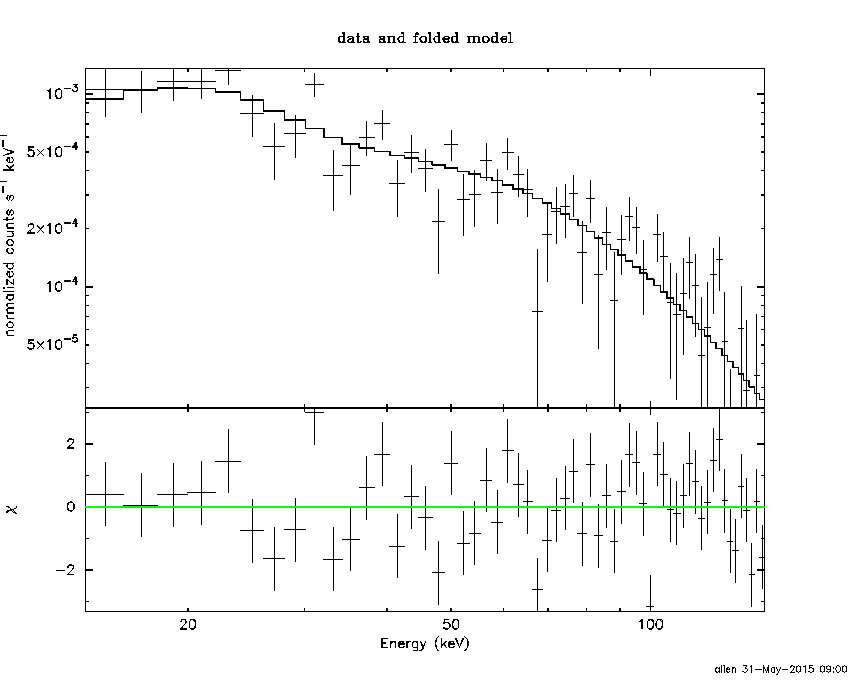
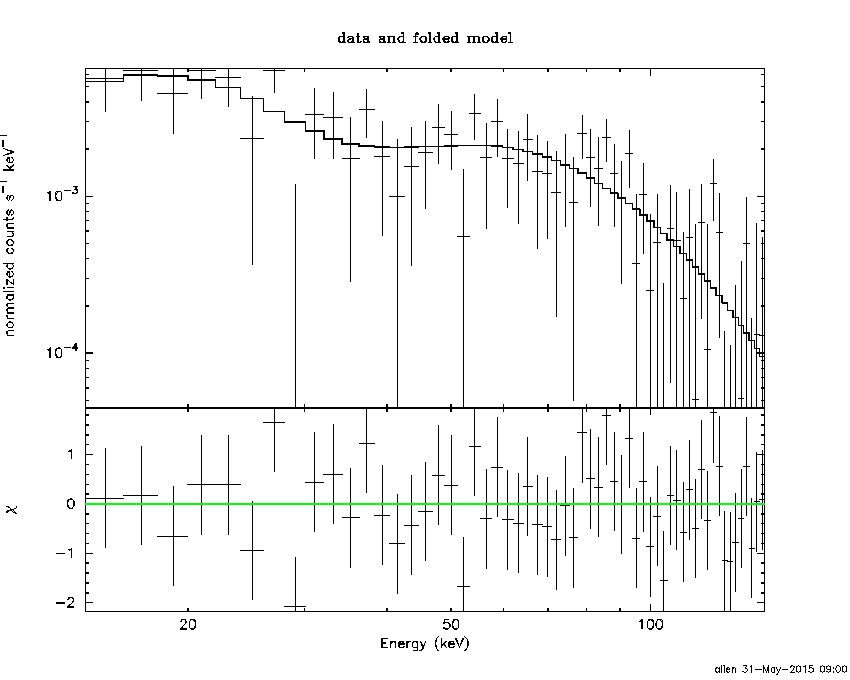
Time averaged spectrum fit using the average DRM
Power-law model

Time interval is from   -9.472 sec. to   77.652 sec.

Spectral model in power-law:
------------------------------------------------------------
Parameters  : value       lower 90%   higher 90%
Photon index: 1.44391     ( -0.125419   0.12546 )
Norm@50keV  : 2.82624E-03    ( -0.000190713   0.000190295 )
------------------------------------------------------------
#Fit statistic : Chi-Squared =          90.34 using 59 PHA bins.
# Reduced chi-squared =          1.585 for     57 degrees of freedom
# Null hypothesis probability =   3.238053e-03

Photon flux (15-150 keV)    in 87.12 sec: 0.347772 ( -0.0244656  0.0245796 ) ph/cm2/s
Energy fluence (15-150 keV)             : 2.35883e-06 ( -1.7401e-07  1.74825e-07 ) ergs/cm2
Cutoff power-law model

Time interval is from   -9.472 sec. to   77.652 sec.
Spectral model in the cutoff power-law:
------------------------------------------------------------
Parameters  : value       lower 90%   higher 90%
Photon index: 1.44161     ( -0.221781   0.12556 )
Epeak [keV] : 9999.36      ( -9999.36 -9999.36 )
Norm@50keV  : 2.83540E-03    ( -0.000191069   0.000896436 )
------------------------------------------------------------
#Fit statistic : Chi-Squared =          90.36 using 59 PHA bins.
# Reduced chi-squared =          1.614 for     56 degrees of freedom
# Null hypothesis probability =   2.466684e-03

Photon flux (15-150 keV)    in 87.12 sec: 0.348382 ( -0.025166  0.023924 ) ph/cm2/s
Energy fluence (15-150 keV)             : 2.35003e-06 ( -1.66007e-07  1.79729e-07 ) ergs/cm2
Band function
Time interval is from   -9.472 sec. to   77.652 sec.

Spectral model in the Band function:
------------------------------------------------------------
Parameters  : value       lower 90%   higher 90%
alpha       : -1.14862   ( 1.1496   6.14526 )
beta        : -1.44388    ( -0.127393   0.125426 )
Epeak [keV] : 36.7667      ( -36.1209 -36.1209 )
Norm@50keV   : 5.68411E-03    ( -0.00226641   0.404298 )
------------------------------------------------------------
#Fit statistic : Chi-Squared =          90.34 using 59 PHA bins.
# Reduced chi-squared =          1.643 for     55 degrees of freedom
# Null hypothesis probability =   1.881036e-03

Photon flux (15-150 keV)    in 87.12 sec:  (    ) ph/cm2/s
Energy fluence (15-150 keV)             : 0 ( 0  0 ) ergs/cm2
Single BB
Spectral model blackbody:
------------------------------------------------------------
Parameters  : value    Lower 90%  Upper 90%
kT [keV]    : 17.1499  (  )
R^2/D10^2   : 2.41118E-02  (   )
(R is the radius in km and D10 is the distance to the source in units of 10 kpc)
------------------------------------------------------------
#Fit statistic : Chi-Squared =         165.51 using 59 PHA bins.
# Reduced chi-squared =         2.9037 for     57 degrees of freedom
# Null hypothesis probability =   1.628886e-12

Energy  Fluence     90% Error
[keV]   [erg/cm2]   [erg/cm2]
15- 25  1.255e-07   1.925e-08
25- 50  5.593e-07   5.445e-08
50-150  1.178e-06   1.494e-07
15-150  1.862e-06   1.642e-07
Thermal bremsstrahlung (OTTB)
Spectral model: thermal bremsstrahlung
------------------------------------------------------------
Parameters  : value         Lower 90%    Upper 90%
kT [keV]    : 200.000       (      )
Norm        : 1.43121       (-0.096207     0.0961985)
------------------------------------------------------------
#Fit statistic : Chi-Squared =          96.64 using 59 PHA bins.
# Reduced chi-squared =          1.695 for     57 degrees of freedom
# Null hypothesis probability =   8.177174e-04

Energy  Fluence     90% Error
[keV]   [erg/cm2]   [erg/cm2]
15- 25  3.105e-07   2.509e-08
25- 50  5.973e-07   4.883e-08
50-150  1.310e-06   2.912e-07
15-150  2.218e-06   4.831e-07
Double BB

Spectral model: bbodyrad<1> + bbodyrad<2>
------------------------------------------------------------
Parameters  : value         Lower 90%    Upper 90%
kT1 [keV]   : 6.41073        (-1.30347      1.51242)
R1^2/D10^2  : 0.518973        (-0.276983      0.740118)
kT2 [keV]   : 30.3453        (-5.44006      9.0328)
R2^2/D10^2  : 3.04147E-03    (-0.00170072   0.00288497)
------------------------------------------------------------
#Fit statistic : Chi-Squared =          90.68 using 59 PHA bins.
# Reduced chi-squared =          1.649 for     55 degrees of freedom
# Null hypothesis probability =   1.747153e-03

Energy  Fluence     90% Error
[keV]   [erg/cm2]   [erg/cm2]
15- 25  3.078e-07   8.307e-08
25- 50  5.447e-07   1.142e-07
50-150  1.558e-06   4.003e-07
15-150  2.411e-06   5.022e-07
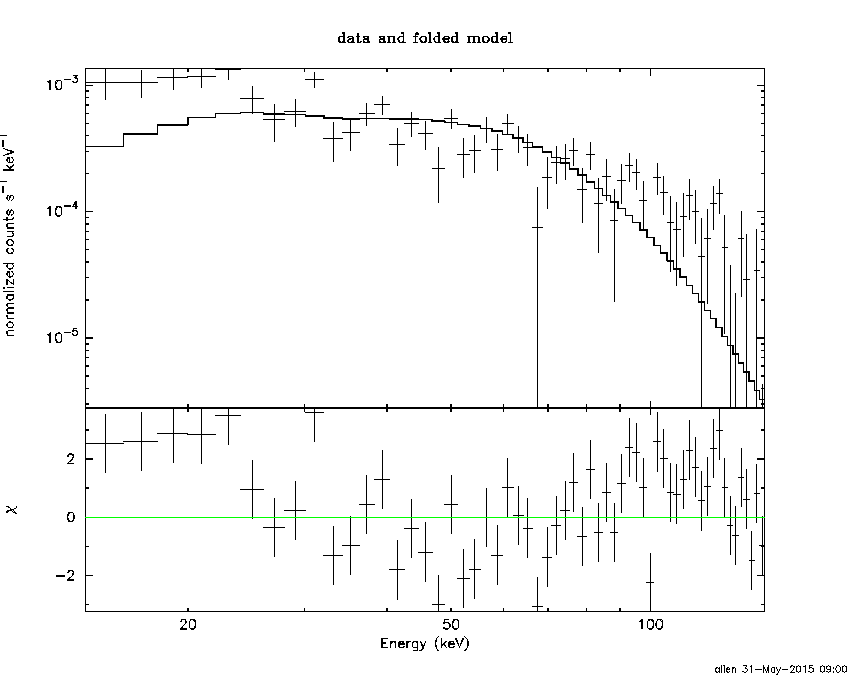
Peak spectrum fit
Power-law model
Time interval is from   45.976 sec. to   46.976 sec.

Spectral model in power-law:
------------------------------------------------------------
Parameters  : value       lower 90%   higher 90%
Photon index: 1.28836     ( -0.249623   0.249578 )
Norm@50keV  : 1.48747E-02    ( -0.00202468   0.00202034 )
------------------------------------------------------------
#Fit statistic : Chi-Squared =          45.27 using 59 PHA bins.
# Reduced chi-squared =         0.7941 for     57 degrees of freedom
# Null hypothesis probability =   8.689326e-01

Photon flux (15-150 keV)    in 1 sec: 1.77083 ( -0.247314  0.248359 ) ph/cm2/s
Energy fluence (15-150 keV)             : 1.47413e-07 ( -2.24251e-08  2.26064e-08 ) ergs/cm2
Cutoff power-law model

Time interval is from   45.976 sec. to   46.976 sec.
Spectral model in the cutoff power-law:
------------------------------------------------------------
Parameters  : value       lower 90%   higher 90%
Photon index: 3.45607     ( -0.813899   0.248677 )
Epeak [keV] : 374.588      ( -9999.36 -9999.36 )
Norm@50keV  : 1.12215E-03    (     )
------------------------------------------------------------
#Fit statistic : Chi-Squared =          45.15 using 59 PHA bins.
# Reduced chi-squared =         0.8062 for     56 degrees of freedom
# Null hypothesis probability =   8.499681e-01

Photon flux (15-150 keV)    in 1 sec: 1.77035 ( -0.24749  0.24764 ) ph/cm2/s
Energy fluence (15-150 keV)             : 1.47448e-07 ( -2.2499e-08  2.2502e-08 ) ergs/cm2
Band function

Time interval is from   45.976 sec. to   46.976 sec.

Spectral model in the Band function:
------------------------------------------------------------
Parameters  : value       lower 90%   higher 90%
alpha       : -1.08146   ( 1.08167   6.0648 )
beta        : -1.28828    ( -0.248976   0.249833 )
Epeak [keV] : 51.1501      ( -51.0381 -51.0381 )
Norm@50keV   : 2.47827E-02    ( -0.0106171   2.27149 )
------------------------------------------------------------
#Fit statistic : Chi-Squared =          45.27 using 59 PHA bins.
# Reduced chi-squared =         0.8230 for     55 degrees of freedom
# Null hypothesis probability =   8.224382e-01

Photon flux (15-150 keV)    in 1 sec:  (    ) ph/cm2/s
Energy fluence (15-150 keV)             : 0 ( 0  0 ) ergs/cm2
Single BB

Spectral model blackbody:
------------------------------------------------------------
Parameters  : value    Lower 90%  Upper 90%
kT [keV]    : 20.9931  (-3.63343  4.53571)
R^2/D10^2   : 6.75100E-02  (-0.0315349   0.057933)
(R is the radius in km and D10 is the distance to the source in units of 10 kpc)
------------------------------------------------------------
#Fit statistic : Chi-Squared =          60.28 using 59 PHA bins.
# Reduced chi-squared =          1.058 for     57 degrees of freedom
# Null hypothesis probability =   3.579606e-01

Energy  Fluence     90% Error
[keV]   [erg/cm2]   [erg/cm2]
15- 25  5.622e-09   1.602e-09
25- 50  2.889e-08   7.610e-09
50-150  9.490e-08   2.469e-08
15-150  1.294e-07   2.891e-08
Thermal bremsstrahlung (OTTB)

Spectral model: thermal bremsstrahlung
------------------------------------------------------------
Parameters  : value         Lower 90%    Upper 90%
kT [keV]    : 200.000       (      )
Norm        : 7.31407       (-1.00659     1.00649)
------------------------------------------------------------
#Fit statistic : Chi-Squared =          49.53 using 59 PHA bins.
# Reduced chi-squared =         0.8690 for     57 degrees of freedom
# Null hypothesis probability =   7.483433e-01

Energy  Fluence     90% Error
[keV]   [erg/cm2]   [erg/cm2]
15- 25  1.822e-08   1.046e-08
25- 50  3.505e-08   1.936e-08
50-150  7.687e-08   4.277e-08
15-150  1.301e-07   7.250e-08
Double BB
Spectral model: bbodyrad<1> + bbodyrad<2>
------------------------------------------------------------
Parameters  : value         Lower 90%    Upper 90%
kT1 [keV]   : 4.23748        (-1.47601      2.1215)
R1^2/D10^2  : 12.6346        (-10.4766      74.7706)
kT2 [keV]   : 26.7497        (-5.2693      8.2751)
R2^2/D10^2  : 2.84378E-02    (-0.0162269   0.0296929)
------------------------------------------------------------
#Fit statistic : Chi-Squared =          40.53 using 59 PHA bins.
# Reduced chi-squared =         0.7368 for     55 degrees of freedom
# Null hypothesis probability =   9.276882e-01

Energy  Fluence     90% Error
[keV]   [erg/cm2]   [erg/cm2]
15- 25  1.850e-08   1.026e-08
25- 50  2.638e-08   8.945e-09
50-150  1.048e-07   3.942e-08
15-150  1.496e-07   4.943e-08
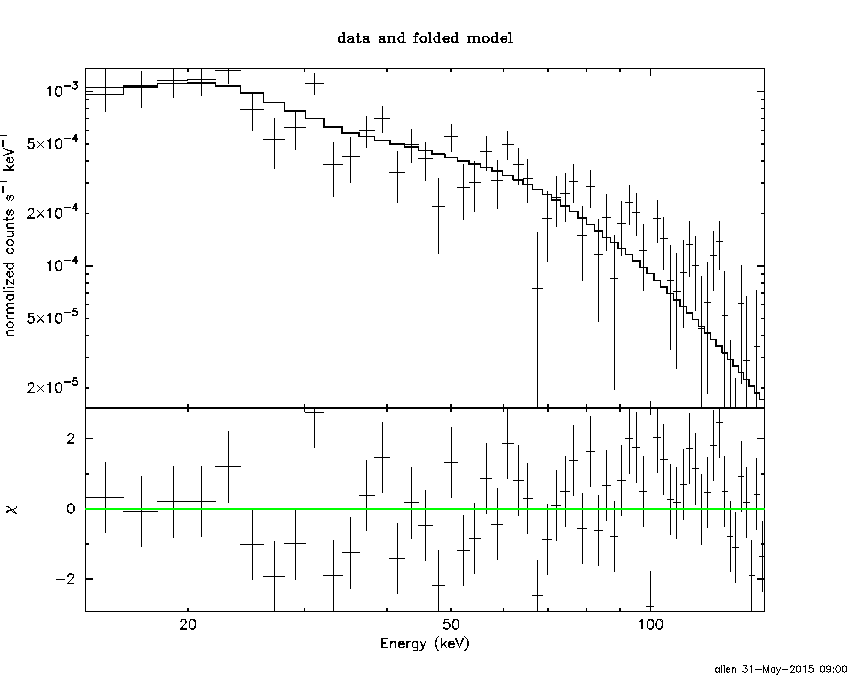
Pre-slew spectrum (Pre-slew PHA with pre-slew DRM)
Power-law model

Spectral model in power-law:
------------------------------------------------------------
Parameters  : value       lower 90%   higher 90%
Photon index: 1.44391     ( -0.125419   0.12546 )
Norm@50keV  : 2.82624E-03    ( -0.000190713   0.000190295 )
------------------------------------------------------------
#Fit statistic : Chi-Squared =          90.34 using 59 PHA bins.
# Reduced chi-squared =          1.585 for     57 degrees of freedom
# Null hypothesis probability =   3.238053e-03

Photon flux (15-150 keV)    in 87.12 sec: 0.347772 ( -0.0244656  0.0245796 ) ph/cm2/s
Energy fluence (15-150 keV)             : 2.35883e-06 ( -1.7401e-07  1.74825e-07 ) ergs/cm2
Cutoff power-law model

Spectral model in the cutoff power-law:
------------------------------------------------------------
Parameters  : value       lower 90%   higher 90%
Photon index: 1.44161     ( -0.221781   0.12556 )
Epeak [keV] : 9999.36      ( -9999.36 -9999.36 )
Norm@50keV  : 2.83540E-03    ( -0.000191069   0.000896436 )
------------------------------------------------------------
#Fit statistic : Chi-Squared =          90.36 using 59 PHA bins.
# Reduced chi-squared =          1.614 for     56 degrees of freedom
# Null hypothesis probability =   2.466684e-03

Photon flux (15-150 keV)    in 87.12 sec: 0.348382 ( -0.025166  0.023924 ) ph/cm2/s
Energy fluence (15-150 keV)             : 2.35003e-06 ( -1.66007e-07  1.79729e-07 ) ergs/cm2
Band function

Spectral model in the Band function:
------------------------------------------------------------
Parameters  : value       lower 90%   higher 90%
alpha       : -1.14862   ( 1.1496   6.14526 )
beta        : -1.44388    ( -0.127393   0.125426 )
Epeak [keV] : 36.7667      ( -36.1209 -36.1209 )
Norm@50keV   : 5.68411E-03    ( -0.00226641   0.404298 )
------------------------------------------------------------
#Fit statistic : Chi-Squared =          90.34 using 59 PHA bins.
# Reduced chi-squared =          1.643 for     55 degrees of freedom
# Null hypothesis probability =   1.881036e-03

Photon flux (15-150 keV)    in 87.12 sec:  (    ) ph/cm2/s
Energy fluence (15-150 keV)             : 0 ( 0  0 ) ergs/cm2
S(25-50 keV) vs. S(50-100 keV) plot

S(25-50 keV)  = 5.67e-07
S(50-100 keV) = 8.34e-07
T90 vs. Hardness ratio plot
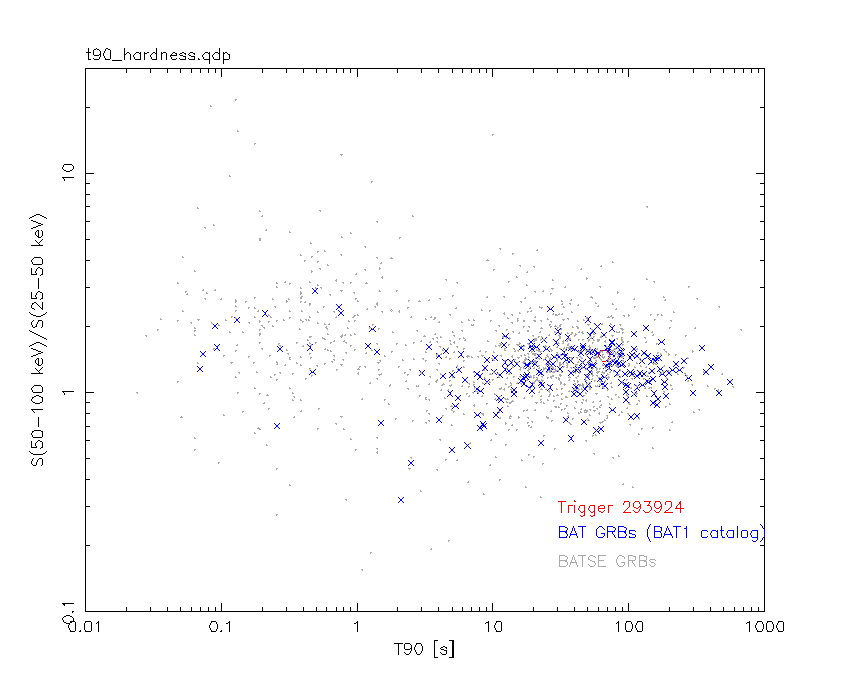
T90                                   = 65.8799999952316 sec.
Hardness ratio (energy fluence ratio) = 1.4709
Color vs. Color plot
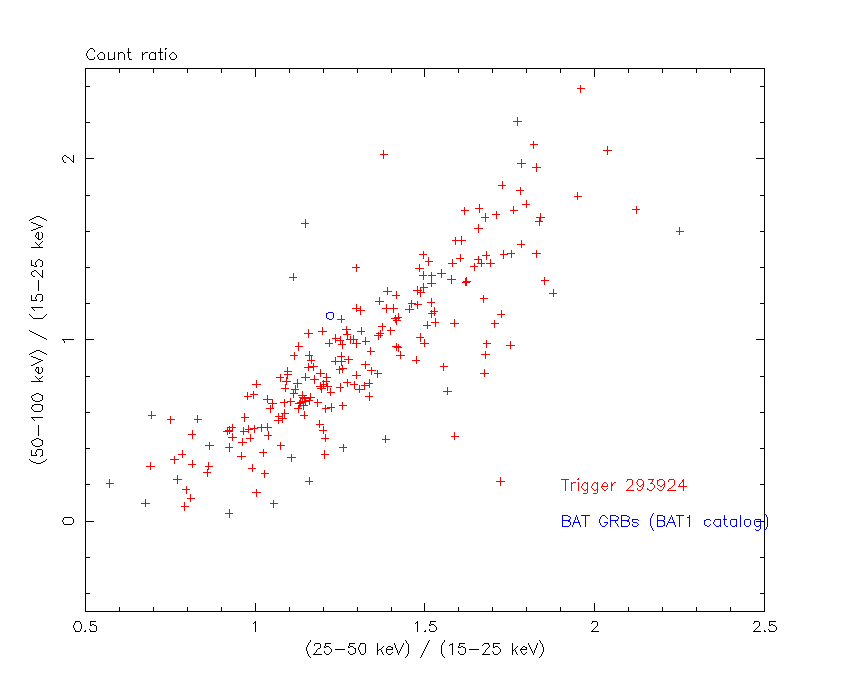
Count Ratio  (25-50 keV) / (15-25 keV) = 1.22056
Count Ratio (50-100 keV) / (15-25 keV) = 1.13399
Mask shadow pattern
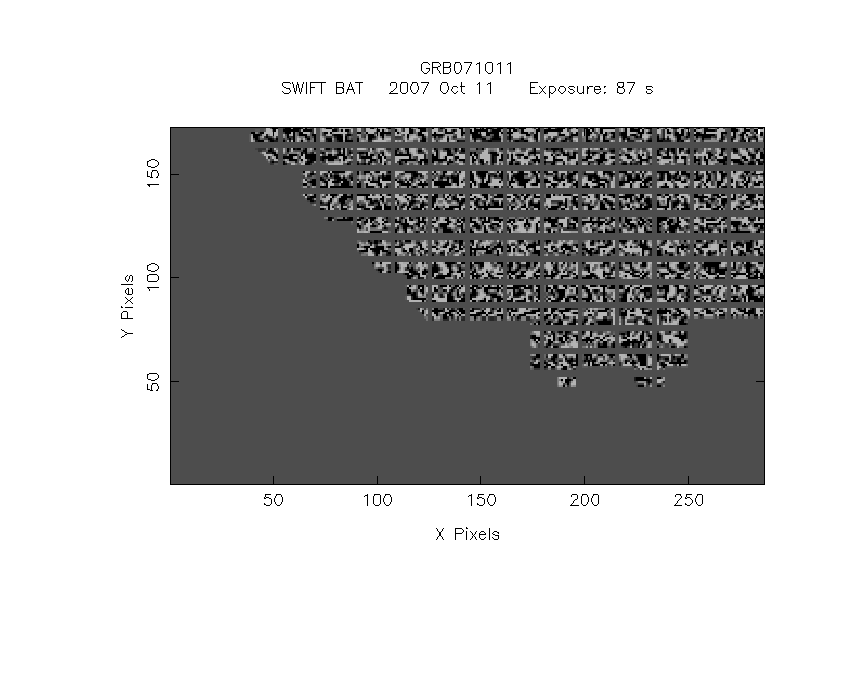
IMX = -6.120018621672628E-01, IMY = -4.172149212453142E-01
TIME vs. PHA plot around the trigger time
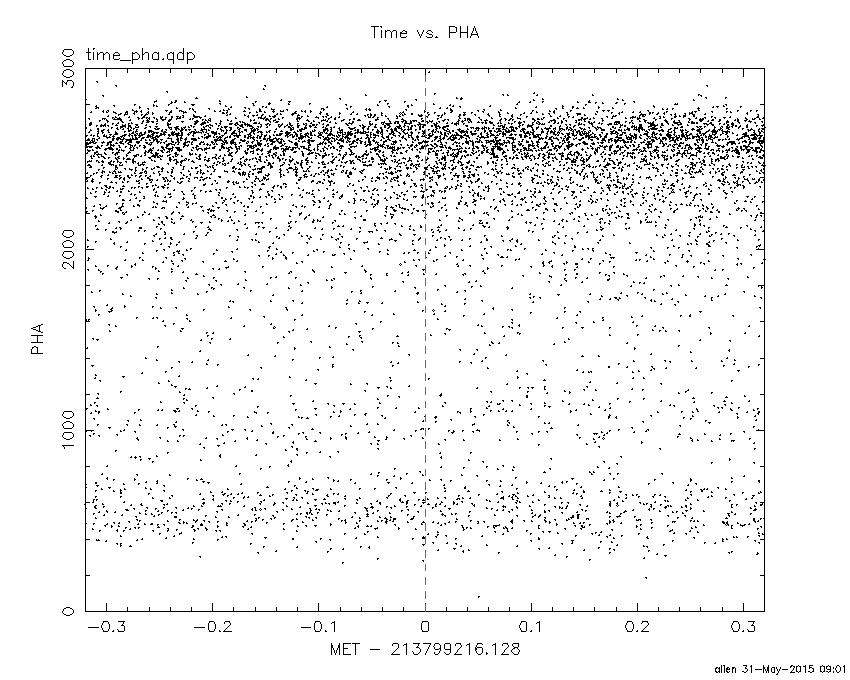
Blue+Cyan dotted lines: Time interval of the scaled map
From 0.000000 to 1.024000
TIME vs. DetID plot around the trigger time
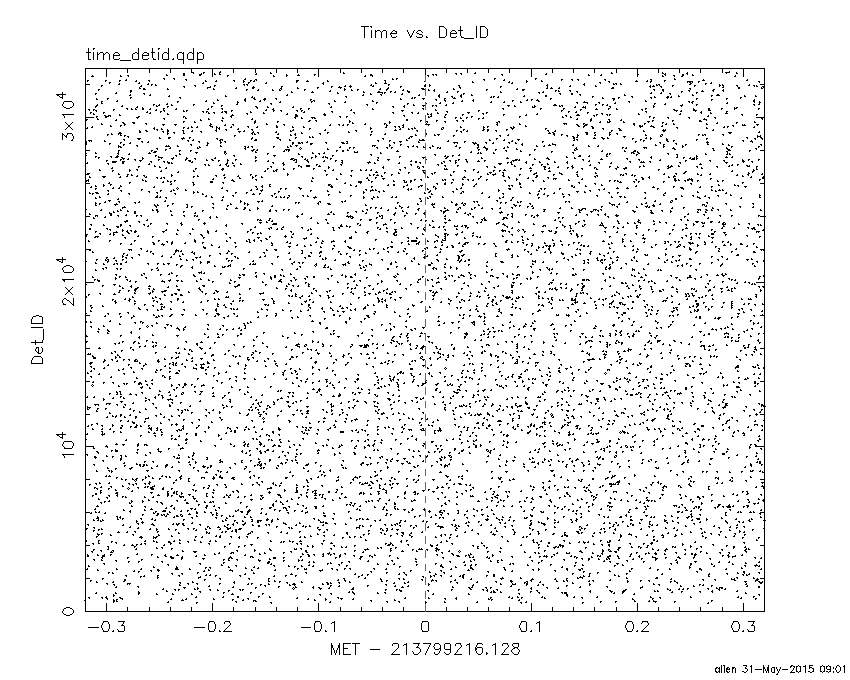
Blue+Cyan dotted lines: Time interval of the scaled map
From 0.000000 to 1.024000
100 us light curve (15-350 keV)

Blue+Cyan dotted lines: Time interval of the scaled map
From 0.000000 to 1.024000
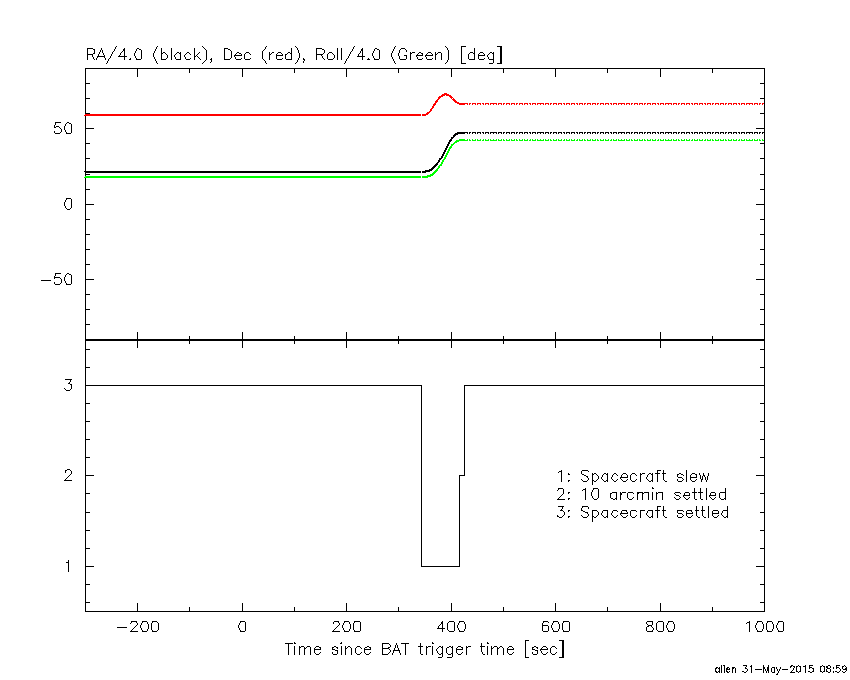
Spacecraft aspect plot
Bright source in the pre-burst/pre-slew/post-slew images
Pre-burst image of 15-350 keV band
Time interval of the image:
-239.128000 -9.472000

# RAcent  DECcent POSerr Theta    Phi  PeakCts   SNR AngSep     Name
#  [deg]    [deg]    ['] [deg]  [deg]                   [']
 83.6307  22.0118    0.3  37.1   22.2   9.3070  33.4    0.2	Crab
 25.3066  48.3131    2.9  36.2  118.5   1.4957   4.0 ------	UNKNOWN
344.4094  53.5971    3.0  51.1  149.9   3.6281   3.9 ------	UNKNOWN
 88.9460   8.4175    2.3  50.7   14.7   2.7341   4.9 ------	UNKNOWN
335.5182  66.9809    2.4  44.1  166.4   1.5453   4.7 ------	UNKNOWN
137.4544  33.3987    3.9  42.2  -57.5   1.8325   2.9 ------	UNKNOWN
136.2027  25.3954    4.0  48.2  -49.9   2.8591   2.9 ------	UNKNOWN
155.5993  47.6601    2.9  40.9  -87.4   3.6849   4.0 ------	UNKNOWN
Pre-slew background subtracted image of 15-350 keV band
Time interval of the image:
-9.472000 77.652000

# RAcent  DECcent POSerr Theta    Phi  PeakCts   SNR AngSep     Name
#  [deg]    [deg]    ['] [deg]  [deg]                   [']
 83.5124  21.9621  245.2  37.2   22.4  -0.0074  -0.0    7.4	Crab
 72.7798  20.4974    2.1  39.8   38.1   1.2485   5.5 ------	UNKNOWN
  8.3922  61.1334    0.5  36.5  145.7   3.9626  21.1 ------	UNKNOWN
245.7847  71.5138    2.6  48.6 -153.3   1.0132   4.3 ------	UNKNOWN
Post-slew image of 15-350 keV band
Time interval of the image:
415.172600 962.932000

# RAcent  DECcent POSerr Theta    Phi  PeakCts   SNR AngSep     Name
#  [deg]    [deg]    ['] [deg]  [deg]                   [']
254.5747  35.4031   14.3  48.3 -162.8  -0.5094  -0.8    6.8	Her X-1
274.8369  34.6717    3.8  56.9  179.3   5.4308   3.1 ------	UNKNOWN
219.0219  58.6863    2.5  15.7 -153.1   1.2339   4.6 ------	UNKNOWN
152.1214  24.8590    2.5  47.6  -31.4   2.7254   4.6 ------	UNKNOWN
249.5722  26.8507    4.0  53.9 -152.9   2.9602   2.9 ------	UNKNOWN
243.9114  23.1040    4.2  55.2 -145.3   5.8461   2.8 ------	UNKNOWN
Plot creation:
Sun May 31 09:01:07 EDT 2015