Special notes of this burst
Image
Pre-slew 15.0-50.0 keV image (Event data)
#RAcent DECcent POSerr Theta  Phi  Peak_Cts  SNR Name
279.525 33.858 0.000 30.683 -35.567 0.277 7.513 TRIG_00294120

Image time interval: 0.000 to 16.384 [sec]
Lightcurves
Notes:
- 1) The mask-weighted light curves are using the flight position.
- 2) Multiple plots of different time binning/intervals are shown to cover all scenarios of short/long GRBs, rate/image triggers, and real/false positives.
- 3) For all the mask-weighted lightcurves, the y-axis units are counts/sec/det where a det is 0.4 x 0.4 = 0.16 sq cm.
- 4) The verticle lines correspond to following: green dotted lines are T50 interval, black dotted lines are T90 interval, blue solid line(s) is a spacecraft slew start time, and orange solid line(s) is a spacecraft slew end time.
- 5) Time of each bin is in the middle of the bin.
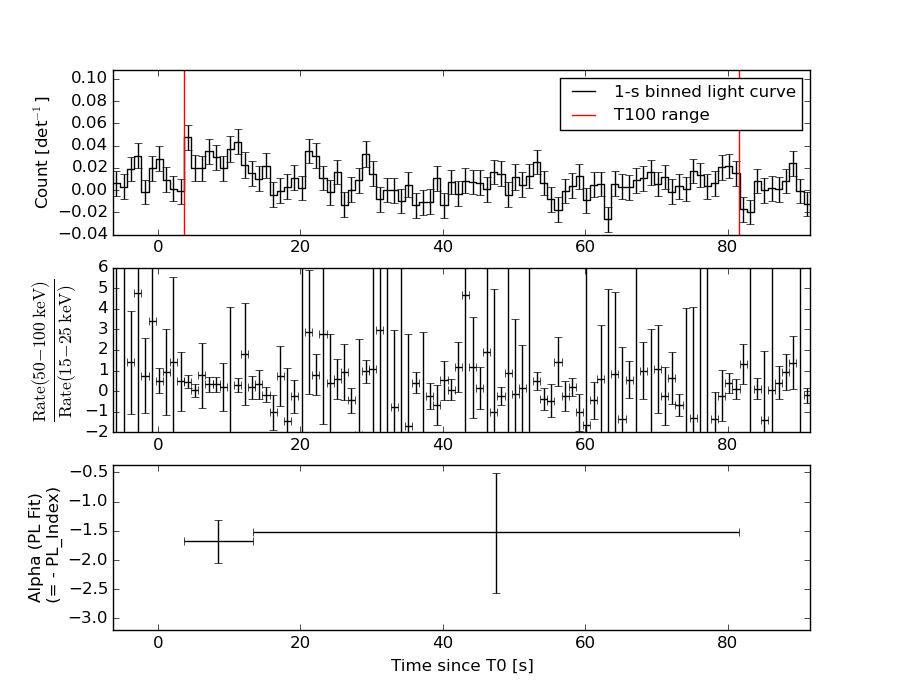
1 s binning
From T0-310 s to T0+310 s
From T100_start - 20 s to T100_end + 30 s
Full time interval
64 ms binning
Full time interval
From T100_start to T100_end
From T0-5 sec to T0+5 sec
16 ms binning
From T100_start-5 s to T100_start+5 s
Blue+Cyan dotted lines: Time interval of the scaled map
From 0.000000 to 16.384000
8 ms binning
From T100_start-3 s to T100_start+3 s
Blue+Cyan dotted lines: Time interval of the scaled map
From 0.000000 to 16.384000
2 ms binning
From T100_start-1 s to T100_start+1 s
Blue+Cyan dotted lines: Time interval of the scaled map
From 0.000000 to 16.384000
SN=5 or 10 sec. binning (whichever binning is satisfied first)
SN=5 or 10 sec. binning (T < 200 sec)
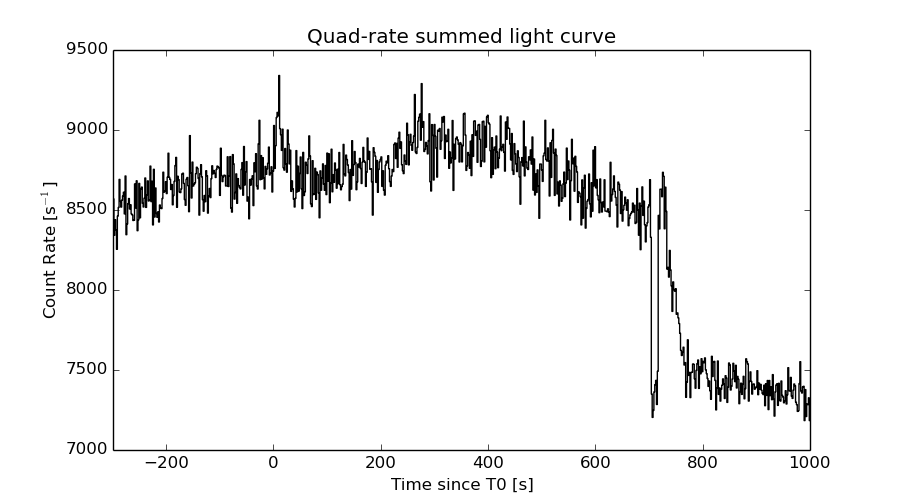
Quad-rate summed light curves (from T0-300s to T0+1000s)
Spectral Evolution
Spectra
Notes:
- 1) The fitting includes the systematic errors.
- 2) When the burst includes telescope slew time periods, the fitting uses an average response file made from multiple 5-s response files through out the slew time plus single time preiod for the non-slew times, and weighted by the total counts in the corresponding time period using addrmf. An average response file is needed becuase a spectral fit using the pre-slew DRM will introduce some errors in both a spectral shape and a normalization if the PHA file contains a lot of the slew/post-slew time interval.
- 3) For fits to more complicated models (e.g. a power-law over a cutoff power-law), the BAT team has decided to require a chi-square improvement of more than 6 for each extra dof.
Time averaged spectrum fit using the average DRM
Power-law model

Time interval is from    3.600 sec. to   81.552 sec.

Spectral model in power-law:
------------------------------------------------------------
Parameters  : value       lower 90%   higher 90%
Photon index: 1.60675     ( -0.500654   0.516572 )
Norm@50keV  : 5.42055E-04    ( -0.000150132   0.000141117 )
------------------------------------------------------------
#Fit statistic : Chi-Squared =          45.28 using 59 PHA bins.
# Reduced chi-squared =         0.7943 for     57 degrees of freedom
# Null hypothesis probability =   8.686642e-01

Photon flux (15-150 keV)    in 77.95 sec: 6.98030E-02 ( -0.0172344  0.0172519 ) ph/cm2/s
Energy fluence (15-150 keV)             : 3.94835e-07 ( -1.13694e-07  1.171e-07 ) ergs/cm2
Cutoff power-law model
Time interval is from    3.600 sec. to   81.552 sec.
Spectral model in the cutoff power-law:
------------------------------------------------------------
Parameters  : value       lower 90%   higher 90%
Photon index: 2.28870     (     )
Epeak [keV] : 104.674      (   )
Norm@50keV  : 2.29241E-04    (     )
------------------------------------------------------------
#Fit statistic : Chi-Squared =          43.81 using 59 PHA bins.
# Reduced chi-squared =         0.7823 for     56 degrees of freedom
# Null hypothesis probability =   8.817694e-01

Photon flux (15-150 keV)    in 77.95 sec: 6.99008E-02 ( -0.0170019  0.0171348 ) ph/cm2/s
Energy fluence (15-150 keV)             : 3.91173e-07 ( -1.10052e-07  1.2094e-07 ) ergs/cm2
Band function

Time interval is from    3.600 sec. to   81.552 sec.

Spectral model in the Band function:
------------------------------------------------------------
Parameters  : value       lower 90%   higher 90%
alpha       : -1.28552   ( 1.2864   1.2864 )
beta        : -1.60673    ( 1.60685   0.500634 )
Epeak [keV] : 26.4335      ( -26.0802 -26.0802 )
Norm@50keV   : 1.18572E-03    ( -0.00118719   0.0205921 )
------------------------------------------------------------
#Fit statistic : Chi-Squared =          45.28 using 59 PHA bins.
# Reduced chi-squared =         0.8232 for     55 degrees of freedom
# Null hypothesis probability =   8.221121e-01

Photon flux (15-150 keV)    in 77.95 sec:  (    ) ph/cm2/s
Energy fluence (15-150 keV)             : 0 ( 0  0 ) ergs/cm2
Single BB
Spectral model blackbody:
------------------------------------------------------------
Parameters  : value    Lower 90%  Upper 90%
kT [keV]    : 10.8663  (-3.2663  6.11397)
R^2/D10^2   : 2.29439E-02  (-0.018319   0.0643206)
(R is the radius in km and D10 is the distance to the source in units of 10 kpc)
------------------------------------------------------------
#Fit statistic : Chi-Squared =          54.09 using 59 PHA bins.
# Reduced chi-squared =         0.9489 for     57 degrees of freedom
# Null hypothesis probability =   5.849806e-01

Energy  Fluence     90% Error
[keV]   [erg/cm2]   [erg/cm2]
15- 25  4.401e-08   2.731e-08
25- 50  1.225e-07   7.129e-08
50-150  8.093e-08   5.874e-08
15-150  2.474e-07   1.516e-07
Thermal bremsstrahlung (OTTB)
Spectral model: thermal bremsstrahlung
------------------------------------------------------------
Parameters  : value         Lower 90%    Upper 90%
kT [keV]    : 199.363       (-199.363      -199.363)
Norm        : 0.279310       (-0.068612     0.102572)
------------------------------------------------------------
#Fit statistic : Chi-Squared =          46.34 using 59 PHA bins.
# Reduced chi-squared =         0.8130 for     57 degrees of freedom
# Null hypothesis probability =   8.425291e-01

Energy  Fluence     90% Error
[keV]   [erg/cm2]   [erg/cm2]
15- 25  5.422e-08   3.253e-08
25- 50  1.043e-07   6.236e-08
50-150  2.287e-07   1.354e-07
15-150  3.872e-07   2.343e-07
Double BB
------------------------------------------------------------
#Fit statistic : Chi-Squared =          42.42 using 59 PHA bins.
#Fit statistic : Chi-Squared =          42.33 using 59 PHA bins.
#Fit statistic : Chi-Squared =          42.30 using 59 PHA bins.
#Fit statistic : Chi-Squared =          42.28 using 59 PHA bins.
# Reduced chi-squared =         0.7713 for     55 degrees of freedom
# Reduced chi-squared =         0.7697 for     55 degrees of freedom
# Reduced chi-squared =         0.7691 for     55 degrees of freedom
# Reduced chi-squared =         0.7688 for     55 degrees of freedom
# Null hypothesis probability =   8.925246e-01
# Null hypothesis probability =   8.944702e-01
# Null hypothesis probability =   8.951034e-01
# Null hypothesis probability =   8.954230e-01

Energy  Fluence     90% Error
[keV]   [erg/cm2]   [erg/cm2]
15- 25  6.135e-08   3.657e-08
25- 50  1.020e-07   5.901e-08
50-150  2.931e-07   1.631e-07
15-150  4.564e-07   2.192e-07
Peak spectrum fit
Power-law model
Time interval is from    3.644 sec. to    4.644 sec.

Spectral model in power-law:
------------------------------------------------------------
Parameters  : value       lower 90%   higher 90%
Photon index: 1.92433     ( -0.990105   1.1767 )
Norm@50keV  : 2.49549E-03    ( -0.00249375   0.00131916 )
------------------------------------------------------------
#Fit statistic : Chi-Squared =          54.90 using 59 PHA bins.
# Reduced chi-squared =         0.9632 for     57 degrees of freedom
# Null hypothesis probability =   5.541346e-01

Photon flux (15-150 keV)    in 1 sec: 0.361891 ( -0.149365  0.149374 ) ph/cm2/s
Energy fluence (15-150 keV)             : 2.29347e-08 ( -2.2934e-08  1.32922e-08 ) ergs/cm2
Cutoff power-law model
Time interval is from    3.644 sec. to    4.644 sec.
Spectral model in the cutoff power-law:
------------------------------------------------------------
Parameters  : value       lower 90%   higher 90%
Photon index: 3.30027     (     )
Epeak [keV] : 360.103      (   )
Norm@50keV  : 5.37392E-04    (     )
------------------------------------------------------------
#Fit statistic : Chi-Squared =          54.01 using 59 PHA bins.
# Reduced chi-squared =         0.9645 for     56 degrees of freedom
# Null hypothesis probability =   5.505371e-01

Photon flux (15-150 keV)    in 1 sec: 0.361034 ( -0.14924  0.149468 ) ph/cm2/s
Energy fluence (15-150 keV)             : 2.225e-08 ( -1.13367e-08  1.39992e-08 ) ergs/cm2
Band function
Time interval is from    3.644 sec. to    4.644 sec.

Spectral model in the Band function:
------------------------------------------------------------
Parameters  : value       lower 90%   higher 90%
alpha       : 4.99493   ( -4.99493   -4.99493 )
beta        : -2.03332    ( -5.19188   1.06584 )
Epeak [keV] : 19.6625      ( -19.6625 71.3653 )
Norm@50keV   : 1889.48    ( -776.345   8.71987e+06 )
------------------------------------------------------------
#Fit statistic : Chi-Squared =          54.77 using 59 PHA bins.
# Reduced chi-squared =         0.9958 for     55 degrees of freedom
# Null hypothesis probability =   4.834862e-01

Photon flux (15-150 keV)    in 1 sec:  (    ) ph/cm2/s
Energy fluence (15-150 keV)             : 0 ( 0  0 ) ergs/cm2
Single BB
Spectral model blackbody:
------------------------------------------------------------
Parameters  : value    Lower 90%  Upper 90%
kT [keV]    : 5.81007  (-2.23807  5.48884)
R^2/D10^2   : 1.37039  (-1.37008   10.9082)
(R is the radius in km and D10 is the distance to the source in units of 10 kpc)
------------------------------------------------------------
#Fit statistic : Chi-Squared =          57.49 using 59 PHA bins.
# Reduced chi-squared =          1.009 for     57 degrees of freedom
# Null hypothesis probability =   4.567788e-01

Energy  Fluence     90% Error
[keV]   [erg/cm2]   [erg/cm2]
15- 25  5.860e-09   3.792e-09
25- 50  5.445e-09   3.803e-09
50-150  4.362e-10   4.030e-10
15-150  1.174e-08   7.865e-09
Thermal bremsstrahlung (OTTB)
Spectral model: thermal bremsstrahlung
------------------------------------------------------------
Parameters  : value         Lower 90%    Upper 90%
kT [keV]    : 99.9709       (-99.9913      -99.9913)
Norm        : 1.54605       (-0.740543     5.21121)
------------------------------------------------------------
#Fit statistic : Chi-Squared =          55.92 using 59 PHA bins.
# Reduced chi-squared =         0.9810 for     57 degrees of freedom
# Null hypothesis probability =   5.157548e-01

Energy  Fluence     90% Error
[keV]   [erg/cm2]   [erg/cm2]
15- 25  4.041e-09   2.685e-09
25- 50  6.987e-09   4.567e-09
50-150  1.132e-08   9.200e-09
15-150  2.235e-08   1.566e-08
Double BB
Spectral model: bbodyrad<1> + bbodyrad<2>
------------------------------------------------------------
Parameters  : value         Lower 90%    Upper 90%
kT1 [keV]   : 5.19154        (-2.03817      3.07069)
R1^2/D10^2  : 2.08648        (-1.83538      19.4251)
kT2 [keV]   : 198.276        (-198.25      -198.25)
R2^2/D10^2  : 7.13224E-05    (-4.72909e-05   0.00734963)
------------------------------------------------------------
#Fit statistic : Chi-Squared =          51.50 using 59 PHA bins.
# Reduced chi-squared =         0.9364 for     55 degrees of freedom
# Null hypothesis probability =   6.091021e-01

Energy  Fluence     90% Error
[keV]   [erg/cm2]   [erg/cm2]
15- 25  5.975e-09   3.775e-09
25- 50  4.982e-09   2.852e-09
50-150  1.895e-08   2.454e-09
15-150  2.991e-08   8.940e-09
Pre-slew spectrum (Pre-slew PHA with pre-slew DRM)
Power-law model
Spectral model in power-law:
------------------------------------------------------------
Parameters  : value       lower 90%   higher 90%
Photon index: 1.60675     ( -0.500654   0.516572 )
Norm@50keV  : 5.42055E-04    ( -0.000150132   0.000141117 )
------------------------------------------------------------
#Fit statistic : Chi-Squared =          45.28 using 59 PHA bins.
# Reduced chi-squared =         0.7943 for     57 degrees of freedom
# Null hypothesis probability =   8.686642e-01

Photon flux (15-150 keV)    in 77.95 sec: 6.98030E-02 ( -0.0172344  0.0172519 ) ph/cm2/s
Energy fluence (15-150 keV)             : 3.94835e-07 ( -1.13694e-07  1.171e-07 ) ergs/cm2
Cutoff power-law model
Spectral model in the cutoff power-law:
------------------------------------------------------------
Parameters  : value       lower 90%   higher 90%
Photon index: 2.92805     ( -1.63489   0.269239 )
Epeak [keV] : 277.485      (   )
Norm@50keV  : 1.20707E-04    (     )
------------------------------------------------------------
#Fit statistic : Chi-Squared =          43.42 using 59 PHA bins.
# Reduced chi-squared =         0.7754 for     56 degrees of freedom
# Null hypothesis probability =   8.901156e-01

Photon flux (15-150 keV)    in 77.95 sec: 6.99008E-02 ( -0.0170019  0.0171348 ) ph/cm2/s
Energy fluence (15-150 keV)             : 3.91173e-07 ( -1.10052e-07  1.2094e-07 ) ergs/cm2
Band function

Spectral model in the Band function:
------------------------------------------------------------
Parameters  : value       lower 90%   higher 90%
alpha       : -1.28552   ( 1.2864   1.2864 )
beta        : -1.60673    ( 1.60685   0.500634 )
Epeak [keV] : 26.4335      ( -26.0802 -26.0802 )
Norm@50keV   : 1.18572E-03    ( -0.00118719   0.0232208 )
------------------------------------------------------------
#Fit statistic : Chi-Squared =          45.28 using 59 PHA bins.
# Reduced chi-squared =         0.8232 for     55 degrees of freedom
# Null hypothesis probability =   8.221121e-01

Photon flux (15-150 keV)    in 77.95 sec:  (    ) ph/cm2/s
Energy fluence (15-150 keV)             : 0 ( 0  0 ) ergs/cm2
S(25-50 keV) vs. S(50-100 keV) plot
S(25-50 keV)  = 1.03e-07
S(50-100 keV) = 1.35e-07
T90 vs. Hardness ratio plot
T90                                   = 75.5840000212193 sec.
Hardness ratio (energy fluence ratio) = 1.31068
Color vs. Color plot
Count Ratio  (25-50 keV) / (15-25 keV) = 0.907524
Count Ratio (50-100 keV) / (15-25 keV) = 0.422996
Mask shadow pattern

IMX = 0.482663359722, IMY = 0.345128921831
TIME vs. PHA plot around the trigger time
Blue+Cyan dotted lines: Time interval of the scaled map
From 0.000000 to 16.384000
TIME vs. DetID plot around the trigger time
Blue+Cyan dotted lines: Time interval of the scaled map
From 0.000000 to 16.384000
100 us light curve (15-350 keV)
Blue+Cyan dotted lines: Time interval of the scaled map
From 0.000000 to 16.384000
Spacecraft aspect plot

Bright source in the pre-burst/pre-slew/post-slew images
Pre-burst image of 15-350 keV band
Time interval of the image:
-239.344000 -96.030100
-95.344000 3.600000

# RAcent  DECcent POSerr Theta    Phi  PeakCts   SNR AngSep     Name
#  [deg]    [deg]    ['] [deg]  [deg]                   [']
268.4657  -1.3245    6.5  35.3 -105.7   0.7148   1.8    9.7	SW J1753.5-0127
270.4310 -25.1110   43.0  47.2 -137.6  -0.1607  -0.3    8.2	GX 5-1
270.4299 -25.6691   10.6  47.6 -138.1  -0.6837  -1.1    8.2	GRS 1758-258
273.9092 -14.0722    6.1  37.2 -129.0   0.6223   1.9    6.0	GX 17+2
276.0511 -30.3061    9.0  48.1 -147.3  -0.5879  -1.3    7.5	H1820-303
285.0240 -24.9182    6.3  39.4 -153.2   0.5611   1.8    0.7	HT1900.1-2455
288.7747  10.9527    0.8  12.8  -86.0   2.6277  14.6    1.5	GRS 1915+105
299.5914  35.2070    0.3  24.4   -1.9   8.7636  45.4    0.3	Cyg X-1
308.1467  40.9538    1.3  30.6   12.0   1.7861   8.7    1.7	Cyg X-3
326.2398  38.3951    3.1  35.1   36.8   1.0844   3.8    5.4	Cyg X-2
308.0571  37.6600    1.2  27.4   13.3   1.9402   9.8 ------	UNKNOWN
293.4093 -47.2584    2.8  58.6 -170.9   4.6168   4.1 ------	UNKNOWN
284.2330  34.1155    2.6  28.2  -29.4   0.8684   4.5 ------	UNKNOWN
265.4020 -22.1502    2.1  48.6 -130.5   4.4814   5.6 ------	UNKNOWN
Pre-slew background subtracted image of 15-350 keV band
Time interval of the image:
3.600000 81.552000

# RAcent  DECcent POSerr Theta    Phi  PeakCts   SNR AngSep     Name
#  [deg]    [deg]    ['] [deg]  [deg]                   [']
268.4966  -1.3234    9.0  35.3 -105.7  -0.2358  -1.3   10.9	SW J1753.5-0127
270.4323 -25.1182   10.6  47.2 -137.6   0.2966   1.1    8.4	GX 5-1
270.4413 -25.7319   13.2  47.7 -138.2   0.2377   0.9    7.5	GRS 1758-258
274.0057 -14.0377  926.5  37.2 -129.0  -0.0020  -0.0    0.1	GX 17+2
275.7784 -30.3160    4.8  48.2 -147.0   0.5831   2.4    8.2	H1820-303
285.1127 -24.9051    8.7  39.3 -153.3  -0.1883  -1.3    4.3	HT1900.1-2455
288.7048  11.0025    2.8  12.8  -85.8  -0.3979  -4.1    6.5	GRS 1915+105
299.4199  35.2446    5.5  24.4   -2.2   0.2067   2.1    8.7	Cyg X-1
307.9645  41.0738    3.5  30.7   11.6   0.3573   3.3    9.8	Cyg X-3
326.0389  38.2319    6.6  34.9   36.8   0.2741   1.7    8.3	Cyg X-2
322.6710  52.4923    2.0  44.9   20.4   1.2244   5.7 ------	UNKNOWN
311.6680 -28.4887    2.4  40.5  169.1   0.7401   4.9 ------	UNKNOWN
311.0242 -21.7267    2.9  33.9  166.9   0.5059   3.9 ------	UNKNOWN
294.2004  67.6614    2.5  57.0   -0.9   2.5605   4.6 ------	UNKNOWN
279.4873  33.8050    1.8  30.7  -35.7   0.6973   6.3 ------	UNKNOWN
Post-slew image of 15-350 keV band
Time interval of the image:
791.556610 962.664100

# RAcent  DECcent POSerr Theta    Phi  PeakCts   SNR AngSep     Name
#  [deg]    [deg]    ['] [deg]  [deg]                   [']
326.2040  38.4322   54.3  35.5  -89.7   0.0652   0.2    6.8	Cyg X-2
 37.0729  11.6921    2.3  35.2   59.9   1.3140   5.0 ------	UNKNOWN
319.6173 -15.2878    2.5  54.3 -166.1   1.8712   4.6 ------	UNKNOWN
Plot creation:
Thu Oct  8 20:36:10 EDT 2015