Special notes of this burst
Image
Pre-slew 15.0-50.0 keV image (Event data)
#RAcent DECcent POSerr Theta  Phi  Peak_Cts  SNR Name
164.676 53.831 0.000 19.909 -178.501 1.059 7.361 TRIG_00294645

Image time interval: 0.000 to 376.000 [sec]
Lightcurves
Notes:
- 1) The mask-weighted light curves are using the flight position.
- 2) Multiple plots of different time binning/intervals are shown to cover all scenarios of short/long GRBs, rate/image triggers, and real/false positives.
- 3) For all the mask-weighted lightcurves, the y-axis units are counts/sec/det where a det is 0.4 x 0.4 = 0.16 sq cm.
- 4) The verticle lines correspond to following: green dotted lines are T50 interval, black dotted lines are T90 interval, blue solid line(s) is a spacecraft slew start time, and orange solid line(s) is a spacecraft slew end time.
- 5) Time of each bin is in the middle of the bin.
1 s binning
From T0-310 s to T0+310 s
From T100_start - 20 s to T100_end + 30 s
Full time interval
64 ms binning
Full time interval
From T100_start to T100_end
From T0-5 sec to T0+5 sec
16 ms binning
From T100_start-5 s to T100_start+5 s
Blue+Cyan dotted lines: Time interval of the scaled map
From 0.000000 to 376.000000
8 ms binning
From T100_start-3 s to T100_start+3 s
Blue+Cyan dotted lines: Time interval of the scaled map
From 0.000000 to 376.000000
2 ms binning
From T100_start-1 s to T100_start+1 s
Blue+Cyan dotted lines: Time interval of the scaled map
From 0.000000 to 376.000000
SN=5 or 10 sec. binning (whichever binning is satisfied first)
SN=5 or 10 sec. binning (T < 200 sec)
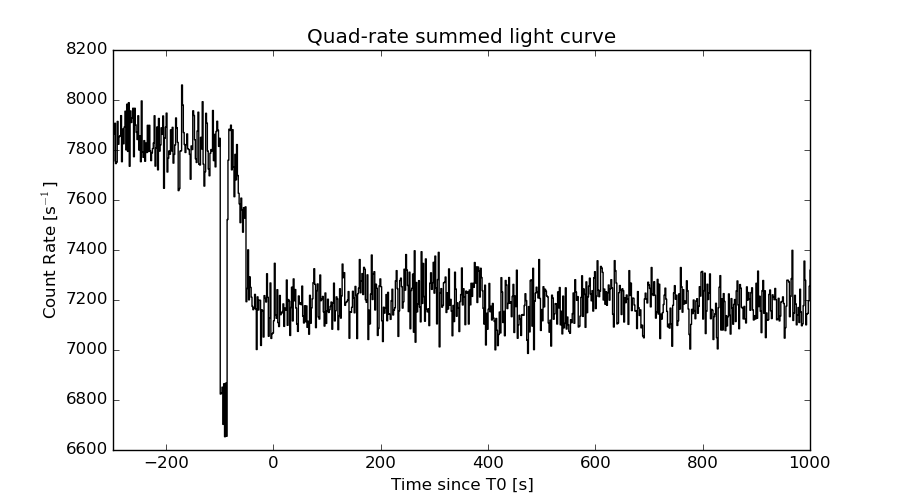
Quad-rate summed light curves (from T0-300s to T0+1000s)
Spectral Evolution
Spectra
Notes:
- 1) The fitting includes the systematic errors.
- 2) When the burst includes telescope slew time periods, the fitting uses an average response file made from multiple 5-s response files through out the slew time plus single time preiod for the non-slew times, and weighted by the total counts in the corresponding time period using addrmf. An average response file is needed becuase a spectral fit using the pre-slew DRM will introduce some errors in both a spectral shape and a normalization if the PHA file contains a lot of the slew/post-slew time interval.
- 3) For fits to more complicated models (e.g. a power-law over a cutoff power-law), the BAT team has decided to require a chi-square improvement of more than 6 for each extra dof.
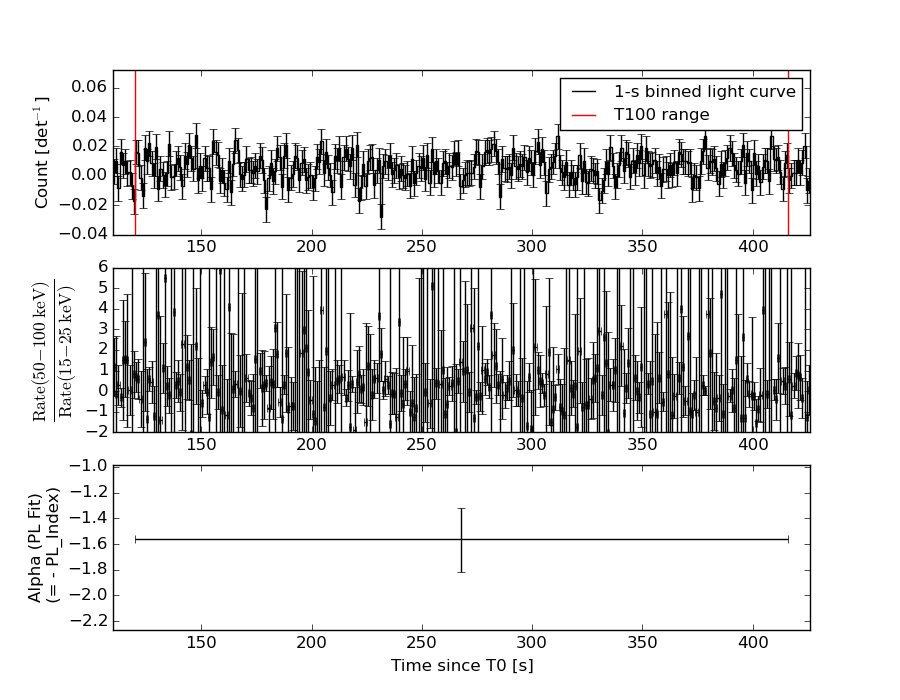
Time averaged spectrum fit using the average DRM
Power-law model

Time interval is from  119.784 sec. to  415.956 sec.

Spectral model in power-law:
------------------------------------------------------------
Parameters  : value       lower 90%   higher 90%
Photon index: 1.56343     ( -0.247072   0.252157 )
Norm@50keV  : 3.73886E-04    ( -5.48472e-05   5.37305e-05 )
------------------------------------------------------------
#Fit statistic : Chi-Squared =          70.07 using 59 PHA bins.
# Reduced chi-squared =          1.229 for     57 degrees of freedom
# Null hypothesis probability =   1.144676e-01

Photon flux (15-150 keV)    in 296.2 sec: 4.75178E-02 ( -0.00640806  0.00641392 ) ph/cm2/s
Energy fluence (15-150 keV)             : 1.04061e-06 ( -1.65735e-07  1.68976e-07 ) ergs/cm2
Cutoff power-law model
Time interval is from  119.784 sec. to  415.956 sec.
Spectral model in the cutoff power-law:
------------------------------------------------------------
Parameters  : value       lower 90%   higher 90%
Photon index: 1.56390     ( -0.250765   0.251191 )
Epeak [keV] : 9999.27      ( -9999.36 -9999.36 )
Norm@50keV  : 3.74599E-04    ( -5.51368e-05   0.000367062 )
------------------------------------------------------------
#Fit statistic : Chi-Squared =          70.08 using 59 PHA bins.
# Reduced chi-squared =          1.251 for     56 degrees of freedom
# Null hypothesis probability =   9.769626e-02

Photon flux (15-150 keV)    in 296.2 sec: 4.75564E-02 ( -0.0064404  0.0063711 ) ph/cm2/s
Energy fluence (15-150 keV)             : 1.04243e-06 ( -1.67628e-07  1.63393e-07 ) ergs/cm2
Band function
Time interval is from  119.784 sec. to  415.956 sec.

Spectral model in the Band function:
------------------------------------------------------------
Parameters  : value       lower 90%   higher 90%
alpha       : 4.79818   ( -4.79818   -4.79818 )
beta        : -1.66727    ( -0.320233   0.286441 )
Epeak [keV] : 24.0065      ( -24.0065 5.46834 )
Norm@50keV   : 38.6367    ( -5.16   240631 )
------------------------------------------------------------
#Fit statistic : Chi-Squared =          69.47 using 59 PHA bins.
# Reduced chi-squared =          1.263 for     55 degrees of freedom
# Null hypothesis probability =   9.061870e-02

Photon flux (15-150 keV)    in 296.2 sec:  (    ) ph/cm2/s
Energy fluence (15-150 keV)             : 0 ( 0  0 ) ergs/cm2
Single BB
Spectral model blackbody:
------------------------------------------------------------
Parameters  : value    Lower 90%  Upper 90%
kT [keV]    : 12.2737  (-2.5755  3.78566)
R^2/D10^2   : 1.02744E-02  (-0.0101589   0.013786)
(R is the radius in km and D10 is the distance to the source in units of 10 kpc)
------------------------------------------------------------
#Fit statistic : Chi-Squared =          93.81 using 59 PHA bins.
# Reduced chi-squared =          1.646 for     57 degrees of freedom
# Null hypothesis probability =   1.539906e-03

Energy  Fluence     90% Error
[keV]   [erg/cm2]   [erg/cm2]
15- 25  9.712e-08   2.737e-08
25- 50  3.138e-07   6.907e-08
50-150  2.884e-07   8.883e-08
15-150  6.993e-07   1.493e-07
Thermal bremsstrahlung (OTTB)

Spectral model: thermal bremsstrahlung
------------------------------------------------------------
Parameters  : value         Lower 90%    Upper 90%
kT [keV]    : 199.053       (-66.3061      -199.163)
Norm        : 0.192402       (-0.0257351     0.0260401)
------------------------------------------------------------
#Fit statistic : Chi-Squared =          71.25 using 59 PHA bins.
# Reduced chi-squared =          1.250 for     57 degrees of freedom
# Null hypothesis probability =   9.699477e-02

Energy  Fluence     90% Error
[keV]   [erg/cm2]   [erg/cm2]
15- 25  1.419e-07   7.956e-08
25- 50  2.730e-07   1.503e-07
50-150  5.984e-07   3.328e-07
15-150  1.013e-06   5.668e-07
Double BB

Spectral model: bbodyrad<1> + bbodyrad<2>
------------------------------------------------------------
Parameters  : value         Lower 90%    Upper 90%
kT1 [keV]   : 6.57727        (-1.56339      1.91457)
R1^2/D10^2  : 7.70795E-02        (-0.0464654      0.137142)
kT2 [keV]   : 35.6203        (-12.3963      47.1172)
R2^2/D10^2  : 2.33718E-04    (-0.000203102   0.000416831)
------------------------------------------------------------
#Fit statistic : Chi-Squared =          66.99 using 59 PHA bins.
# Reduced chi-squared =          1.218 for     55 degrees of freedom
# Null hypothesis probability =   1.288378e-01

Energy  Fluence     90% Error
[keV]   [erg/cm2]   [erg/cm2]
15- 25  1.603e-07   8.367e-08
25- 50  2.600e-07   1.250e-07
50-150  6.877e-07   3.782e-07
15-150  1.108e-06   5.067e-07
Peak spectrum fit
Power-law model
Time interval is from  301.656 sec. to  302.656 sec.

Spectral model in power-law:
------------------------------------------------------------
Parameters  : value       lower 90%   higher 90%
Photon index: 1.17301     ( -0.625521   0.584956 )
Norm@50keV  : 2.46505E-03    ( -0.000898458   0.000898353 )
------------------------------------------------------------
#Fit statistic : Chi-Squared =          54.61 using 59 PHA bins.
# Reduced chi-squared =         0.9581 for     57 degrees of freedom
# Null hypothesis probability =   5.651262e-01

Photon flux (15-150 keV)    in 1 sec: 0.288330 ( -0.106775  0.107699 ) ph/cm2/s
Energy fluence (15-150 keV)             : 2.51931e-08 ( -9.845e-09  1.01957e-08 ) ergs/cm2
Cutoff power-law model
Time interval is from  301.656 sec. to  302.656 sec.
Spectral model in the cutoff power-law:
------------------------------------------------------------
Parameters  : value       lower 90%   higher 90%
Photon index: -2.76176     ( 2.81793   3.89846 )
Epeak [keV] : 60.8550      ( -14.7143 282.004 )
Norm@50keV  : 0.195737    ( -0.254281   566.443 )
------------------------------------------------------------
#Fit statistic : Chi-Squared =          51.63 using 59 PHA bins.
# Reduced chi-squared =         0.9220 for     56 degrees of freedom
# Null hypothesis probability =   6.407148e-01

Photon flux (15-150 keV)    in 1 sec: 0.243615 ( -0.105918  0.116021 ) ph/cm2/s
Energy fluence (15-150 keV)             : 1.93203e-08 ( -8.0225e-09  1.10221e-08 ) ergs/cm2
Band function
Time interval is from  301.656 sec. to  302.656 sec.

Spectral model in the Band function:
------------------------------------------------------------
Parameters  : value       lower 90%   higher 90%
alpha       : 4.62579   ( -6.12149   -4.62579 )
beta        : -3.53056    ( 3.53056   3.37674 )
Epeak [keV] : 56.8787      ( -13.8748 23.4214 )
Norm@50keV   : 1.42778    ( -0.485917   142.802 )
------------------------------------------------------------
#Fit statistic : Chi-Squared =          51.63 using 59 PHA bins.
# Reduced chi-squared =         0.9387 for     55 degrees of freedom
# Null hypothesis probability =   6.043113e-01

Photon flux (15-150 keV)    in 1 sec:  (    ) ph/cm2/s
Energy fluence (15-150 keV)             : 0 ( 0  0 ) ergs/cm2
Single BB

Spectral model blackbody:
------------------------------------------------------------
Parameters  : value    Lower 90%  Upper 90%
kT [keV]    : 16.5819  (-4.58424  7.71696)
R^2/D10^2   : 2.69195E-02  (-0.0269183   0.0542256)
(R is the radius in km and D10 is the distance to the source in units of 10 kpc)
------------------------------------------------------------
#Fit statistic : Chi-Squared =          51.88 using 59 PHA bins.
# Reduced chi-squared =         0.9102 for     57 degrees of freedom
# Null hypothesis probability =   6.669240e-01

Energy  Fluence     90% Error
[keV]   [erg/cm2]   [erg/cm2]
15- 25  1.517e-09   9.550e-10
25- 50  6.580e-09   4.015e-09
50-150  1.281e-08   8.860e-09
15-150  2.091e-08   1.312e-08
Thermal bremsstrahlung (OTTB)
Spectral model: thermal bremsstrahlung
------------------------------------------------------------
Parameters  : value         Lower 90%    Upper 90%
kT [keV]    : 199.363       (-123.36      -199.363)
Norm        : 1.19620       (-0.442986     0.442997)
------------------------------------------------------------
#Fit statistic : Chi-Squared =          55.26 using 59 PHA bins.
# Reduced chi-squared =         0.9694 for     57 degrees of freedom
# Null hypothesis probability =   5.406889e-01

Energy  Fluence     90% Error
[keV]   [erg/cm2]   [erg/cm2]
15- 25  2.979e-09   1.919e-09
25- 50  5.730e-09   3.629e-09
50-150  1.257e-08   7.940e-09
15-150  2.128e-08   1.349e-08
Double BB
------------------------------------------------------------
Parameters  : value         Lower 90%    Upper 90%
kT1 [keV]   : 1.02004E-04        (5.60009e-06      -0.000102004)
R1^2/D10^2  : 8.44322E+05        (-844322      -844322)
kT2 [keV]   : 16.5819        (-4.58404      7.71717)
R2^2/D10^2  : 2.69194E-02    (-0.0269194   0.0542247)
------------------------------------------------------------
#Fit statistic : Chi-Squared =          51.99 using 59 PHA bins.
#Fit statistic : Chi-Squared =          51.88 using 59 PHA bins.
# Reduced chi-squared =         0.9453 for     55 degrees of freedom
# Reduced chi-squared =         0.9433 for     55 degrees of freedom
# Null hypothesis probability =   5.903574e-01
# Null hypothesis probability =   5.944821e-01

Energy  Fluence     90% Error
[keV]   [erg/cm2]   [erg/cm2]
15- 25  1.689e-09   1.105e-09
25- 50  6.896e-09   4.250e-09
50-150  1.139e-08   7.510e-09
15-150  1.997e-08   1.304e-08
Pre-slew spectrum (Pre-slew PHA with pre-slew DRM)
Power-law model
Spectral model in power-law:
------------------------------------------------------------
Parameters  : value       lower 90%   higher 90%
Photon index: 1.56343     ( -0.247072   0.252157 )
Norm@50keV  : 3.73886E-04    ( -5.48472e-05   5.37305e-05 )
------------------------------------------------------------
#Fit statistic : Chi-Squared =          70.07 using 59 PHA bins.
# Reduced chi-squared =          1.229 for     57 degrees of freedom
# Null hypothesis probability =   1.144676e-01

Photon flux (15-150 keV)    in 296.2 sec: 4.75178E-02 ( -0.00640806  0.00641392 ) ph/cm2/s
Energy fluence (15-150 keV)             : 1.04061e-06 ( -1.65735e-07  1.68976e-07 ) ergs/cm2
Cutoff power-law model

Spectral model in the cutoff power-law:
------------------------------------------------------------
Parameters  : value       lower 90%   higher 90%
Photon index: 1.56390     ( -0.250765   0.251191 )
Epeak [keV] : 9999.27      ( -9999.36 -9999.36 )
Norm@50keV  : 3.74599E-04    ( -5.51368e-05   0.000367062 )
------------------------------------------------------------
#Fit statistic : Chi-Squared =          70.08 using 59 PHA bins.
# Reduced chi-squared =          1.251 for     56 degrees of freedom
# Null hypothesis probability =   9.769626e-02

Photon flux (15-150 keV)    in 296.2 sec: 4.75564E-02 ( -0.0064404  0.0063711 ) ph/cm2/s
Energy fluence (15-150 keV)             : 1.04243e-06 ( -1.67628e-07  1.63393e-07 ) ergs/cm2
Band function

Spectral model in the Band function:
------------------------------------------------------------
Parameters  : value       lower 90%   higher 90%
alpha       : 4.79818   ( -4.79818   -4.79818 )
beta        : -1.66727    ( -0.320233   0.286441 )
Epeak [keV] : 24.0065      ( -24.0065 5.46834 )
Norm@50keV   : 38.6367    ( -5.16   240631 )
------------------------------------------------------------
#Fit statistic : Chi-Squared =          69.47 using 59 PHA bins.
# Reduced chi-squared =          1.263 for     55 degrees of freedom
# Null hypothesis probability =   9.061870e-02

Photon flux (15-150 keV)    in 296.2 sec:  (    ) ph/cm2/s
Energy fluence (15-150 keV)             : 0 ( 0  0 ) ergs/cm2
S(25-50 keV) vs. S(50-100 keV) plot
S(25-50 keV)  = 2.65e-07
S(50-100 keV) = 3.59e-07
T90 vs. Hardness ratio plot
T90                                   = 273.567999988794 sec.
Hardness ratio (energy fluence ratio) = 1.35472
Color vs. Color plot
Count Ratio  (25-50 keV) / (15-25 keV) = 1.1445
Count Ratio (50-100 keV) / (15-25 keV) = 0.974935
Mask shadow pattern
IMX = -0.362055904287, IMY = 0.00947300589579
TIME vs. PHA plot around the trigger time
Blue+Cyan dotted lines: Time interval of the scaled map
From 0.000000 to 376.000000
TIME vs. DetID plot around the trigger time
Blue+Cyan dotted lines: Time interval of the scaled map
From 0.000000 to 376.000000
100 us light curve (15-350 keV)
Blue+Cyan dotted lines: Time interval of the scaled map
From 0.000000 to 376.000000
Spacecraft aspect plot
Bright source in the pre-burst/pre-slew/post-slew images
Pre-burst image of 15-350 keV band
Time interval of the image:
-12.099410 119.784000

# RAcent  DECcent POSerr Theta    Phi  PeakCts   SNR AngSep     Name
#  [deg]    [deg]    ['] [deg]  [deg]                   [']
120.6147  33.8741    2.6  22.9   62.5   0.5512   4.5 ------	UNKNOWN
135.0746 -17.6975    2.2  56.5  -11.8   2.2229   5.2 ------	UNKNOWN
196.4520  40.7253    2.8  36.9 -137.9   0.6888   4.1 ------	UNKNOWN
Pre-slew background subtracted image of 15-350 keV band
Time interval of the image:
119.784000 415.956000

# RAcent  DECcent POSerr Theta    Phi  PeakCts   SNR AngSep     Name
#  [deg]    [deg]    ['] [deg]  [deg]                   [']
115.9317  -8.0224    2.7  54.6   13.6   6.8518   4.3 ------	UNKNOWN
164.8090  53.8105    1.8  19.9 -178.3   1.6199   6.3 ------	UNKNOWN
189.8293  40.2014    2.5  32.0 -135.5   1.6003   4.6 ------	UNKNOWN
173.1599   0.3384    2.4  43.4  -64.6   4.8303   4.8 ------	UNKNOWN
Post-slew image of 15-350 keV band
Time interval of the image:
587.900600 963.032300

# RAcent  DECcent POSerr Theta    Phi  PeakCts   SNR AngSep     Name
#  [deg]    [deg]    ['] [deg]  [deg]                   [']
254.3066  35.4265    7.2  25.2  163.2   0.1758   1.6    8.9	Her X-1
268.4244  -1.5687   14.0  59.2 -165.0   0.6225   0.9    7.7	SW J1753.5-0127
239.5464  19.9853    2.5  25.1 -148.2   0.4740   4.6 ------	UNKNOWN
181.2819  19.5229    3.0  41.2  -37.0   0.6712   3.8 ------	UNKNOWN
Plot creation:
Thu Oct  8 20:34:37 EDT 2015