Special notes of this burst
Image
Pre-slew 15.0-50.0 keV image (Event data)

#RAcent DECcent POSerr Theta  Phi  Peak_Cts  SNR Name
340.636 23.707 0.000 19.688 -110.452 0.441 7.557 TRIG_00294974

Image time interval: 0.000 to 64.000 [sec]
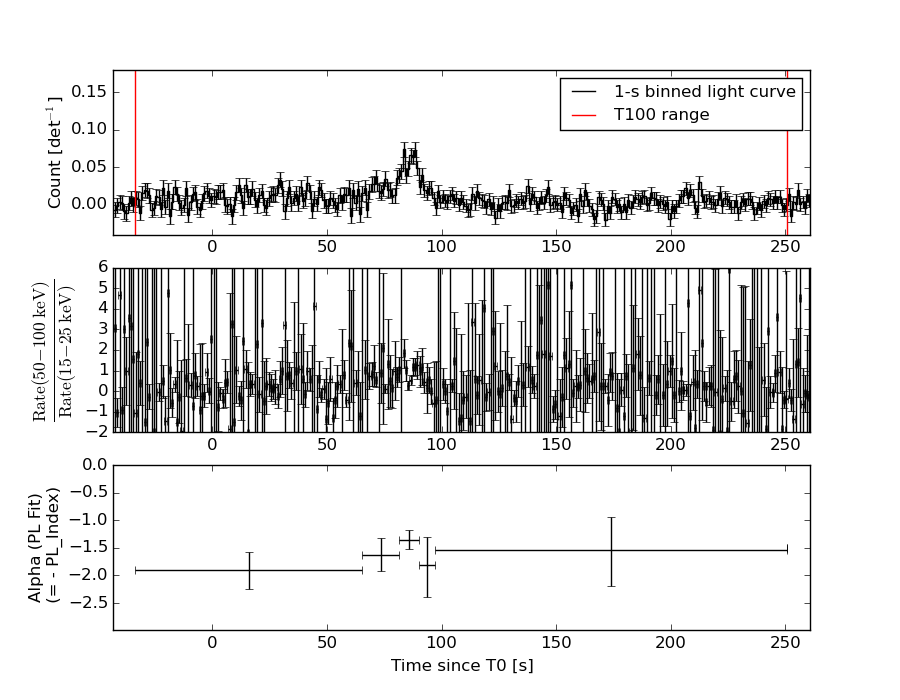
Lightcurves
Notes:
- 1) The mask-weighted light curves are using the flight position.
- 2) Multiple plots of different time binning/intervals are shown to cover all scenarios of short/long GRBs, rate/image triggers, and real/false positives.
- 3) For all the mask-weighted lightcurves, the y-axis units are counts/sec/det where a det is 0.4 x 0.4 = 0.16 sq cm.
- 4) The verticle lines correspond to following: green dotted lines are T50 interval, black dotted lines are T90 interval, blue solid line(s) is a spacecraft slew start time, and orange solid line(s) is a spacecraft slew end time.
- 5) Time of each bin is in the middle of the bin.
1 s binning
From T0-310 s to T0+310 s

From T100_start - 20 s to T100_end + 30 s

Full time interval
64 ms binning
Full time interval
From T100_start to T100_end
From T0-5 sec to T0+5 sec
16 ms binning
From T100_start-5 s to T100_start+5 s

8 ms binning
From T100_start-3 s to T100_start+3 s
2 ms binning
From T100_start-1 s to T100_start+1 s

SN=5 or 10 sec. binning (whichever binning is satisfied first)
SN=5 or 10 sec. binning (T < 200 sec)

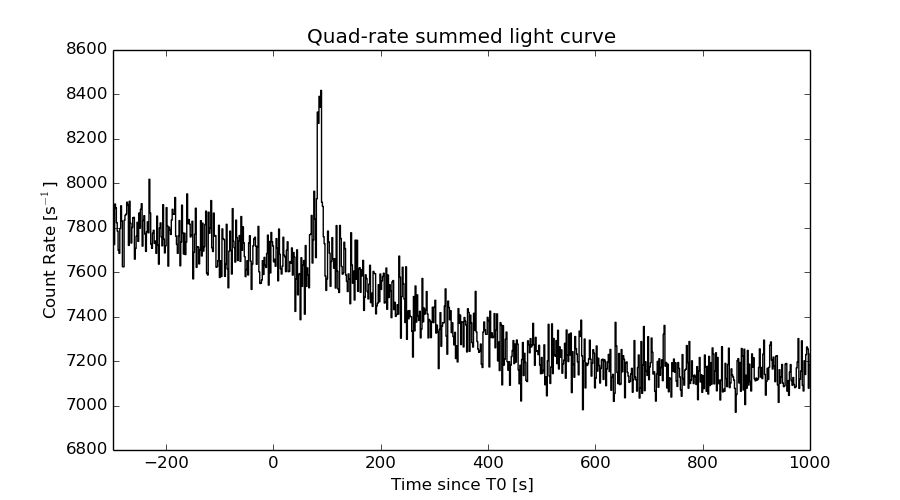
Quad-rate summed light curves (from T0-300s to T0+1000s)
Spectral Evolution
Spectra
Notes:
- 1) The fitting includes the systematic errors.
- 2) When the burst includes telescope slew time periods, the fitting uses an average response file made from multiple 5-s response files through out the slew time plus single time preiod for the non-slew times, and weighted by the total counts in the corresponding time period using addrmf. An average response file is needed becuase a spectral fit using the pre-slew DRM will introduce some errors in both a spectral shape and a normalization if the PHA file contains a lot of the slew/post-slew time interval.
- 3) For fits to more complicated models (e.g. a power-law over a cutoff power-law), the BAT team has decided to require a chi-square improvement of more than 6 for each extra dof.
Time averaged spectrum fit using the average DRM
Power-law model
Time interval is from  -33.576 sec. to  250.760 sec.

Spectral model in power-law:
------------------------------------------------------------
Parameters  : value       lower 90%   higher 90%
Photon index: 1.66394     ( -0.194551   0.20024 )
Norm@50keV  : 5.14322E-04    ( -6.15316e-05   6.02358e-05 )
------------------------------------------------------------
#Fit statistic : Chi-Squared =          79.83 using 59 PHA bins.
# Reduced chi-squared =          1.400 for     57 degrees of freedom
# Null hypothesis probability =   2.467476e-02

Photon flux (15-150 keV)    in 284.3 sec: 6.74697E-02 ( -0.00703878  0.00704117 ) ph/cm2/s
Energy fluence (15-150 keV)             : 1.35807e-06 ( -1.72118e-07  1.75551e-07 ) ergs/cm2
Cutoff power-law model

Time interval is from  -33.576 sec. to  250.760 sec.
Spectral model in the cutoff power-law:
------------------------------------------------------------
Parameters  : value       lower 90%   higher 90%
Photon index: 1.66956     ( -0.200721   0.196822 )
Epeak [keV] : 9999.36      ( -9999.35 -9999.36 )
Norm@50keV  : 5.13290E-04    ( -0.000332395   0.000570298 )
------------------------------------------------------------
#Fit statistic : Chi-Squared =          79.83 using 59 PHA bins.
# Reduced chi-squared =          1.426 for     56 degrees of freedom
# Null hypothesis probability =   1.993181e-02

Photon flux (15-150 keV)    in 284.3 sec: 6.74481E-02 ( -0.0070373  0.0070349 ) ph/cm2/s
Energy fluence (15-150 keV)             : 1.35694e-06 ( -1.82634e-07  1.74074e-07 ) ergs/cm2
Band function
Time interval is from  -33.576 sec. to  250.760 sec.

Spectral model in the Band function:
------------------------------------------------------------
Parameters  : value       lower 90%   higher 90%
alpha       : 4.84281   ( -4.84281   -4.84281 )
beta        : -1.72321    ( -0.233247   0.214619 )
Epeak [keV] : 21.5622      ( -21.5622 4.59165 )
Norm@50keV   : 120.356    ( -12.4965   376535 )
------------------------------------------------------------
#Fit statistic : Chi-Squared =          79.44 using 59 PHA bins.
# Reduced chi-squared =          1.444 for     55 degrees of freedom
# Null hypothesis probability =   1.721043e-02

Photon flux (15-150 keV)    in 284.3 sec:  (    ) ph/cm2/s
Energy fluence (15-150 keV)             : 0 ( 0  0 ) ergs/cm2
Single BB

Spectral model blackbody:
------------------------------------------------------------
Parameters  : value    Lower 90%  Upper 90%
kT [keV]    : 12.2229  (-1.82897  2.22762)
R^2/D10^2   : 1.48450E-02  (-0.00663652   0.0118708)
(R is the radius in km and D10 is the distance to the source in units of 10 kpc)
------------------------------------------------------------
#Fit statistic : Chi-Squared =         110.84 using 59 PHA bins.
# Reduced chi-squared =         1.9446 for     57 degrees of freedom
# Null hypothesis probability =   2.558830e-05

Energy  Fluence     90% Error
[keV]   [erg/cm2]   [erg/cm2]
15- 25  1.335e-07   2.670e-08
25- 50  4.293e-07   6.539e-08
50-150  3.904e-07   1.041e-07
15-150  9.533e-07   1.363e-07
Thermal bremsstrahlung (OTTB)

Spectral model: thermal bremsstrahlung
------------------------------------------------------------
Parameters  : value         Lower 90%    Upper 90%
kT [keV]    : 153.256       (-63.6932      -151.922)
Norm        : 0.276386       (-0.0313161     0.0414413)
------------------------------------------------------------
#Fit statistic : Chi-Squared =          81.19 using 59 PHA bins.
# Reduced chi-squared =          1.424 for     57 degrees of freedom
# Null hypothesis probability =   1.935807e-02

Energy  Fluence     90% Error
[keV]   [erg/cm2]   [erg/cm2]
15- 25  2.014e-07   7.142e-08
25- 50  3.745e-07   1.734e-07
50-150  7.458e-07   4.308e-07
15-150  1.322e-06   6.610e-07
Double BB

Spectral model: bbodyrad<1> + bbodyrad<2>
------------------------------------------------------------
Parameters  : value         Lower 90%    Upper 90%
kT1 [keV]   : 5.64713        (-1.42072      1.79569)
R1^2/D10^2  : 0.179219        (-0.113049      0.350579)
kT2 [keV]   : 24.6102        (-6.25791      13.494)
R2^2/D10^2  : 1.01228E-03    (-0.000768205   0.00188298)
------------------------------------------------------------
#Fit statistic : Chi-Squared =          79.24 using 59 PHA bins.
# Reduced chi-squared =          1.441 for     55 degrees of freedom
# Null hypothesis probability =   1.785831e-02

Energy  Fluence     90% Error
[keV]   [erg/cm2]   [erg/cm2]
15- 25  2.274e-07   9.710e-08
25- 50  3.433e-07   1.135e-07
50-150  7.854e-07   4.235e-07
15-150  1.356e-06   5.267e-07
Peak spectrum fit
Power-law model

Time interval is from   87.304 sec. to   88.304 sec.

Spectral model in power-law:
------------------------------------------------------------
Parameters  : value       lower 90%   higher 90%
Photon index: 1.33510     ( -0.356902   0.358291 )
Norm@50keV  : 5.25181E-03    ( -0.00103992   0.00102795 )
------------------------------------------------------------
#Fit statistic : Chi-Squared =          43.56 using 59 PHA bins.
# Reduced chi-squared =         0.7642 for     57 degrees of freedom
# Null hypothesis probability =   9.049164e-01

Photon flux (15-150 keV)    in 1 sec: 0.630785 ( -0.12205  0.122188 ) ph/cm2/s
Energy fluence (15-150 keV)             : 5.14678e-08 ( -1.15857e-08  1.18633e-08 ) ergs/cm2
Cutoff power-law model

Time interval is from   87.304 sec. to   88.304 sec.
Spectral model in the cutoff power-law:
------------------------------------------------------------
Parameters  : value       lower 90%   higher 90%
Photon index: 1.32049     ( -0.61545   0.366313 )
Epeak [keV] : 9998.00      ( -9999.35 -9999.35 )
Norm@50keV  : 5.28053E-03    ( -0.0010457   0.0133934 )
------------------------------------------------------------
#Fit statistic : Chi-Squared =          43.57 using 59 PHA bins.
# Reduced chi-squared =         0.7780 for     56 degrees of freedom
# Null hypothesis probability =   8.870142e-01

Photon flux (15-150 keV)    in 1 sec: 0.630641 ( -0.121766  0.12203 ) ph/cm2/s
Energy fluence (15-150 keV)             : 5.13703e-08 ( -1.18366e-08  1.18332e-08 ) ergs/cm2
Band function
Time interval is from   87.304 sec. to   88.304 sec.

Spectral model in the Band function:
------------------------------------------------------------
Parameters  : value       lower 90%   higher 90%
alpha       : -1.09800   ( 1.098   1.098 )
beta        : -1.33503    ( 1.33503   0.356876 )
Epeak [keV] : 33.1294      ( -33.1294 -33.1294 )
Norm@50keV   : 1.00740E-02    ( -0.00582633   0.12271 )
------------------------------------------------------------
#Fit statistic : Chi-Squared =          43.56 using 59 PHA bins.
# Reduced chi-squared =         0.7920 for     55 degrees of freedom
# Null hypothesis probability =   8.669756e-01

Photon flux (15-150 keV)    in 1 sec:  (    ) ph/cm2/s
Energy fluence (15-150 keV)             : 0 ( 0  0 ) ergs/cm2
Single BB

Spectral model blackbody:
------------------------------------------------------------
Parameters  : value    Lower 90%  Upper 90%
kT [keV]    : 17.5277  (-4.93914  6.65832)
R^2/D10^2   : 4.22936E-02  (-0.0272774   0.0855504)
(R is the radius in km and D10 is the distance to the source in units of 10 kpc)
------------------------------------------------------------
#Fit statistic : Chi-Squared =          52.78 using 59 PHA bins.
# Reduced chi-squared =         0.9260 for     57 degrees of freedom
# Null hypothesis probability =   6.338560e-01

Energy  Fluence     90% Error
[keV]   [erg/cm2]   [erg/cm2]
15- 25  2.623e-09   1.076e-09
25- 50  1.189e-08   4.775e-09
50-150  2.632e-08   1.138e-08
15-150  4.083e-08   1.643e-08
Thermal bremsstrahlung (OTTB)

Spectral model: thermal bremsstrahlung
------------------------------------------------------------
Parameters  : value         Lower 90%    Upper 90%
kT [keV]    : 199.363       (-88.4427      -199.363)
Norm        : 2.57395       (-0.498115     0.498127)
------------------------------------------------------------
#Fit statistic : Chi-Squared =          44.93 using 59 PHA bins.
# Reduced chi-squared =         0.7882 for     57 degrees of freedom
# Null hypothesis probability =   8.766062e-01

Energy  Fluence     90% Error
[keV]   [erg/cm2]   [erg/cm2]
15- 25  6.409e-09   3.777e-09
25- 50  1.233e-08   7.125e-09
50-150  2.704e-08   1.569e-08
15-150  4.578e-08   2.627e-08
Double BB

Spectral model: bbodyrad<1> + bbodyrad<2>
------------------------------------------------------------
Parameters  : value         Lower 90%    Upper 90%
kT1 [keV]   : 6.21875        (-2.99293      4.28858)
R1^2/D10^2  : 0.966324        (-0.79468      14.0178)
kT2 [keV]   : 29.9785        (-10.9008      75.9821)
R2^2/D10^2  : 6.31363E-03    (-0.00595628   0.00885716)
------------------------------------------------------------
#Fit statistic : Chi-Squared =          43.11 using 59 PHA bins.
# Reduced chi-squared =         0.7838 for     55 degrees of freedom
# Null hypothesis probability =   8.775274e-01

Energy  Fluence     90% Error
[keV]   [erg/cm2]   [erg/cm2]
15- 25  6.106e-09   3.630e-09
25- 50  1.110e-08   5.765e-09
50-150  3.537e-08   2.051e-08
15-150  5.258e-08   2.798e-08
Pre-slew spectrum (Pre-slew PHA with pre-slew DRM)
Power-law model

Spectral model in power-law:
------------------------------------------------------------
Parameters  : value       lower 90%   higher 90%
Photon index: 1.85831     ( -0.285616   0.306852 )
Norm@50keV  : 5.51912E-04    ( -0.000112058   0.000108314 )
------------------------------------------------------------
#Fit statistic : Chi-Squared =          55.05 using 59 PHA bins.
# Reduced chi-squared =         0.9657 for     57 degrees of freedom
# Null hypothesis probability =   5.487319e-01

Photon flux (15-150 keV)    in 105.7 sec: 7.78402E-02 ( -0.0120858  0.0120866 ) ph/cm2/s
Energy fluence (15-150 keV)             : 5.36348e-07 ( -1.05411e-07  1.09957e-07 ) ergs/cm2
Cutoff power-law model
Spectral model in the cutoff power-law:
------------------------------------------------------------
Parameters  : value       lower 90%   higher 90%
Photon index: 1.64121     ( -1.51246   0.729403 )
Epeak [keV] : 65.7498      (   )
Norm@50keV  : 7.45665E-04    (     )
------------------------------------------------------------
#Fit statistic : Chi-Squared =          54.94 using 59 PHA bins.
# Reduced chi-squared =         0.9810 for     56 degrees of freedom
# Null hypothesis probability =   5.151633e-01

Photon flux (15-150 keV)    in 105.7 sec: 7.71855E-02 ( -0.0125396  0.0124575 ) ph/cm2/s
Energy fluence (15-150 keV)             : 5.20044e-07 ( -1.33239e-07  1.23083e-07 ) ergs/cm2
Band function

Spectral model in the Band function:
------------------------------------------------------------
Parameters  : value       lower 90%   higher 90%
alpha       : 4.92462   ( -4.92462   -4.92462 )
beta        : -2.06919    ( -0.539191   0.364565 )
Epeak [keV] : 23.4736      ( -23.4736 4.95799 )
Norm@50keV   : 110.301    ( -16.9679   554680 )
------------------------------------------------------------
#Fit statistic : Chi-Squared =          53.08 using 59 PHA bins.
# Reduced chi-squared =         0.9651 for     55 degrees of freedom
# Null hypothesis probability =   5.483043e-01

Photon flux (15-150 keV)    in 105.7 sec:  (    ) ph/cm2/s
Energy fluence (15-150 keV)             : 0 ( 0  0 ) ergs/cm2
S(25-50 keV) vs. S(50-100 keV) plot
S(25-50 keV)  = 3.62e-07
S(50-100 keV) = 4.57e-07
T90 vs. Hardness ratio plot
T90                                   = 228.719999998808 sec.
Hardness ratio (energy fluence ratio) = 1.26243
Color vs. Color plot

Count Ratio  (25-50 keV) / (15-25 keV) = 1.07623
Count Ratio (50-100 keV) / (15-25 keV) = 0.781596
Mask shadow pattern
IMX = -0.125029431464, IMY = 0.335269144104
TIME vs. PHA plot around the trigger time
TIME vs. DetID plot around the trigger time
100 us light curve (15-350 keV)
Spacecraft aspect plot
Bright source in the pre-burst/pre-slew/post-slew images
Pre-burst image of 15-350 keV band
Time interval of the image:
-239.000000 -33.576000

# RAcent  DECcent POSerr Theta    Phi  PeakCts   SNR AngSep     Name
#  [deg]    [deg]    ['] [deg]  [deg]                   [']
326.2388  38.4340    4.2  35.4  -85.8   1.0555   2.7    7.4	Cyg X-2
Pre-slew background subtracted image of 15-350 keV band
Time interval of the image:
-33.576000 72.100600

# RAcent  DECcent POSerr Theta    Phi  PeakCts   SNR AngSep     Name
#  [deg]    [deg]    ['] [deg]  [deg]                   [']
325.9538  38.2425    5.4  35.6  -86.2   0.5342   2.1   11.3	Cyg X-2
 24.4037 -13.7694    2.4  40.8  110.2   2.2355   4.8 ------	UNKNOWN
 27.6795  13.2835    2.4  25.9   67.0   0.7257   4.9 ------	UNKNOWN
340.5842  23.7503    1.9  19.7 -110.3   0.7807   6.0 ------	UNKNOWN
318.4746  -9.8984    2.2  52.0 -155.8   1.6733   5.2 ------	UNKNOWN
Post-slew image of 15-350 keV band
Time interval of the image:
119.500600 963.050000

# RAcent  DECcent POSerr Theta    Phi  PeakCts   SNR AngSep     Name
#  [deg]    [deg]    ['] [deg]  [deg]                   [']
299.5965  35.2050    0.4  37.2  -71.3  32.1518  31.4    0.4	Cyg X-1
308.0194  40.9181    2.5  32.2  -58.7   2.9377   4.7    4.6	Cyg X-3
326.0053  38.2762    2.8  19.2  -46.0   1.6287   4.1    8.3	Cyg X-2
356.2876 -24.3704    3.1  50.4  152.6   6.8521   3.7 ------	UNKNOWN
  5.0967  64.7180    2.6  44.0    5.9   3.1157   4.5 ------	UNKNOWN
353.0136  52.7670    2.9  30.5    5.9   1.6528   4.0 ------	UNKNOWN
308.0467  37.6466    1.4  31.1  -64.6   5.3379   8.1 ------	UNKNOWN
298.6015  32.1746    3.3  37.8  -76.4   3.9616   3.5 ------	UNKNOWN
299.0447   5.6078    2.4  43.9 -116.5   8.7426   4.9 ------	UNKNOWN
Plot creation:
Thu Oct  8 20:33:07 EDT 2015