Special notes of this burst
Image
Pre-slew 15.0-350.0 keV image (Event data)
#   RAcent    DECcent   POSerr    Theta     Phi              Peak Cts       SNR   Name
  119.8263    21.4700   0.0185    11.4015    -4.0243         0.5115543     10.378 TRIG_00295527

Foreground time interval of the image:
 19.240  48.884 (delta_t =  29.644 [sec])
Background time interval of the image:
-239.000  19.240 (delta_t = 258.240 [sec])
Lightcurves
Notes:
- 1) The mask-weighted light curves are using the flight position.
- 2) Multiple plots of different time binning/intervals are shown to cover all scenarios of short/long GRBs, rate/image triggers, and real/false positives.
- 3) For all the mask-weighted lightcurves, the y-axis units are counts/sec/det where a det is 0.4 x 0.4 = 0.16 sq cm.
- 4) The verticle lines correspond to following: green dotted lines are T50 interval, black dotted lines are T90 interval, blue solid line(s) is a spacecraft slew start time, and orange solid line(s) is a spacecraft slew end time.
- 5) Time of each bin is in the middle of the bin.
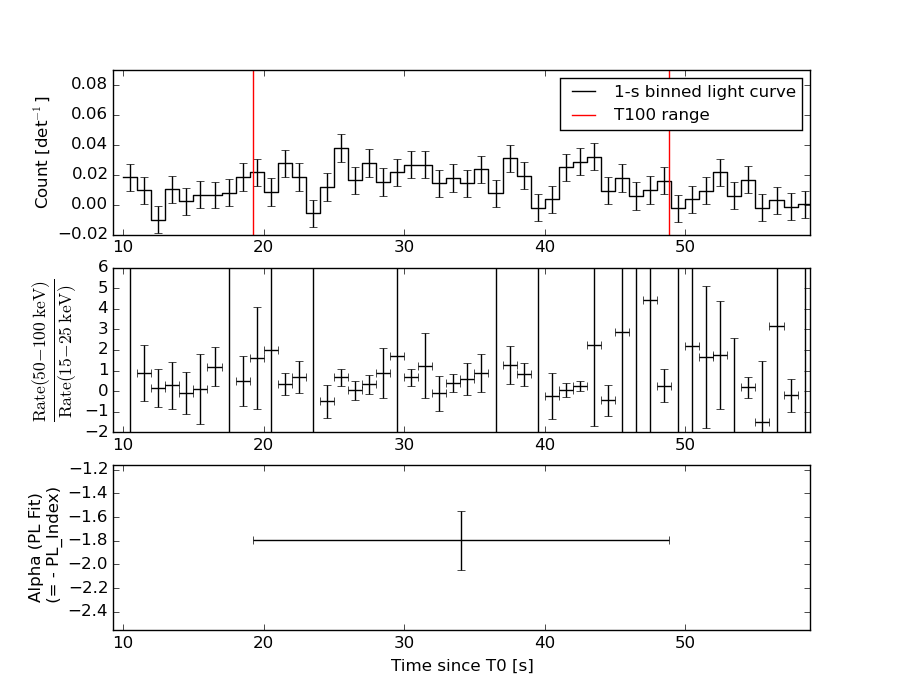
1 s binning
From T0-310 s to T0+310 s

From T100_start - 20 s to T100_end + 30 s

Full time interval

64 ms binning
Full time interval
From T100_start to T100_end

From T0-5 sec to T0+5 sec
16 ms binning
From T100_start-5 s to T100_start+5 s
8 ms binning
From T100_start-3 s to T100_start+3 s
2 ms binning
From T100_start-1 s to T100_start+1 s
SN=5 or 10 sec. binning (whichever binning is satisfied first)
SN=5 or 10 sec. binning (T < 200 sec)

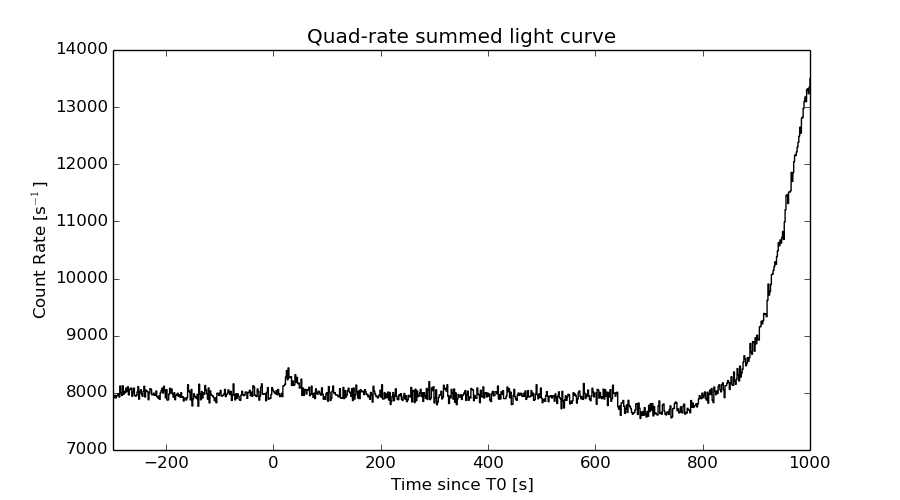
Quad-rate summed light curves (from T0-300s to T0+1000s)
Spectral Evolution
Spectra
Notes:
- 1) The fitting includes the systematic errors.
- 2) When the burst includes telescope slew time periods, the fitting uses an average response file made from multiple 5-s response files through out the slew time plus single time preiod for the non-slew times, and weighted by the total counts in the corresponding time period using addrmf. An average response file is needed becuase a spectral fit using the pre-slew DRM will introduce some errors in both a spectral shape and a normalization if the PHA file contains a lot of the slew/post-slew time interval.
- 3) For fits to more complicated models (e.g. a power-law over a cutoff power-law), the BAT team has decided to require a chi-square improvement of more than 6 for each extra dof.
Time averaged spectrum fit using the average DRM
Power-law model

Time interval is from   19.240 sec. to   48.884 sec.

Spectral model in power-law:
------------------------------------------------------------
Parameters  : value       lower 90%   higher 90%
Photon index: 1.78946     ( -0.239844   0.253905 )
Norm@50keV  : 1.09940E-03    ( -0.000185687   0.000181161 )
------------------------------------------------------------
#Fit statistic : Chi-Squared =          47.64 using 59 PHA bins.
# Reduced chi-squared =         0.8359 for     57 degrees of freedom
# Null hypothesis probability =   8.067659e-01

Photon flux (15-150 keV)    in 29.64 sec: 0.150880 ( -0.0206455  0.0206456 ) ph/cm2/s
Energy fluence (15-150 keV)             : 3.00111e-07 ( -5.08044e-08  5.25369e-08 ) ergs/cm2
Cutoff power-law model

Time interval is from   19.240 sec. to   48.884 sec.
Spectral model in the cutoff power-law:
------------------------------------------------------------
Parameters  : value       lower 90%   higher 90%
Photon index: 0.735859     ( -1.5698   1.12079 )
Epeak [keV] : 49.0306      ( -12.3017 -49.029 )
Norm@50keV  : 4.54794E-03    ( -0.00454896   0.0343789 )
------------------------------------------------------------
#Fit statistic : Chi-Squared =          45.15 using 59 PHA bins.
# Reduced chi-squared =         0.8062 for     56 degrees of freedom
# Null hypothesis probability =   8.500175e-01

Photon flux (15-150 keV)    in 29.64 sec: 0.145213 ( -0.021364  0.021472 ) ph/cm2/s
Energy fluence (15-150 keV)             : 2.66012e-07 ( -5.4398e-08  6.27879e-08 ) ergs/cm2
Band function

Time interval is from   19.240 sec. to   48.884 sec.

Spectral model in the Band function:
------------------------------------------------------------
Parameters  : value       lower 90%   higher 90%
alpha       : -0.165955   ( -0.178732   -0.178732 )
beta        : -2.36368    ( 2.3521   0.607853 )
Epeak [keV] : 41.3610      ( -39.6008 116.824 )
Norm@50keV   : 1.10285E-02    ( -0.0108648   99.5407 )
------------------------------------------------------------
#Fit statistic : Chi-Squared =          44.94 using 59 PHA bins.
# Reduced chi-squared =         0.8170 for     55 degrees of freedom
# Null hypothesis probability =   8.315979e-01

Photon flux (15-150 keV)    in 29.64 sec:  (    ) ph/cm2/s
Energy fluence (15-150 keV)             : 2.70488e-07 ( 0  0 ) ergs/cm2
Single BB

Spectral model blackbody:
------------------------------------------------------------
Parameters  : value    Lower 90%  Upper 90%
kT [keV]    : 10.6737  (-1.50487  1.79451)
R^2/D10^2   : 5.74402E-02  (-0.0252898   0.043581)
(R is the radius in km and D10 is the distance to the source in units of 10 kpc)
------------------------------------------------------------
#Fit statistic : Chi-Squared =          50.15 using 59 PHA bins.
# Reduced chi-squared =         0.8797 for     57 degrees of freedom
# Null hypothesis probability =   7.279365e-01

Energy  Fluence     90% Error
[keV]   [erg/cm2]   [erg/cm2]
15- 25  4.026e-08   9.627e-09
25- 50  1.094e-07   2.189e-08
50-150  6.879e-08   2.558e-08
15-150  2.185e-07   4.281e-08
Thermal bremsstrahlung (OTTB)

Spectral model: thermal bremsstrahlung
------------------------------------------------------------
Parameters  : value         Lower 90%    Upper 90%
kT [keV]    : 89.9466       (-33.9453      82.251)
Norm        : 0.689834       (-0.121111     0.156121)
------------------------------------------------------------
#Fit statistic : Chi-Squared =          45.71 using 59 PHA bins.
# Reduced chi-squared =         0.8019 for     57 degrees of freedom
# Null hypothesis probability =   8.584009e-01

Energy  Fluence     90% Error
[keV]   [erg/cm2]   [erg/cm2]
15- 25  5.335e-08   1.077e-08
25- 50  9.022e-08   1.632e-08
50-150  1.373e-07   7.317e-08
15-150  2.809e-07   9.642e-08
Double BB

Spectral model: bbodyrad<1> + bbodyrad<2>
------------------------------------------------------------
Parameters  : value         Lower 90%    Upper 90%
kT1 [keV]   : 6.79614        (-5.51832      4.13143)
R1^2/D10^2  : 0.183918        (-0.118376      663.475)
kT2 [keV]   : 18.0091        (-15.9873      -18.6905)
R2^2/D10^2  : 5.21066E-03    (-0.004158   0.0542468)
------------------------------------------------------------
#Fit statistic : Chi-Squared =          45.72 using 59 PHA bins.
# Reduced chi-squared =         0.8313 for     55 degrees of freedom
# Null hypothesis probability =   8.092595e-01

Energy  Fluence     90% Error
[keV]   [erg/cm2]   [erg/cm2]
15- 25  4.921e-08   2.681e-08
25- 50  9.704e-08   5.186e-08
50-150  1.168e-07   7.057e-08
15-150  2.630e-07   1.321e-07
Peak spectrum fit
Power-law model

Time interval is from   41.752 sec. to   42.752 sec.

Spectral model in power-law:
------------------------------------------------------------
Parameters  : value       lower 90%   higher 90%
Photon index: 2.26065     ( -0.741752   1.0399 )
Norm@50keV  : 1.68410E-03    ( -0.00105366   0.00104396 )
------------------------------------------------------------
#Fit statistic : Chi-Squared =          61.35 using 59 PHA bins.
# Reduced chi-squared =          1.076 for     57 degrees of freedom
# Null hypothesis probability =   3.227601e-01

Photon flux (15-150 keV)    in 1 sec: 0.288003 ( -0.106646  0.107216 ) ph/cm2/s
Energy fluence (15-150 keV)             : 1.59825e-08 ( -7.72781e-09  9.16112e-09 ) ergs/cm2
Cutoff power-law model

Time interval is from   41.752 sec. to   42.752 sec.
Spectral model in the cutoff power-law:
------------------------------------------------------------
Parameters  : value       lower 90%   higher 90%
Photon index: 1.98656     (     )
Epeak [keV] : 1.97100      (   )
Norm@50keV  : 2.45238E-03    (     )
------------------------------------------------------------
#Fit statistic : Chi-Squared =          61.44 using 59 PHA bins.
# Reduced chi-squared =          1.097 for     56 degrees of freedom
# Null hypothesis probability =   2.875622e-01

Photon flux (15-150 keV)    in 1 sec: 0.287655 ( -0.106377  0.106422 ) ph/cm2/s
Energy fluence (15-150 keV)             : 1.5959e-08 ( -8.82694e-09  9.0073e-09 ) ergs/cm2
Band function
Time interval is from   41.752 sec. to   42.752 sec.

Spectral model in the Band function:
------------------------------------------------------------
Parameters  : value       lower 90%   higher 90%
alpha       : -1.27050   ( -0.72911   1.2705 )
beta        : -2.26063    ( -1.04205   0.742205 )
Epeak [keV] : 1.09744      ( -1.09744 -1.09744 )
Norm@50keV   : 0.146973    ( -0.146973   1.18164e+06 )
------------------------------------------------------------
#Fit statistic : Chi-Squared =          61.35 using 59 PHA bins.
# Reduced chi-squared =          1.116 for     55 degrees of freedom
# Null hypothesis probability =   2.588060e-01

Photon flux (15-150 keV)    in 1 sec:  (    ) ph/cm2/s
Energy fluence (15-150 keV)             : 0 ( 0  0 ) ergs/cm2
Single BB

Spectral model blackbody:
------------------------------------------------------------
Parameters  : value    Lower 90%  Upper 90%
kT [keV]    : 6.33461  (-2.2655  3.71761)
R^2/D10^2   : 0.804904  (-0.803748   4.51344)
(R is the radius in km and D10 is the distance to the source in units of 10 kpc)
------------------------------------------------------------
#Fit statistic : Chi-Squared =          62.67 using 59 PHA bins.
# Reduced chi-squared =          1.100 for     57 degrees of freedom
# Null hypothesis probability =   2.821136e-01

Energy  Fluence     90% Error
[keV]   [erg/cm2]   [erg/cm2]
15- 25  4.621e-09   2.851e-09
25- 50  5.174e-09   3.435e-09
50-150  5.889e-10   5.510e-10
15-150  1.038e-08   6.420e-09
Thermal bremsstrahlung (OTTB)

Spectral model: thermal bremsstrahlung
------------------------------------------------------------
Parameters  : value         Lower 90%    Upper 90%
kT [keV]    : 36.6652       (-36.7108      -36.7108)
Norm        : 1.96406       (-1.04316     3.5209)
------------------------------------------------------------
#Fit statistic : Chi-Squared =          61.72 using 59 PHA bins.
# Reduced chi-squared =          1.083 for     57 degrees of freedom
# Null hypothesis probability =   3.112646e-01

Energy  Fluence     90% Error
[keV]   [erg/cm2]   [erg/cm2]
15- 25  4.371e-09   2.742e-09
25- 50  5.530e-09   3.617e-09
50-150  3.879e-09   3.232e-09
15-150  1.378e-08   9.380e-09
Double BB

Spectral model: bbodyrad<1> + bbodyrad<2>
------------------------------------------------------------
Parameters  : value         Lower 90%    Upper 90%
kT1 [keV]   : 5.32366        (-5.32828      3.27396)
R1^2/D10^2  : 1.47754        (-1.47509      -1.47509)
kT2 [keV]   : 32.8162        (-32.9983      -32.9983)
R2^2/D10^2  : 1.15197E-03    (-0.00113665   1.94782)
------------------------------------------------------------
#Fit statistic : Chi-Squared =          60.64 using 59 PHA bins.
# Reduced chi-squared =          1.103 for     55 degrees of freedom
# Null hypothesis probability =   2.798485e-01

Energy  Fluence     90% Error
[keV]   [erg/cm2]   [erg/cm2]
15- 25  4.772e-09   3.009e-09
25- 50  4.658e-09   2.480e-09
50-150  8.748e-09   7.170e-09
15-150  1.818e-08   1.009e-08
Pre-slew spectrum (Pre-slew PHA with pre-slew DRM)
Power-law model

Spectral model in power-law:
------------------------------------------------------------
Parameters  : value       lower 90%   higher 90%
Photon index: 1.78946     ( -0.239844   0.253905 )
Norm@50keV  : 1.09940E-03    ( -0.000185687   0.000181161 )
------------------------------------------------------------
#Fit statistic : Chi-Squared =          47.64 using 59 PHA bins.
# Reduced chi-squared =         0.8359 for     57 degrees of freedom
# Null hypothesis probability =   8.067659e-01

Photon flux (15-150 keV)    in 29.64 sec: 0.150880 ( -0.0206455  0.0206456 ) ph/cm2/s
Energy fluence (15-150 keV)             : 3.00111e-07 ( -5.08044e-08  5.25369e-08 ) ergs/cm2
Cutoff power-law model

Spectral model in the cutoff power-law:
------------------------------------------------------------
Parameters  : value       lower 90%   higher 90%
Photon index: 0.735859     ( -1.5698   1.12079 )
Epeak [keV] : 49.0306      ( -12.3017 -49.029 )
Norm@50keV  : 4.54794E-03    ( -0.00454896   0.0343789 )
------------------------------------------------------------
#Fit statistic : Chi-Squared =          45.15 using 59 PHA bins.
# Reduced chi-squared =         0.8062 for     56 degrees of freedom
# Null hypothesis probability =   8.500175e-01

Photon flux (15-150 keV)    in 29.64 sec: 0.145213 ( -0.021364  0.021472 ) ph/cm2/s
Energy fluence (15-150 keV)             : 2.66012e-07 ( -5.4398e-08  6.27879e-08 ) ergs/cm2
Band function

Spectral model in the Band function:
------------------------------------------------------------
Parameters  : value       lower 90%   higher 90%
alpha       : -0.165955   ( -0.178732   -0.178732 )
beta        : -2.36368    ( 2.3521   0.607853 )
Epeak [keV] : 41.3610      ( -39.6008 129.433 )
Norm@50keV   : 1.10285E-02    ( -0.0108648   99.5407 )
------------------------------------------------------------
#Fit statistic : Chi-Squared =          44.94 using 59 PHA bins.
# Reduced chi-squared =         0.8170 for     55 degrees of freedom
# Null hypothesis probability =   8.315979e-01

Photon flux (15-150 keV)    in 29.64 sec:  (    ) ph/cm2/s
Energy fluence (15-150 keV)             : 2.70488e-07 ( 0  0 ) ergs/cm2
S(25-50 keV) vs. S(50-100 keV) plot
S(25-50 keV)  = 8.42e-08
S(50-100 keV) = 9.74e-08
T90 vs. Hardness ratio plot
T90                                   = 26.8560000061989 sec.
Hardness ratio (energy fluence ratio) = 1.15677
Color vs. Color plot
Count Ratio  (25-50 keV) / (15-25 keV) = 1.21964
Count Ratio (50-100 keV) / (15-25 keV) = 0.564313
Mask shadow pattern

IMX = 2.011658195984532E-01, IMY = 1.415253510473943E-02
TIME vs. PHA plot around the trigger time

TIME vs. DetID plot around the trigger time
100 us light curve (15-350 keV)
Spacecraft aspect plot

Bright source in the pre-burst/pre-slew/post-slew images
Pre-burst image of 15-350 keV band
Time interval of the image:
-239.000000 19.240000

# RAcent  DECcent POSerr Theta    Phi  PeakCts   SNR AngSep     Name
#  [deg]    [deg]    ['] [deg]  [deg]                   [']
 83.6301  22.0265    0.4  33.6   77.2  10.7364  26.4    0.7	Crab
 81.5688  12.8516    2.5  40.1   65.9   3.3711   4.6 ------	UNKNOWN
 70.1038  49.8266    2.8  40.0  126.9   2.3308   4.1 ------	UNKNOWN
 65.0647  66.3380    2.7  46.2  149.8   2.2964   4.3 ------	UNKNOWN
160.7959  15.0240    4.1  41.3  -77.7   2.4088   2.8 ------	UNKNOWN
Pre-slew background subtracted image of 15-350 keV band
Time interval of the image:
19.240000 48.884000

# RAcent  DECcent POSerr Theta    Phi  PeakCts   SNR AngSep     Name
#  [deg]    [deg]    ['] [deg]  [deg]                   [']
 83.7536  22.1660    0.0  33.4   77.3  -0.1459  -1.2   11.3	Crab
119.8263  21.4700    1.1  11.4   -4.0   0.5115  10.4 ------	UNKNOWN
186.8089  77.5720    2.0  53.1 -168.9   0.8462   5.8 ------	UNKNOWN
150.8875  33.1480    2.6  26.1 -102.5   0.3158   4.5 ------	UNKNOWN
Post-slew image of 15-350 keV band
Time interval of the image:
106.900600 758.600590

# RAcent  DECcent POSerr Theta    Phi  PeakCts   SNR AngSep     Name
#  [deg]    [deg]    ['] [deg]  [deg]                   [']
 83.6328  22.0129    0.4  33.6   86.7  22.9678  27.3    0.1	Crab
 90.3696  63.9695    3.2  46.8  151.7   4.2878   3.6 ------	UNKNOWN
172.4131  71.9216    3.5  58.4 -174.3   6.9140   3.4 ------	UNKNOWN
172.9109  71.6556    3.3  58.4 -173.9   8.8754   4.2 ------	UNKNOWN
181.2965  47.7526    6.8  55.2 -145.1   4.8551   1.7 ------	UNKNOWN
Plot creation:
Sun May 31 08:48:38 EDT 2015