Special notes of this burst
Image
Pre-slew 15.0-350.0 keV image (Event data)
#   RAcent    DECcent   POSerr    Theta     Phi              Peak Cts       SNR   Name
   48.1938    62.5434   0.0214    12.8028  -126.0849         0.1860988      8.953 TRIG_00295779

Foreground time interval of the image:
 -1.552   3.624 (delta_t =   5.176 [sec])
Background time interval of the image:
-420.527 -325.830 (delta_t =  94.698 [sec])
-239.928  -1.552 (delta_t = 238.376 [sec])
Lightcurves
Notes:
- 1) The mask-weighted light curves are using the flight position.
- 2) Multiple plots of different time binning/intervals are shown to cover all scenarios of short/long GRBs, rate/image triggers, and real/false positives.
- 3) For all the mask-weighted lightcurves, the y-axis units are counts/sec/det where a det is 0.4 x 0.4 = 0.16 sq cm.
- 4) The verticle lines correspond to following: green dotted lines are T50 interval, black dotted lines are T90 interval, blue solid line(s) is a spacecraft slew start time, and orange solid line(s) is a spacecraft slew end time.
- 5) Time of each bin is in the middle of the bin.
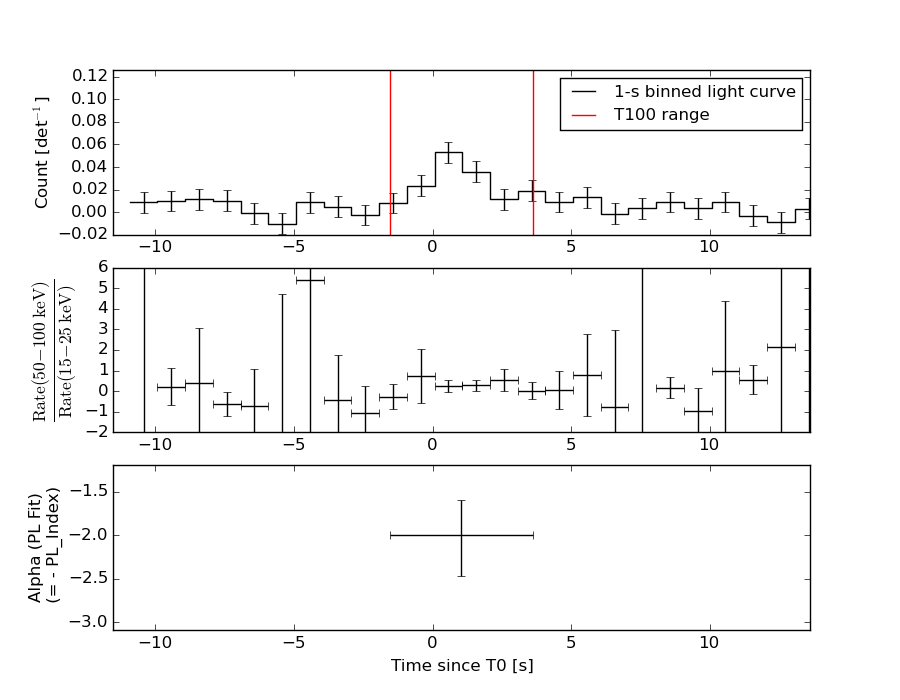
1 s binning
From T0-310 s to T0+310 s
From T100_start - 20 s to T100_end + 30 s
Full time interval
64 ms binning
Full time interval
From T100_start to T100_end
From T0-5 sec to T0+5 sec
16 ms binning
From T100_start-5 s to T100_start+5 s
Blue+Cyan dotted lines: Time interval of the scaled map
From 0.000000 to 2.048000
8 ms binning
From T100_start-3 s to T100_start+3 s

Blue+Cyan dotted lines: Time interval of the scaled map
From 0.000000 to 2.048000
2 ms binning
From T100_start-1 s to T100_start+1 s
Blue+Cyan dotted lines: Time interval of the scaled map
From 0.000000 to 2.048000
SN=5 or 10 sec. binning (whichever binning is satisfied first)

SN=5 or 10 sec. binning (T < 200 sec)
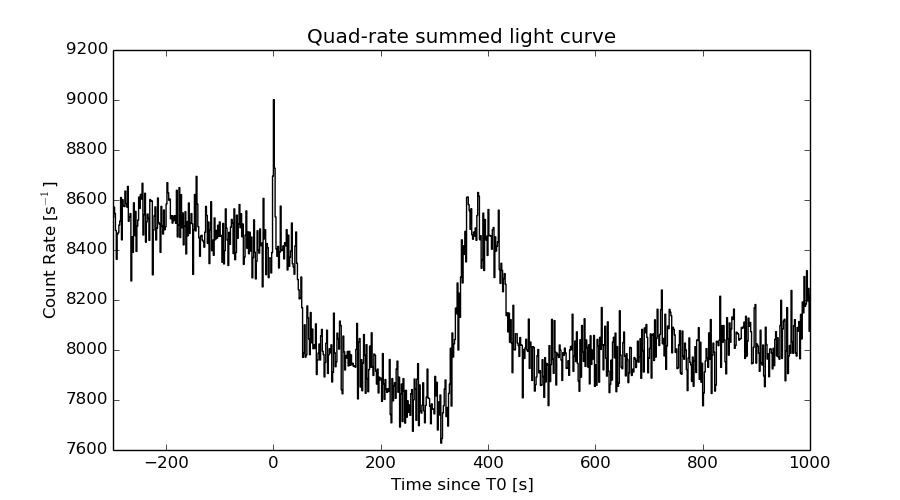
Quad-rate summed light curves (from T0-300s to T0+1000s)
Spectral Evolution
Spectra
Notes:
- 1) The fitting includes the systematic errors.
- 2) When the burst includes telescope slew time periods, the fitting uses an average response file made from multiple 5-s response files through out the slew time plus single time preiod for the non-slew times, and weighted by the total counts in the corresponding time period using addrmf. An average response file is needed becuase a spectral fit using the pre-slew DRM will introduce some errors in both a spectral shape and a normalization if the PHA file contains a lot of the slew/post-slew time interval.
- 3) For fits to more complicated models (e.g. a power-law over a cutoff power-law), the BAT team has decided to require a chi-square improvement of more than 6 for each extra dof.
Time averaged spectrum fit using the average DRM
Power-law model

Time interval is from   -1.552 sec. to    3.624 sec.

Spectral model in power-law:
------------------------------------------------------------
Parameters  : value       lower 90%   higher 90%
Photon index: 2.00180     ( -0.40935   0.471111 )
Norm@50keV  : 1.47000E-03    ( -0.000471453   0.000454014 )
------------------------------------------------------------
#Fit statistic : Chi-Squared =          37.16 using 59 PHA bins.
# Reduced chi-squared =         0.6519 for     57 degrees of freedom
# Null hypothesis probability =   9.806735e-01

Photon flux (15-150 keV)    in 5.176 sec: 0.220683 ( -0.0498332  0.0498764 ) ph/cm2/s
Energy fluence (15-150 keV)             : 7.01731e-08 ( -2.01894e-08  2.16615e-08 ) ergs/cm2
Cutoff power-law model

Time interval is from   -1.552 sec. to    3.624 sec.
Spectral model in the cutoff power-law:
------------------------------------------------------------
Parameters  : value       lower 90%   higher 90%
Photon index: 0.818374     ( -2.95568   1.31508 )
Epeak [keV] : 37.6580      ( -37.658 -37.658 )
Norm@50keV  : 7.88848E-03    ( -0.00788856   0.603908 )
------------------------------------------------------------
#Fit statistic : Chi-Squared =          36.13 using 59 PHA bins.
# Reduced chi-squared =         0.6453 for     56 degrees of freedom
# Null hypothesis probability =   9.819378e-01

Photon flux (15-150 keV)    in 5.176 sec: 0.213300 ( -0.049676  0.050837 ) ph/cm2/s
Energy fluence (15-150 keV)             : 6.14231e-08 ( -1.87927e-08  2.56895e-08 ) ergs/cm2
Band function

Time interval is from   -1.552 sec. to    3.624 sec.

Spectral model in the Band function:
------------------------------------------------------------
Parameters  : value       lower 90%   higher 90%
alpha       : -0.874942   ( 1.43741   1.43741 )
beta        : -9.98508    ( 9.964   19.964 )
Epeak [keV] : 37.6784      ( -14.395 -37.6749 )
Norm@50keV   : 7.28349E-03    ( -0.00728578   0.79402 )
------------------------------------------------------------
#Fit statistic : Chi-Squared =          36.14 using 59 PHA bins.
# Reduced chi-squared =         0.6570 for     55 degrees of freedom
# Null hypothesis probability =   9.768746e-01

Photon flux (15-150 keV)    in 5.176 sec:  (    ) ph/cm2/s
Energy fluence (15-150 keV)             : 0 ( 0  0 ) ergs/cm2
Single BB
Spectral model blackbody:
------------------------------------------------------------
Parameters  : value    Lower 90%  Upper 90%
kT [keV]    : 9.21680  (-2.09322  2.70337)
R^2/D10^2   : 0.145331  (-0.0910927   0.242128)
(R is the radius in km and D10 is the distance to the source in units of 10 kpc)
------------------------------------------------------------
#Fit statistic : Chi-Squared =          38.11 using 59 PHA bins.
# Reduced chi-squared =         0.6686 for     57 degrees of freedom
# Null hypothesis probability =   9.743758e-01

Energy  Fluence     90% Error
[keV]   [erg/cm2]   [erg/cm2]
15- 25  1.259e-08   5.391e-09
25- 50  2.776e-08   1.236e-08
50-150  1.139e-08   7.044e-09
15-150  5.174e-08   2.195e-08
Thermal bremsstrahlung (OTTB)
Spectral model: thermal bremsstrahlung
------------------------------------------------------------
Parameters  : value         Lower 90%    Upper 90%
kT [keV]    : 58.7934       (-27.9261      87.7804)
Norm        : 1.17813       (-0.364542     0.562507)
------------------------------------------------------------
#Fit statistic : Chi-Squared =          36.28 using 59 PHA bins.
# Reduced chi-squared =         0.6365 for     57 degrees of freedom
# Null hypothesis probability =   9.853174e-01

Energy  Fluence     90% Error
[keV]   [erg/cm2]   [erg/cm2]
15- 25  1.527e-08   6.263e-09
25- 50  2.310e-08   1.176e-08
50-150  2.584e-08   1.791e-08
15-150  6.422e-08   3.113e-08
Double BB
Spectral model: bbodyrad<1> + bbodyrad<2>
------------------------------------------------------------
Parameters  : value         Lower 90%    Upper 90%
kT1 [keV]   : 4.51527        (-4.51527      -4.51527)
R1^2/D10^2  : 1.12972        (-1.12328      -1.12972)
kT2 [keV]   : 12.8441        (-12.8442      -12.8442)
R2^2/D10^2  : 3.13715E-02    (-0.031371   0.202907)
------------------------------------------------------------
#Fit statistic : Chi-Squared =          36.07 using 59 PHA bins.
# Reduced chi-squared =         0.6558 for     55 degrees of freedom
# Null hypothesis probability =   9.773441e-01

Energy  Fluence     90% Error
[keV]   [erg/cm2]   [erg/cm2]
15- 25  1.497e-08   8.447e-09
25- 50  2.399e-08   1.300e-08
50-150  2.011e-08   1.259e-08
15-150  5.907e-08   3.108e-08
Peak spectrum fit
Power-law model
Time interval is from   -0.208 sec. to    0.792 sec.

Spectral model in power-law:
------------------------------------------------------------
Parameters  : value       lower 90%   higher 90%
Photon index: 1.52382     ( -0.400995   0.413482 )
Norm@50keV  : 3.71871E-03    ( -0.00100002   0.00097964 )
------------------------------------------------------------
#Fit statistic : Chi-Squared =          56.97 using 59 PHA bins.
# Reduced chi-squared =         0.9995 for     57 degrees of freedom
# Null hypothesis probability =   4.760547e-01

Photon flux (15-150 keV)    in 1 sec: 0.467273 ( -0.115432  0.115474 ) ph/cm2/s
Energy fluence (15-150 keV)             : 3.51487e-08 ( -1.00489e-08  1.05013e-08 ) ergs/cm2
Cutoff power-law model
Time interval is from   -0.208 sec. to    0.792 sec.
Spectral model in the cutoff power-law:
------------------------------------------------------------
Parameters  : value       lower 90%   higher 90%
Photon index: -0.495789     ( -3.62135   2.15152 )
Epeak [keV] : 51.1501      ( -13.6767 74.7415 )
Norm@50keV  : 5.45990E-02    ( -0.0555158   6.24083 )
------------------------------------------------------------
#Fit statistic : Chi-Squared =          54.62 using 59 PHA bins.
# Reduced chi-squared =         0.9753 for     56 degrees of freedom
# Null hypothesis probability =   5.272995e-01

Photon flux (15-150 keV)    in 1 sec: 0.437675 ( -0.116331  0.11932 ) ph/cm2/s
Energy fluence (15-150 keV)             : 2.8295e-08 ( -8.9997e-09  1.25498e-08 ) ergs/cm2
Band function

Time interval is from   -0.208 sec. to    0.792 sec.

Spectral model in the Band function:
------------------------------------------------------------
Parameters  : value       lower 90%   higher 90%
alpha       : 4.98564   ( -14.6107   -4.98564 )
beta        : -1.91032    ( -1.10264   0.551116 )
Epeak [keV] : 28.7918      ( -9.91728 9.93708 )
Norm@50keV   : 190.349    ( -45.3919   2296.26 )
------------------------------------------------------------
#Fit statistic : Chi-Squared =          53.82 using 59 PHA bins.
# Reduced chi-squared =         0.9785 for     55 degrees of freedom
# Null hypothesis probability =   5.197866e-01

Photon flux (15-150 keV)    in 1 sec:  (    ) ph/cm2/s
Energy fluence (15-150 keV)             : 3.05022e-08 ( 0  0 ) ergs/cm2
Single BB
Spectral model blackbody:
------------------------------------------------------------
Parameters  : value    Lower 90%  Upper 90%
kT [keV]    : 12.1962  (-2.70193  3.73198)
R^2/D10^2   : 0.116391  (-0.0725223   0.169657)
(R is the radius in km and D10 is the distance to the source in units of 10 kpc)
------------------------------------------------------------
#Fit statistic : Chi-Squared =          54.96 using 59 PHA bins.
# Reduced chi-squared =         0.9643 for     57 degrees of freedom
# Null hypothesis probability =   5.518492e-01

Energy  Fluence     90% Error
[keV]   [erg/cm2]   [erg/cm2]
15- 25  3.666e-09   1.614e-09
25- 50  1.176e-08   4.802e-09
50-150  1.063e-08   5.901e-09
15-150  2.605e-08   1.242e-08
Thermal bremsstrahlung (OTTB)
Spectral model: thermal bremsstrahlung
------------------------------------------------------------
Parameters  : value         Lower 90%    Upper 90%
kT [keV]    : 166.633       (-104.662      -166.36)
Norm        : 1.94374       (-0.486197     0.640932)
------------------------------------------------------------
#Fit statistic : Chi-Squared =          56.20 using 59 PHA bins.
# Reduced chi-squared =         0.9860 for     57 degrees of freedom
# Null hypothesis probability =   5.050509e-01

Energy  Fluence     90% Error
[keV]   [erg/cm2]   [erg/cm2]
15- 25  4.943e-09   2.890e-09
25- 50  9.298e-09   5.235e-09
50-150  1.913e-08   1.182e-08
15-150  3.338e-08   1.966e-08
Double BB
Spectral model: bbodyrad<1> + bbodyrad<2>
------------------------------------------------------------
Parameters  : value         Lower 90%    Upper 90%
kT1 [keV]   : 10.9701        (-10.9669      3.76425)
R1^2/D10^2  : 0.156732        (-0.157093      1.05792)
kT2 [keV]   : 198.240        (-198.518      -198.518)
R2^2/D10^2  : 3.62315E-05    (-3.606e-05   0.220932)
------------------------------------------------------------
#Fit statistic : Chi-Squared =          53.63 using 59 PHA bins.
# Reduced chi-squared =         0.9751 for     55 degrees of freedom
# Null hypothesis probability =   5.271316e-01

Energy  Fluence     90% Error
[keV]   [erg/cm2]   [erg/cm2]
15- 25  3.985e-09   2.340e-09
25- 50  1.149e-08   7.010e-09
50-150  1.705e-08   7.070e-09
15-150  3.253e-08   1.624e-08
Pre-slew spectrum (Pre-slew PHA with pre-slew DRM)
Power-law model
Spectral model in power-law:
------------------------------------------------------------
Parameters  : value       lower 90%   higher 90%
Photon index: 2.00180     ( -0.40935   0.471111 )
Norm@50keV  : 1.47000E-03    ( -0.000471453   0.000454014 )
------------------------------------------------------------
#Fit statistic : Chi-Squared =          37.16 using 59 PHA bins.
# Reduced chi-squared =         0.6519 for     57 degrees of freedom
# Null hypothesis probability =   9.806735e-01

Photon flux (15-150 keV)    in 5.176 sec: 0.220683 ( -0.0498332  0.0498764 ) ph/cm2/s
Energy fluence (15-150 keV)             : 7.01731e-08 ( -2.01894e-08  2.16615e-08 ) ergs/cm2
Cutoff power-law model
Spectral model in the cutoff power-law:
------------------------------------------------------------
Parameters  : value       lower 90%   higher 90%
Photon index: 0.818374     ( -2.95568   1.31498 )
Epeak [keV] : 37.6580      ( -37.658 -37.658 )
Norm@50keV  : 7.88848E-03    ( -0.00788856   0.603908 )
------------------------------------------------------------
#Fit statistic : Chi-Squared =          36.13 using 59 PHA bins.
# Reduced chi-squared =         0.6453 for     56 degrees of freedom
# Null hypothesis probability =   9.819378e-01

Photon flux (15-150 keV)    in 5.176 sec: 0.213300 ( -0.049676  0.050837 ) ph/cm2/s
Energy fluence (15-150 keV)             : 6.14231e-08 ( -1.87927e-08  2.56895e-08 ) ergs/cm2
Band function

Spectral model in the Band function:
------------------------------------------------------------
Parameters  : value       lower 90%   higher 90%
alpha       : -0.874942   ( 1.43741   1.43741 )
beta        : -9.98508    ( 9.964   19.964 )
Epeak [keV] : 37.6784      ( -14.395 -37.6749 )
Norm@50keV   : 7.28349E-03    ( -0.00728578   0.794059 )
------------------------------------------------------------
#Fit statistic : Chi-Squared =          36.14 using 59 PHA bins.
# Reduced chi-squared =         0.6570 for     55 degrees of freedom
# Null hypothesis probability =   9.768746e-01

Photon flux (15-150 keV)    in 5.176 sec:  (    ) ph/cm2/s
Energy fluence (15-150 keV)             : 0 ( 0  0 ) ergs/cm2
S(25-50 keV) vs. S(50-100 keV) plot
S(25-50 keV)  = 2.11e-08
S(50-100 keV) = 2.11e-08
T90 vs. Hardness ratio plot
T90                                   = 4.824000030756 sec.
Hardness ratio (energy fluence ratio) = 1
Color vs. Color plot
Count Ratio  (25-50 keV) / (15-25 keV) = 1.16906
Count Ratio (50-100 keV) / (15-25 keV) = 0.443083
Mask shadow pattern
IMX = -1.338434368322440E-01, IMY = 1.836470600866191E-01
TIME vs. PHA plot around the trigger time
Blue+Cyan dotted lines: Time interval of the scaled map
From 0.000000 to 2.048000
TIME vs. DetID plot around the trigger time
Blue+Cyan dotted lines: Time interval of the scaled map
From 0.000000 to 2.048000
100 us light curve (15-350 keV)
Blue+Cyan dotted lines: Time interval of the scaled map
From 0.000000 to 2.048000
Spacecraft aspect plot
Bright source in the pre-burst/pre-slew/post-slew images
Pre-burst image of 15-350 keV band
Time interval of the image:
-420.527400 -325.829600
-239.928000 -1.552000

# RAcent  DECcent POSerr Theta    Phi  PeakCts   SNR AngSep     Name
#  [deg]    [deg]    ['] [deg]  [deg]                   [']
 83.6343  22.0086    0.3  35.6   24.3  13.9384  39.8    0.4	Crab
336.8680  35.9239    3.7  56.9  179.1   4.7005   3.1 ------	UNKNOWN
109.7307  25.4345    2.6  47.6   -7.7   2.2332   4.4 ------	UNKNOWN
105.4332  40.3485    2.2  35.2  -21.5   1.5945   5.3 ------	UNKNOWN
Pre-slew background subtracted image of 15-350 keV band
Time interval of the image:
-1.552000 3.624000

# RAcent  DECcent POSerr Theta    Phi  PeakCts   SNR AngSep     Name
#  [deg]    [deg]    ['] [deg]  [deg]                   [']
 83.6313  22.1639    4.4  35.5   24.1   0.0878   2.6    9.0	Crab
358.4503  23.3747    2.2  52.0  152.0   0.6133   5.3 ------	UNKNOWN
 48.1929  62.5435    1.3  12.8 -126.1   0.1857   8.9 ------	UNKNOWN
305.4566  67.0668    2.2  51.5 -136.6   0.5641   5.2 ------	UNKNOWN
Post-slew image of 15-350 keV band
Time interval of the image:
62.372610 310.972600

# RAcent  DECcent POSerr Theta    Phi  PeakCts   SNR AngSep     Name
#  [deg]    [deg]    ['] [deg]  [deg]                   [']
 83.6296  22.0276    0.7  47.0   27.9  10.6621  17.7    0.8	Crab
308.1723  40.9066   15.4  58.7 -165.5  -1.0984  -0.7    3.9	Cyg X-3
326.3520  38.3596   59.8  53.0  178.8   0.1246   0.2    8.8	Cyg X-2
Plot creation:
Sun May 31 08:44:16 EDT 2015