Click here for the BAT GCN circular template
Image
Pre-slew 15-350 keV image (Event data; bkg subtracted)

#   RAcent  DECcent POSerr  Theta    Phi     Peak Cts     SNR  Name
  297.4458 -50.3464 0.0412   47.1 -168.9       0.0896     4.7  TRIG_00296491
------------------------------------------

Foreground time interval of the image:
  0.000   1.024 (delta_t =   1.024 [sec])
Background time interval of the image:
-30.731  -5.632 (delta_t =  25.099 [sec])
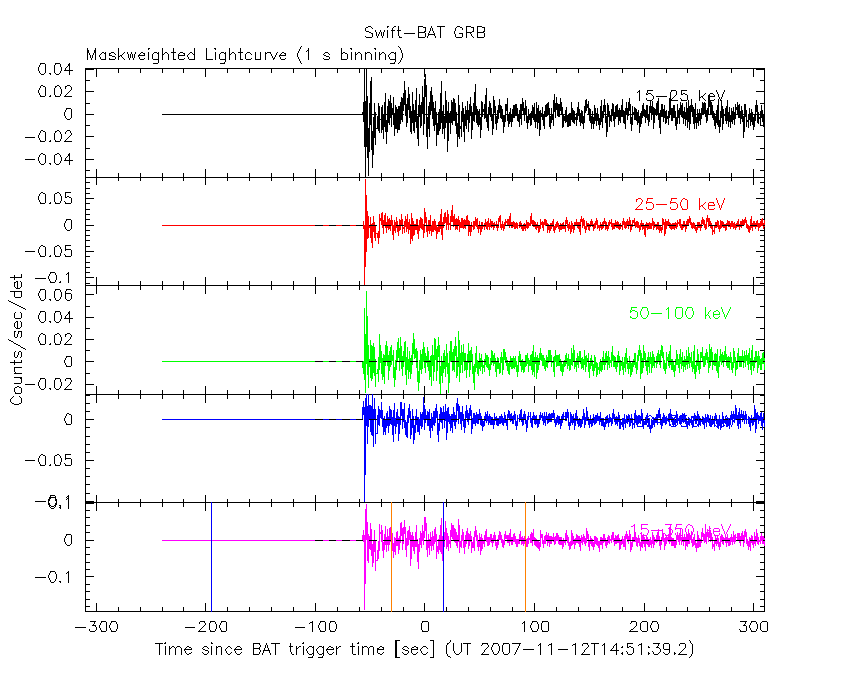
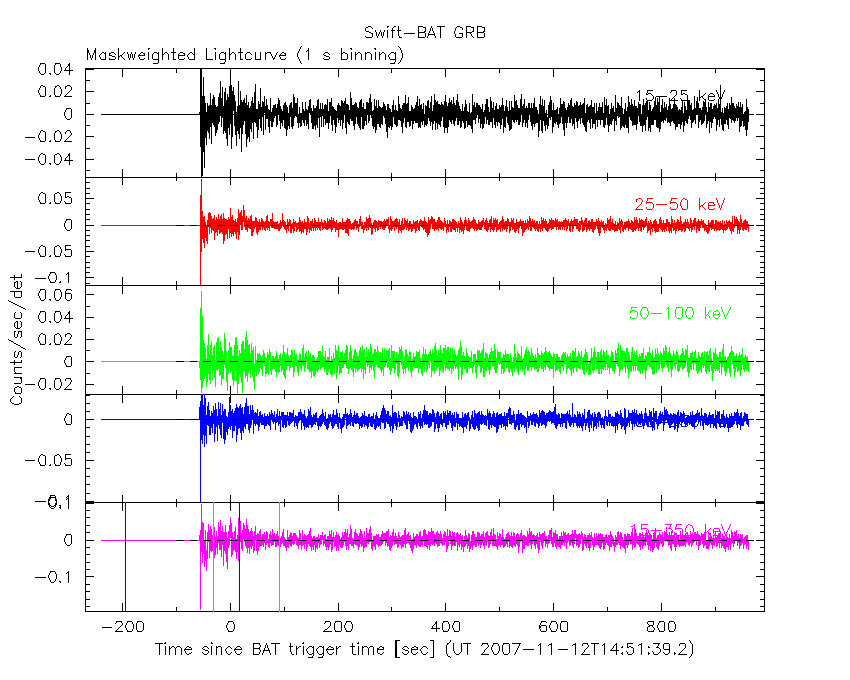
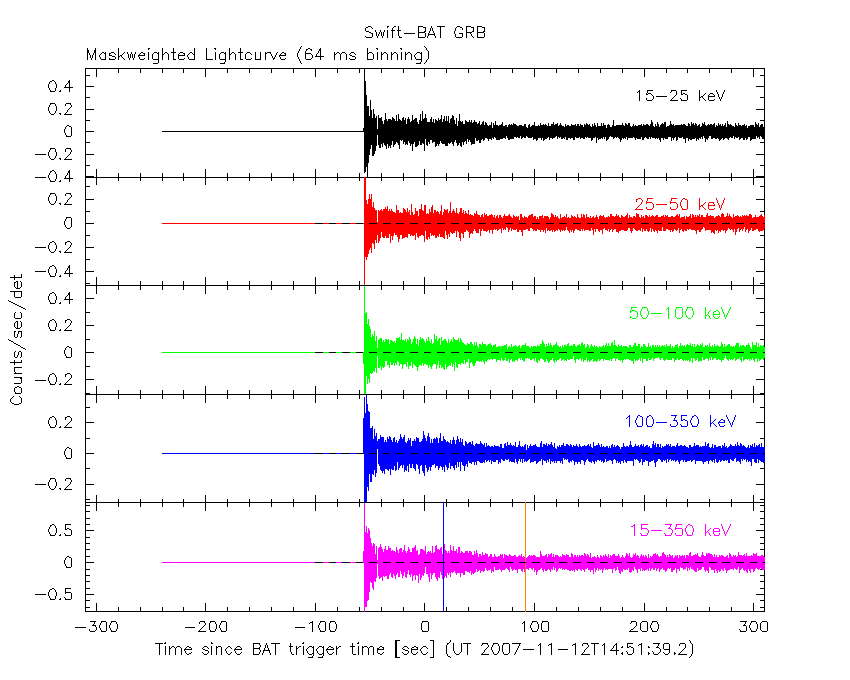
Lightcurves
Notes:
- 1) All plots contain as much data as has been downloaded to date.
- 2) Multiple plots of different time binning/intervals are shown to cover all scenarios of short/long GRBs, rate/image triggers, and real/false positives.
- 3) For all the mask-weighted lightcurves, the y-axis units are counts/sec/det where a det is 0.4 x 0.4 = 0.16 sq cm.
- 4) The verticle lines correspond to following: green dotted lines are T50 interval, black dotted lines are T90 interval, blue solid line(s) is a spacecraft slew start time, and orange solid line(s) is a spacecraft slew end time.
- 5) Time of each bin is in the middle of the bin.
1 s binning
From T0-310 s to T0+310 s
From T100_start - 20 s to T100_end + 30 s

Full time interval
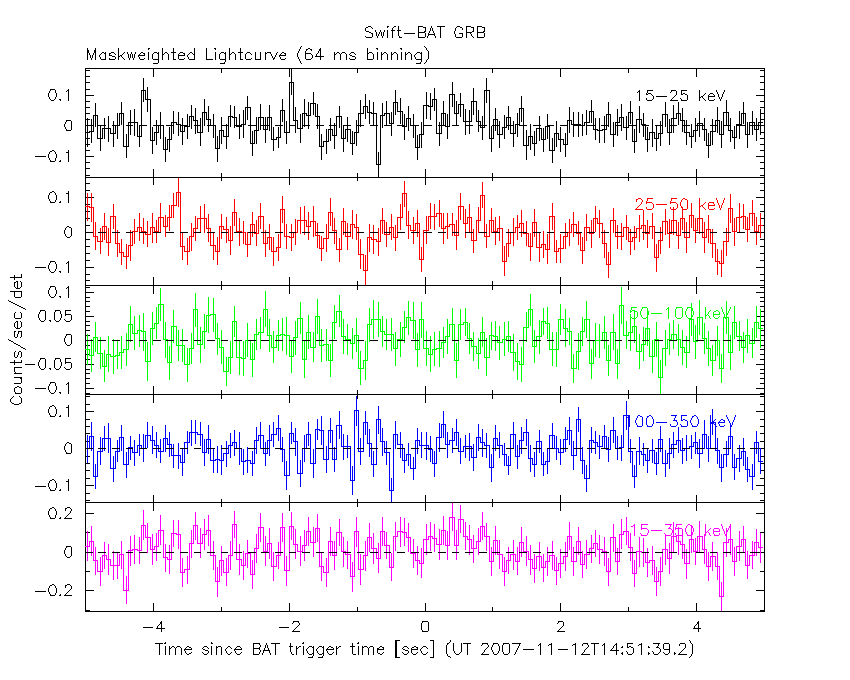
64 ms binning
Full time interval
From T100_start to T100_end
From T0-5 sec to T0+5 sec
16 ms binning
From T100_start-5 s to T100_start+5 s

Blue+Cyan dotted lines: Time interval of the scaled map
From 0.000000 to 1.024000
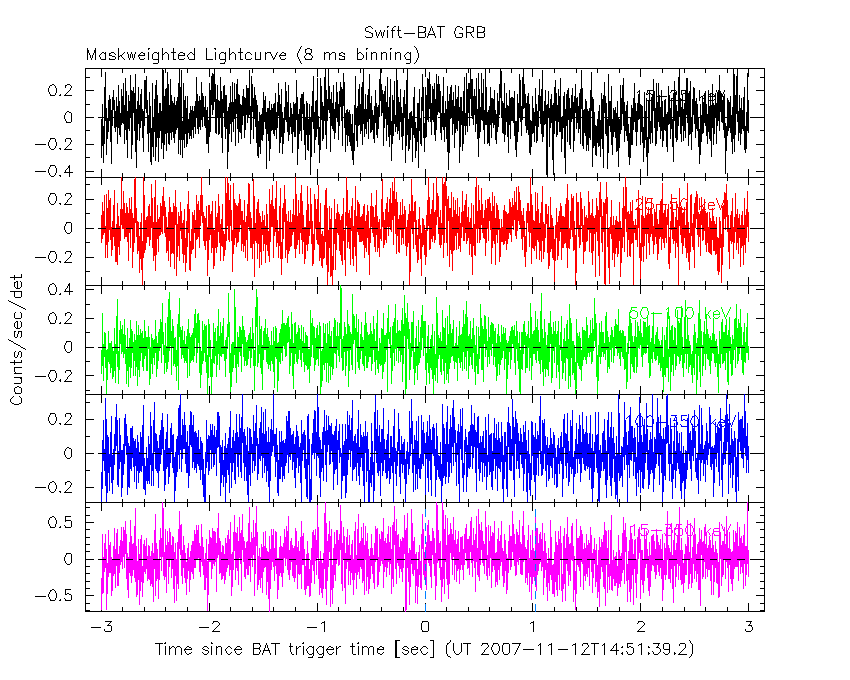
8 ms binning
From T100_start-3 s to T100_start+3 s
Blue+Cyan dotted lines: Time interval of the scaled map
From 0.000000 to 1.024000
2 ms binning
From T100_start-1 s to T100_start+1 s

Blue+Cyan dotted lines: Time interval of the scaled map
From 0.000000 to 1.024000
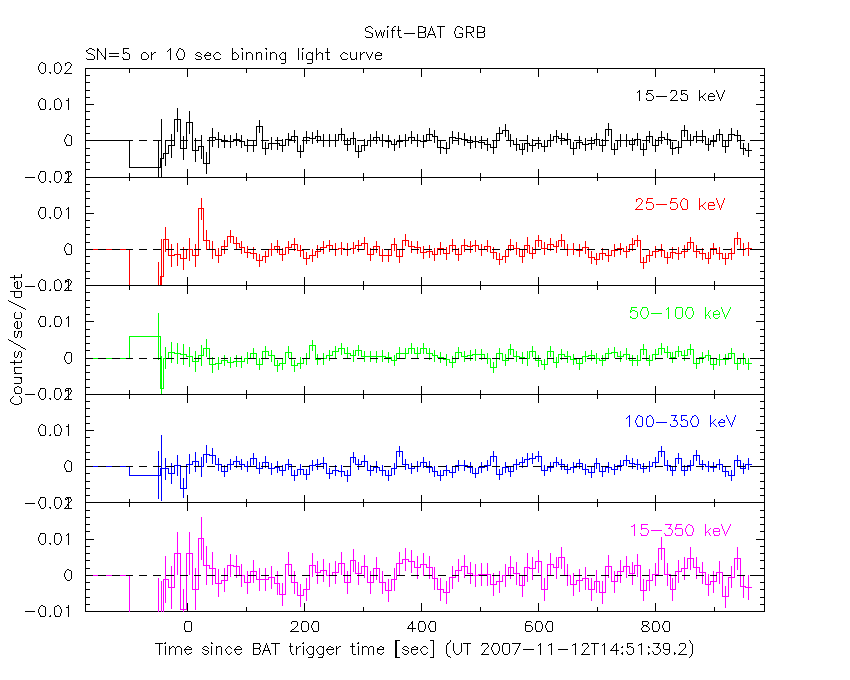
SN=5 or 10 sec. binning (whichever binning is satisfied first)
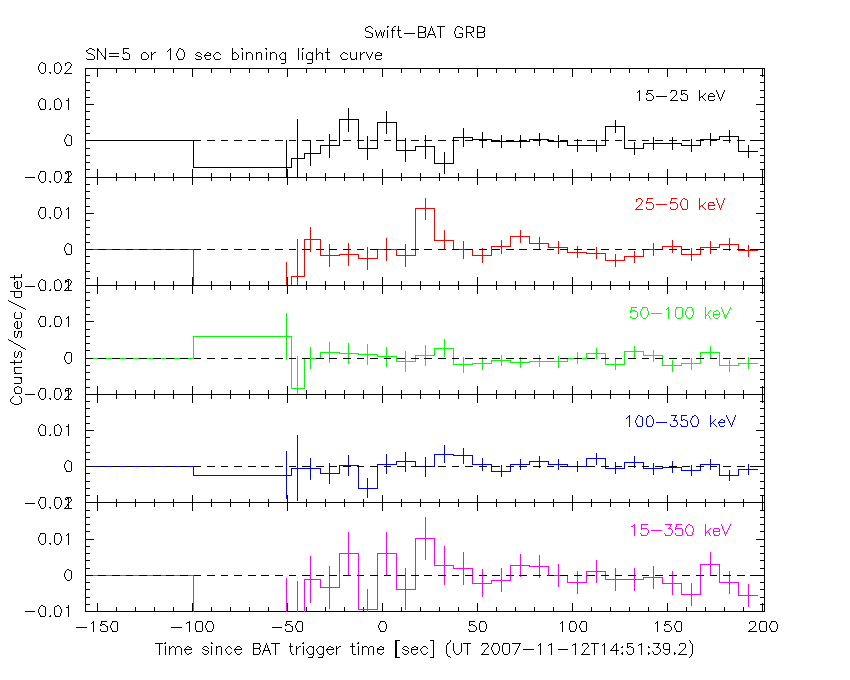
SN=5 or 10 sec. binning (T < 200 sec)
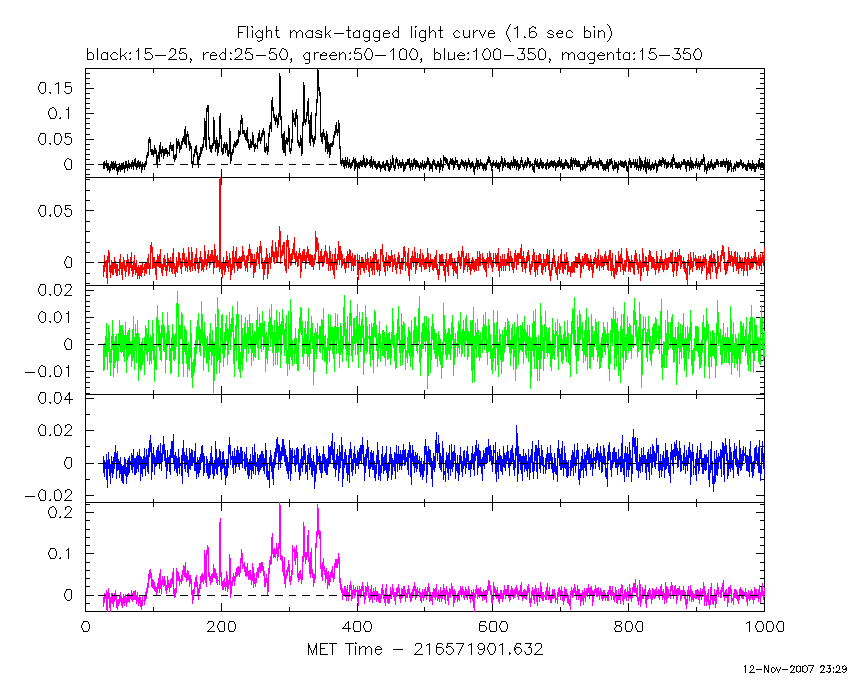
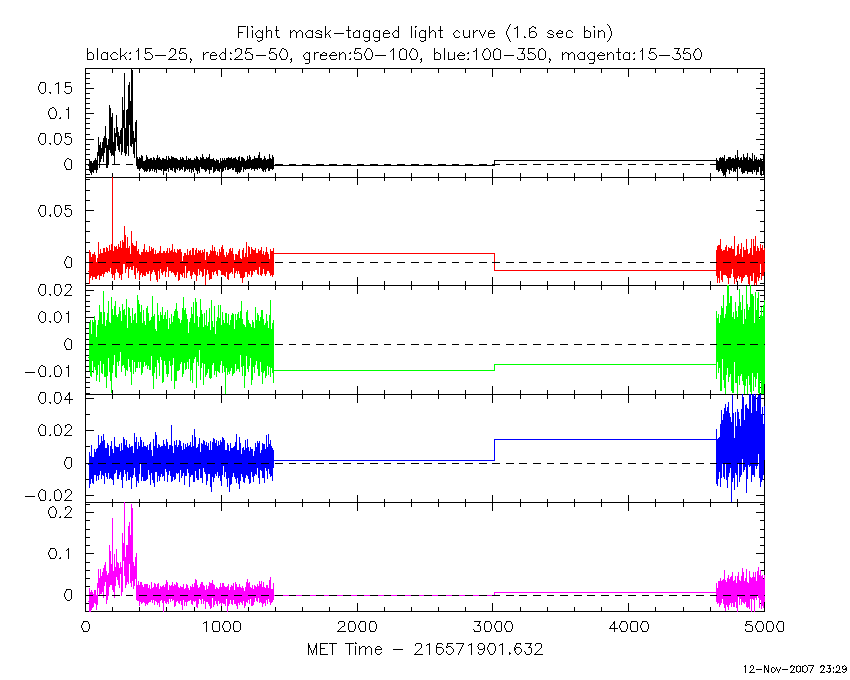
Flight mask-tagged light curves
Caution: Mask-weight map is always using the same on-axis map

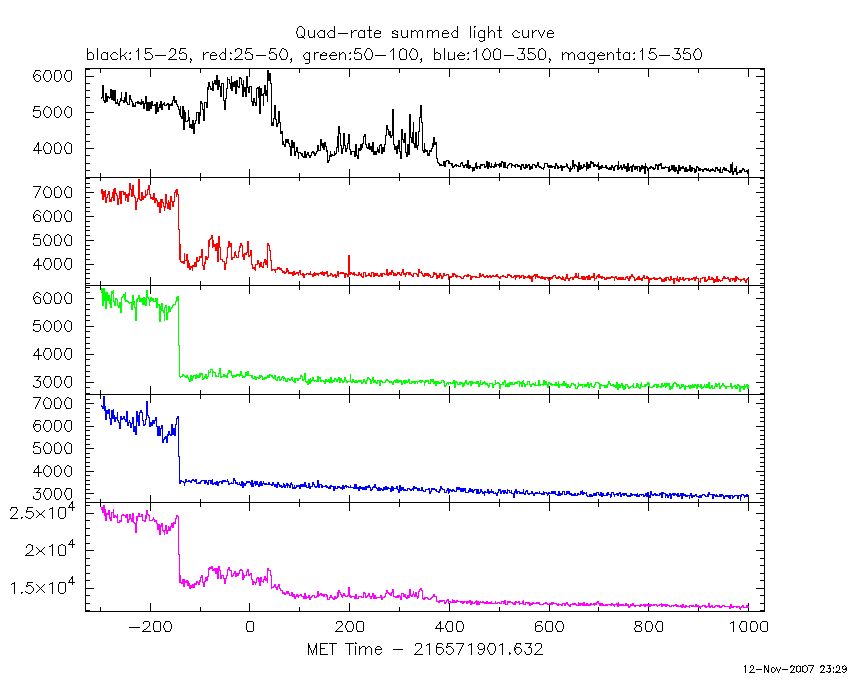
Quad-rate summed light curves (from T0-300 to T0+1000)
Spectra
Notes:
- 1) The fitting includes the systematic errors.
- 2) For long bursts, a spectral fit of the pre-slew DRM will introduce some errors in both a spectral shape and a normalization if the PHA file contains a lot of the slew/post-slew time interval.
- 3) For fits to more complicated models (e.g. a power-law over a cutoff power-law), the BAT team has decided to require a chi-square improvement of more than 6 for each extra dof.
- 4) For short bursts (T90<1sec), the specrtum is also fit with Blackbody, OTTB, and Double Blackbody.
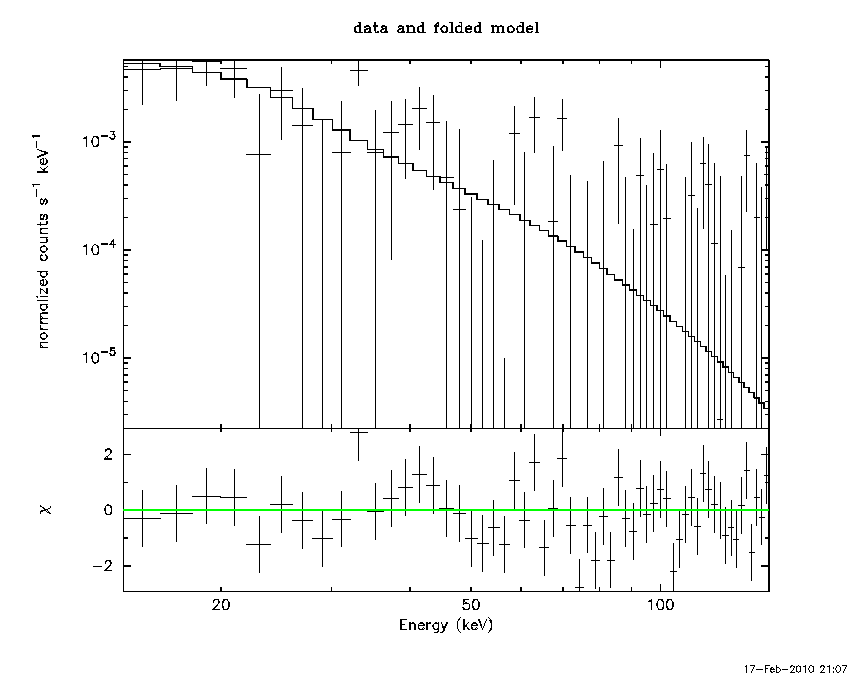
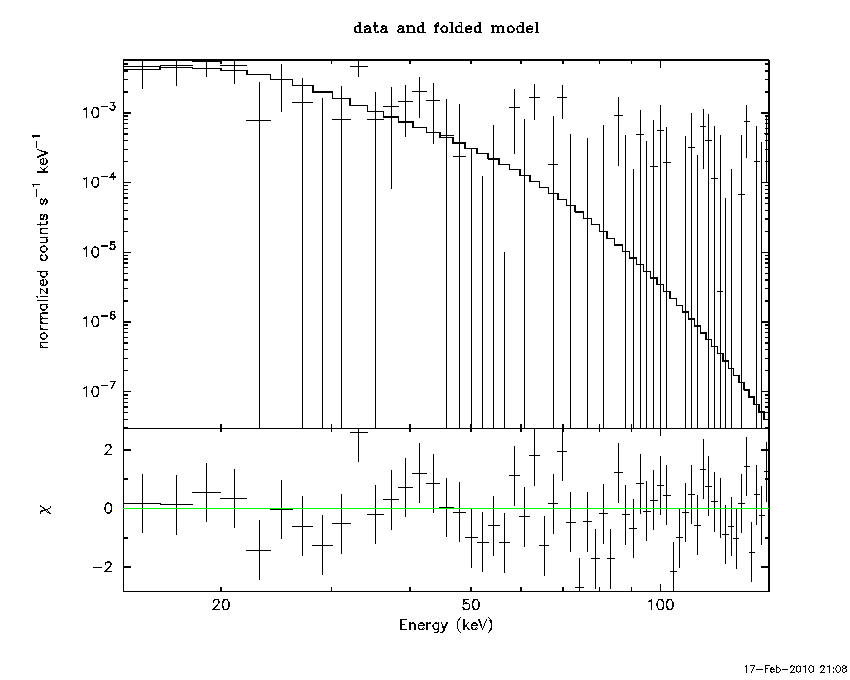
Time averaged spectrum fit using the pre-slew DRM
Power-law model

Time interval is from    0.000 sec. to    1.024 sec.

Spectral model in power-law:
------------------------------------------------------------
Parameters  : value       lower 90%   higher 90%
Photon index: 3.20077     ( -0.738926   1.08616 )
Norm@50keV  : 2.59888E-03    ( -0.00259792   0.0020862 )
------------------------------------------------------------
# Chi-Squared =          63.08 using 59 PHA bins.
# Reduced chi-squared =          1.107 for     57 degrees of freedom
# Null hypothesis probability =   2.700957e-01

Photon flux (15-150 keV)    in 1.024 sec: 0.830797 ( -0.270891  0.271673 ) ph/cm2/s
Energy fluence (15-150 keV)             : 3.53179e-08 ( -1.34923e-08  1.51305e-08 ) ergs/cm2
Cutoff power-law model

Time interval is from    0.000 sec. to    1.024 sec.
Spectral model in the cutoff power-law:
------------------------------------------------------------
Parameters  : value       lower 90%   higher 90%
Photon index: 1.08296     ( -5.08578   0.93727 )
Epeak [keV] : 13.9905      (   )
Norm@50keV  : 6.86396E-02    (     )
------------------------------------------------------------
# Chi-Squared =          62.00 using 59 PHA bins.
# Reduced chi-squared =          1.107 for     56 degrees of freedom
# Null hypothesis probability =   2.708258e-01

Photon flux (15-150 keV)    in 1.024 sec: 0.824727 ( -0.266519  0.267093 ) ph/cm2/s
Energy fluence (15-150 keV)             : 0 ( 0  0 ) ergs/cm2
Band function

Time interval is from    0.000 sec. to    1.024 sec.

Spectral model in the Band function:
------------------------------------------------------------
Parameters  : value       lower 90%   higher 90%
alpha       : -0.939897   ( -5.65207   1.62252 )
beta        : -9.37167    ( 10   20 )
Epeak [keV] : 14.5213      ( -7.24642 24.3593 )
Norm@50keV   : 9.03547E-02    ( -0.0920225   334.187 )
------------------------------------------------------------
# Chi-Squared =          62.03 using 59 PHA bins.
# Reduced chi-squared =          1.128 for     55 degrees of freedom
# Null hypothesis probability =   2.399506e-01

Photon flux (15-150 keV)    in 1.024 sec: 0.776377 ( -0.250865  0.250983 ) ph/cm2/s
Energy fluence (15-150 keV)             : 3.3614e-08 ( -1.1588e-08  1.06692e-08 ) ergs/cm2
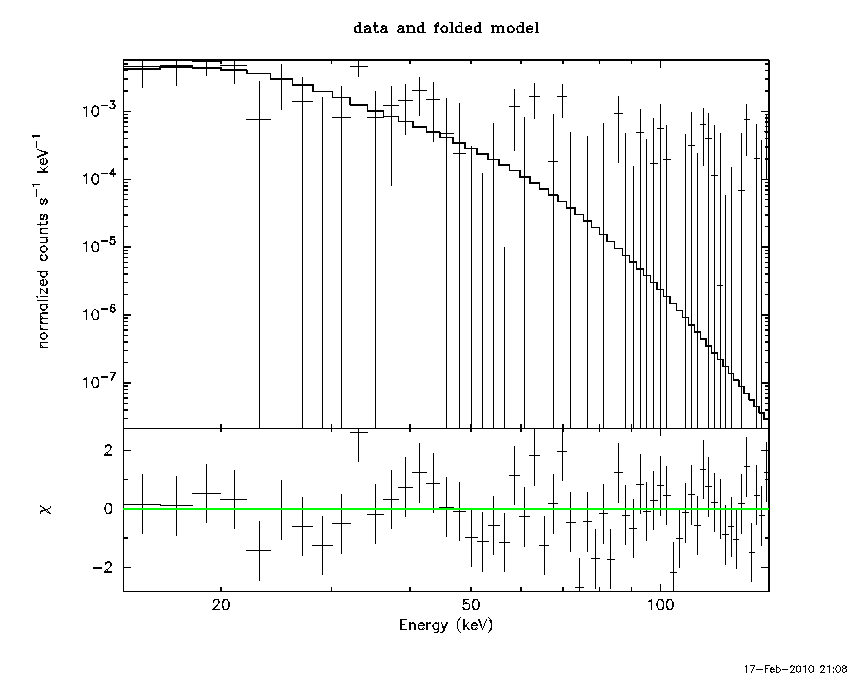
Peak spectrum fit
Power-law model
Time interval is from    0.000 sec. to    1.024 sec.

Spectral model in power-law:
------------------------------------------------------------
Parameters  : value       lower 90%   higher 90%
Photon index: 3.18936     ( -0.717609   1.05305 )
Norm@50keV  : 2.62938E-03    ( -0.00262807   0.00207591 )
------------------------------------------------------------
# Chi-Squared =          63.73 using 59 PHA bins.
# Reduced chi-squared =          1.118 for     57 degrees of freedom
# Null hypothesis probability =   2.518774e-01

Photon flux (15-150 keV)    in 1.024 sec: 0.833337 ( -0.26422  0.26516 ) ph/cm2/s
Energy fluence (15-150 keV)             : 3.55197e-08 ( -1.33831e-08  1.50657e-08 ) ergs/cm2
Cutoff power-law model
Time interval is from    0.000 sec. to    1.024 sec.
Spectral model in the cutoff power-law:
------------------------------------------------------------
Parameters  : value       lower 90%   higher 90%
Photon index: 1.09140     ( -5.19988   0.880037 )
Epeak [keV] : 13.8684      (   )
Norm@50keV  : 6.88170E-02    (     )
------------------------------------------------------------
# Chi-Squared =          62.61 using 59 PHA bins.
# Reduced chi-squared =          1.118 for     56 degrees of freedom
# Null hypothesis probability =   2.533981e-01

Photon flux (15-150 keV)    in 1.024 sec: 0.832644 ( -0.257944  0.259286 ) ph/cm2/s
Energy fluence (15-150 keV)             : 3.41086e-08 ( -1.16961e-08  1.3523e-08 ) ergs/cm2
Band function
Time interval is from    0.000 sec. to    1.024 sec.

Spectral model in the Band function:
------------------------------------------------------------
Parameters  : value       lower 90%   higher 90%
alpha       : -0.937100   ( -1.36242   1.618 )
beta        : -9.37167    ( 9.99979   19.9998 )
Epeak [keV] : 14.4866      ( -7.30398 22.6392 )
Norm@50keV   : 9.22154E-02    ( -0.0612978   244.667 )
------------------------------------------------------------
# Chi-Squared =          62.64 using 59 PHA bins.
# Reduced chi-squared =          1.139 for     55 degrees of freedom
# Null hypothesis probability =   2.236508e-01

Photon flux (15-150 keV)    in 1.024 sec: 0.776377 ( -0.250865  0.250983 ) ph/cm2/s
Energy fluence (15-150 keV)             : 3.3614e-08 ( -1.1588e-08  1.06692e-08 ) ergs/cm2
Pre-slew spectrum (Pre-slew PHA with pre-slew DRM)
Power-law model

Spectral model in power-law:
------------------------------------------------------------
Parameters  : value       lower 90%   higher 90%
Photon index: 3.20077     ( -0.738926   1.08616 )
Norm@50keV  : 2.59888E-03    ( -0.00259792   0.0020862 )
------------------------------------------------------------
# Chi-Squared =          63.08 using 59 PHA bins.
# Reduced chi-squared =          1.107 for     57 degrees of freedom
# Null hypothesis probability =   2.700957e-01

Photon flux (15-150 keV)    in 1.024 sec: 0.830797 ( -0.270891  0.271673 ) ph/cm2/s
Energy fluence (15-150 keV)             : 3.53179e-08 ( -1.34923e-08  1.51305e-08 ) ergs/cm2
Cutoff power-law model

Spectral model in the cutoff power-law:
------------------------------------------------------------
Parameters  : value       lower 90%   higher 90%
Photon index: 1.08296     ( -5.08578   0.93727 )
Epeak [keV] : 13.9905      (   )
Norm@50keV  : 6.86396E-02    (     )
------------------------------------------------------------
# Chi-Squared =          62.00 using 59 PHA bins.
# Reduced chi-squared =          1.107 for     56 degrees of freedom
# Null hypothesis probability =   2.708258e-01

Photon flux (15-150 keV)    in 1.024 sec: 0.824727 ( -0.266519  0.267093 ) ph/cm2/s
Energy fluence (15-150 keV)             : 0 ( 0  0 ) ergs/cm2
Band function

Spectral model in the Band function:
------------------------------------------------------------
Parameters  : value       lower 90%   higher 90%
alpha       : -0.939897   ( -5.65207   1.62252 )
beta        : -9.37167    ( 10   20 )
Epeak [keV] : 14.5213      ( -7.24642 24.3593 )
Norm@50keV   : 9.03547E-02    ( -0.0920225   334.187 )
------------------------------------------------------------
# Chi-Squared =          62.03 using 59 PHA bins.
# Reduced chi-squared =          1.128 for     55 degrees of freedom
# Null hypothesis probability =   2.399506e-01

Photon flux (15-150 keV)    in 1.024 sec: 0.776377 ( -0.250865  0.250983 ) ph/cm2/s
Energy fluence (15-150 keV)             : 3.3614e-08 ( -1.1588e-08  1.06692e-08 ) ergs/cm2
S(25-50 keV) vs. S(50-100 keV) plot

S(25-50 keV)  = 1.15287e-08
S(50-100 keV) = 5.01026e-09
T90 vs. Hardness ratio plot
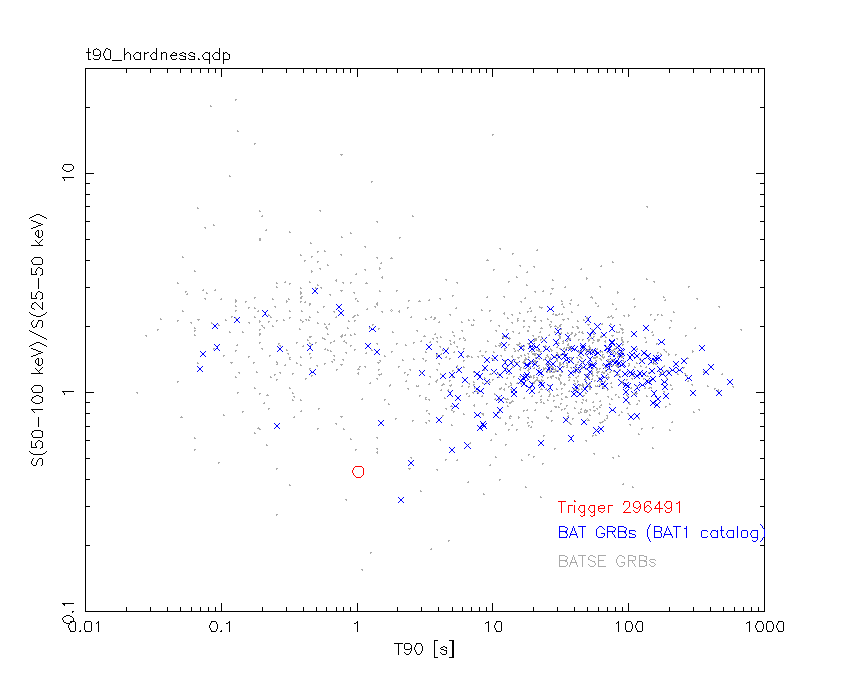
T90                                   = 1.02399998903275 sec.
Hardness ratio (energy fluence ratio) = 0.43459
Color vs. Color plot
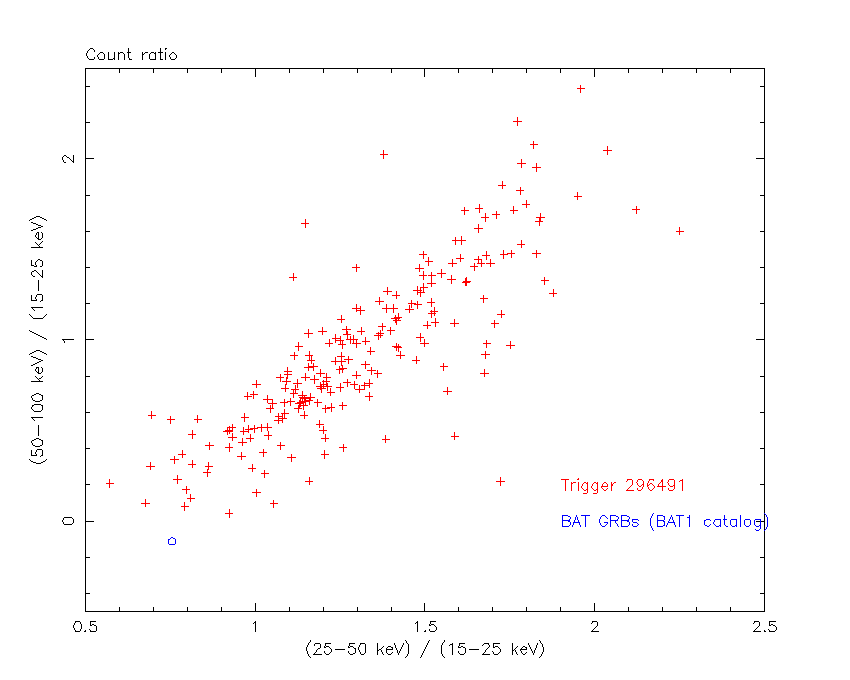
Count Ratio  (25-50 keV) / (15-25 keV) = 0.755331
Count Ratio (50-100 keV) / (15-25 keV) = -0.111963
Mask shadow pattern

IMX = 0, IMY = 0
TIME vs. PHA plot around the trigger time

Blue+Cyan dotted lines: Time interval of the scaled map
From 0.000000 to 1.024000
TIME vs. DetID plot around the trigger time
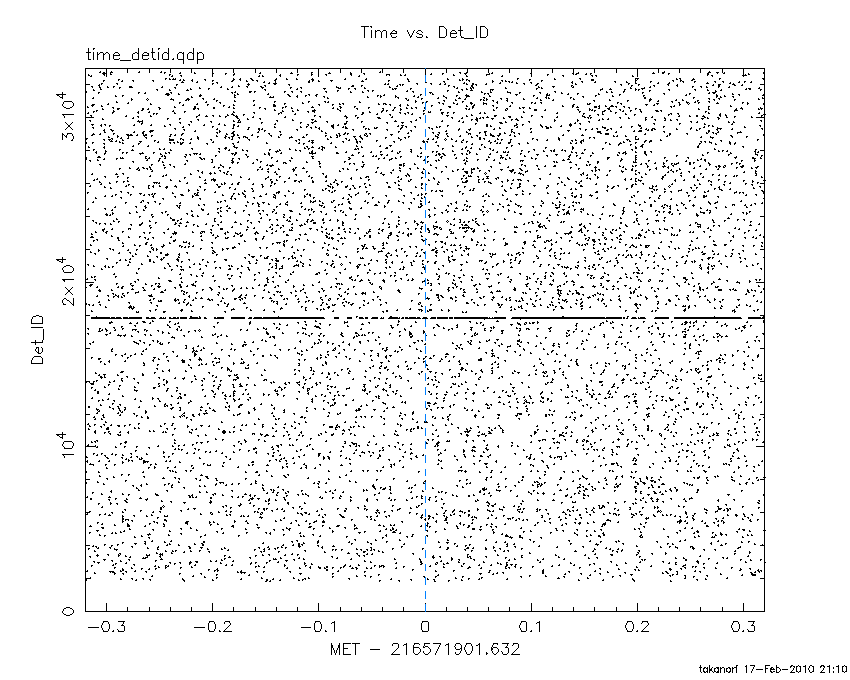
Blue+Cyan dotted lines: Time interval of the scaled map
From 0.000000 to 1.024000
100 us light curve (15-350 keV)

Blue+Cyan dotted lines: Time interval of the scaled map
From 0.000000 to 1.024000
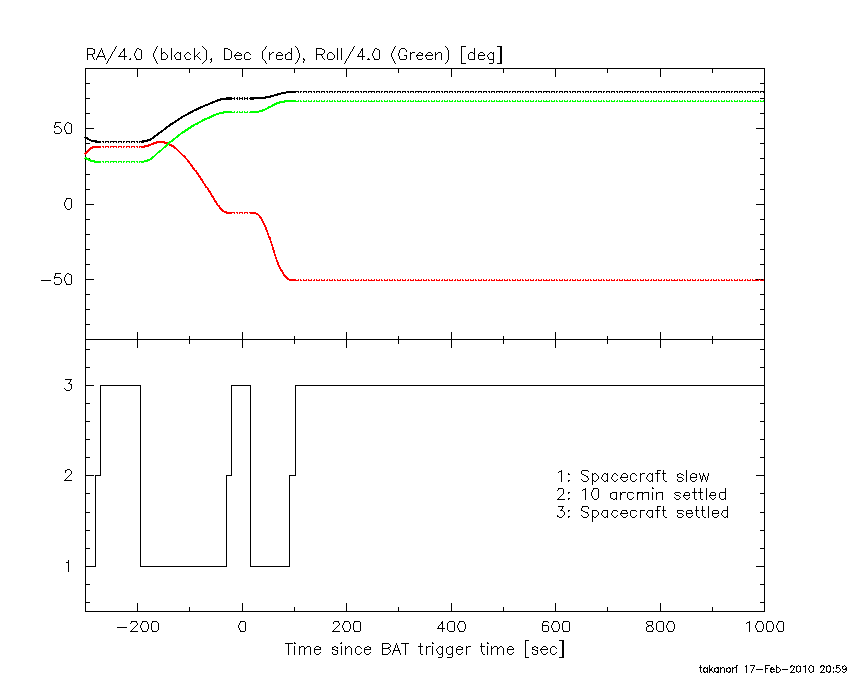
Spacecraft aspect plot
Bright source in the pre-burst/pre-slew/post-slew images
Pre-burst image of 15-350 keV band
Time interval of the image:
-30.731410 -5.632000

# RAcent  DECcent POSerr Theta    Phi  PeakCts   SNR AngSep     Name
#  [deg]    [deg]    ['] [deg]  [deg]                   [']
244.9945 -15.6285    1.3  36.0  -83.0   1.1651   8.9    1.1	Sco X-1
254.3149  35.3377    7.1  47.6   -2.8   0.1828   1.6    7.0	Her X-1
255.7758 -37.7434   49.5  39.1 -122.7  -0.0271  -0.2   11.7	4U 1700-377
256.3681 -36.3995    3.7  37.8 -121.8   0.3140   3.1    3.5	GX 349+2
263.0787 -24.8605    5.9  25.4 -115.3  -0.1249  -2.0    7.9	GX 1+4
264.7442 -44.4508 1135.1  41.2 -137.1  -0.0010  -0.0    0.1	4U 1735-44
268.4808  -1.5625    7.2  12.4  -45.6   0.0748   1.6    9.4	SW J1753.5-0127
270.4137 -25.0977    7.4  21.7 -129.2   0.0865   1.6    7.1	GX 5-1
270.2201 -25.9254    0.0  22.5 -129.8   0.0945   1.7   11.8	GRS 1758-258
274.0036 -14.2002    3.3  10.6 -119.1   0.1836   3.5    9.8	GX 17+2
275.7498 -30.3810    5.4  25.2 -144.8   0.1210   2.1    9.1	H1820-303
285.0978 -24.7251    0.0  19.7 -167.1  -0.0250  -0.5   12.2	HT1900.1-2455
288.6893  11.0564    2.7  18.6   52.9  -0.2489  -4.3    9.2	GRS 1915+105
299.5942  35.2081    2.1  44.6   48.7   1.2828   5.5    0.4	Cyg X-1
Pre-slew background subtracted image of 15-350 keV band
Time interval of the image:
0.000000 1.024000

# RAcent  DECcent POSerr Theta    Phi  PeakCts   SNR AngSep     Name
#  [deg]    [deg]    ['] [deg]  [deg]                   [']
245.1253 -15.5883    4.7  35.9  -83.0  -0.0526  -2.4    9.0	Sco X-1
254.5827  35.3535    8.4  47.5   -2.5   0.0296   1.4    6.2	Her X-1
255.8283 -37.7364    5.7  39.1 -122.7   0.0457   2.0    9.9	4U 1700-377
256.4657 -36.3824   12.0  37.7 -121.9  -0.0201  -1.0    2.8	GX 349+2
262.9857 -24.8833    3.5  25.4 -115.2   0.0412   3.3    8.4	GX 1+4
264.7723 -44.5801    3.5  41.3 -137.2  -0.0647  -3.3    7.9	4U 1735-44
268.2964  -1.6523    0.0  12.5  -46.2   0.0155   1.6   12.7	SW J1753.5-0127
270.2788 -25.2352  179.8  21.9 -129.1   0.0007   0.1    9.4	GX 5-1
270.2801 -25.8895  132.7  22.5 -129.9   0.0010   0.1    8.9	GRS 1758-258
273.9417 -13.9020    7.7  10.4 -117.8  -0.0156  -1.5    8.9	GX 17+2
275.8626 -30.2851    5.9  25.1 -145.0  -0.0217  -2.0    5.9	H1820-303
285.0277 -24.7570    7.9  19.8 -166.9  -0.0152  -1.5    9.8	HT1900.1-2455
288.8245  10.9700    6.7  18.6   53.4  -0.0189  -1.7    2.1	GRS 1915+105
299.5039  35.0650  111.5  44.5   48.7  -0.0047  -0.1    9.2	Cyg X-1
301.0195 -19.4722    2.1  24.6  152.5   0.0679   5.5 ------	UNKNOWN
295.3011 -11.6947    2.7  16.1  139.5   0.0434   4.3 ------	UNKNOWN
266.4180  26.8102    2.5  35.0    4.3   0.0632   4.6 ------	UNKNOWN
275.2414 -51.9974    2.5  46.6 -149.7   0.0962   4.6 ------	UNKNOWN
232.3307  10.2834    2.4  50.3  -45.6   0.2235   4.7 ------	UNKNOWN
235.5837  -1.4854    2.7  44.7  -60.4   0.1727   4.3 ------	UNKNOWN
Post-slew image of 15-350 keV band
Time interval of the image:
91.568590 583.198000
584.368000 962.408700

# RAcent  DECcent POSerr Theta    Phi  PeakCts   SNR AngSep     Name
#  [deg]    [deg]    ['] [deg]  [deg]                   [']
186.9037 -62.8379    3.6  54.4 -151.6   5.9779   3.3    7.9	GX 301-2
255.9296 -37.8618    1.9  31.8  -86.5   4.5722   6.0    2.9	4U 1700-377
256.4303 -36.4645    4.6  32.4  -84.0   1.8341   2.5    2.5	GX 349+2
262.9529 -24.7809    4.6  36.8  -62.5   2.3461   2.5    3.7	GX 1+4
264.4669 -44.5019    0.0  22.9  -91.5   0.0594   0.1   12.2	4U 1735-44
270.4668 -25.0423    5.2  32.7  -52.9   1.3984   2.2   10.2	GX 5-1
270.3919 -25.9071    0.0  32.0  -53.9  -0.4694  -0.8   11.0	GRS 1758-258
273.8918 -14.0822    4.0  41.0  -39.6   2.3165   2.8    7.2	GX 17+2
275.9003 -30.3497    2.0  25.7  -50.5   2.6967   5.7    1.6	H1820-303
285.2146 -24.8372   75.1  27.2  -28.3   0.0727   0.2   10.9	HT1900.1-2455
 49.9543 -67.9354    3.3  51.6  150.3  10.4096   3.5 ------	UNKNOWN
117.4358 -75.4077    3.9  54.3  176.6   5.7462   3.0 ------	UNKNOWN
246.2039 -77.2374    2.6  33.0 -164.9   2.1992   4.4 ------	UNKNOWN
277.3614 -23.8348    2.1  30.7  -41.4   2.8479   5.5 ------	UNKNOWN
238.8398 -61.7518    3.2  33.4 -136.1   1.9020   3.6 ------	UNKNOWN
255.2094 -41.6250    1.4  30.2  -93.2   5.9468   8.2 ------	UNKNOWN
Plot creation:
Wed Feb 17 21:10:42 EST 2010