Special notes of this burst
Image
Pre-slew 15.0-350.0 keV image (Event data)

#   RAcent    DECcent   POSerr    Theta     Phi              Peak Cts       SNR   Name
  335.0257   -63.4422   0.0038    39.4005   -25.0701         3.7955244     50.609 TRIG_00296805

Foreground time interval of the image:
 -0.440  13.884 (delta_t =  14.324 [sec])
Background time interval of the image:
-239.280  -0.440 (delta_t = 238.840 [sec])
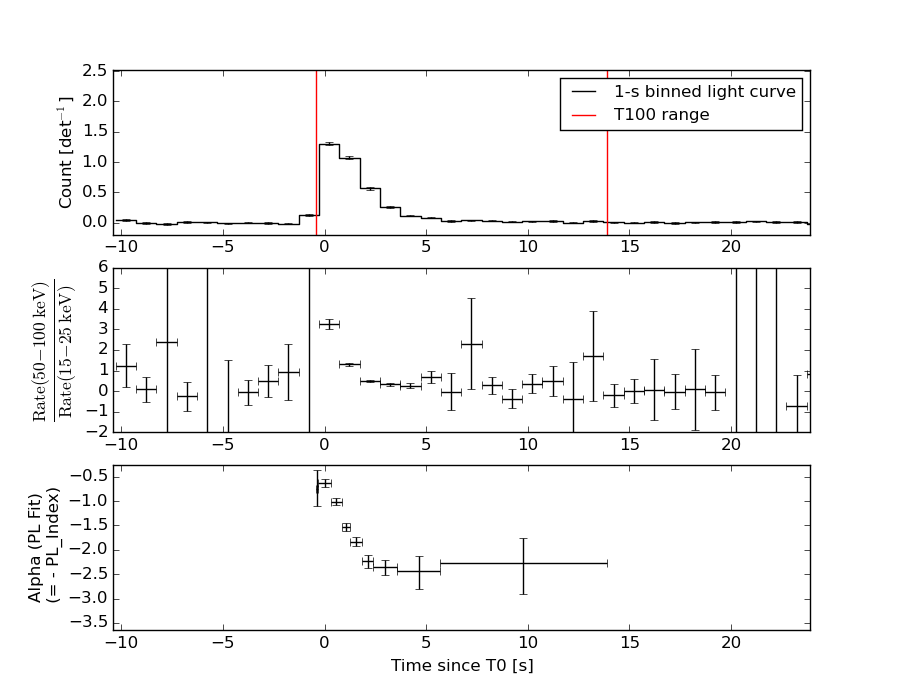
Lightcurves
Notes:
- 1) The mask-weighted light curves are using the flight position.
- 2) Multiple plots of different time binning/intervals are shown to cover all scenarios of short/long GRBs, rate/image triggers, and real/false positives.
- 3) For all the mask-weighted lightcurves, the y-axis units are counts/sec/det where a det is 0.4 x 0.4 = 0.16 sq cm.
- 4) The verticle lines correspond to following: green dotted lines are T50 interval, black dotted lines are T90 interval, blue solid line(s) is a spacecraft slew start time, and orange solid line(s) is a spacecraft slew end time.
- 5) Time of each bin is in the middle of the bin.
1 s binning
From T0-310 s to T0+310 s

From T100_start - 20 s to T100_end + 30 s

Full time interval

64 ms binning
Full time interval

From T100_start to T100_end

From T0-5 sec to T0+5 sec

16 ms binning
From T100_start-5 s to T100_start+5 s

Blue+Cyan dotted lines: Time interval of the scaled map
From 0.000000 to 1.024000
8 ms binning
From T100_start-3 s to T100_start+3 s

Blue+Cyan dotted lines: Time interval of the scaled map
From 0.000000 to 1.024000
2 ms binning
From T100_start-1 s to T100_start+1 s

Blue+Cyan dotted lines: Time interval of the scaled map
From 0.000000 to 1.024000
SN=5 or 10 sec. binning (whichever binning is satisfied first)

SN=5 or 10 sec. binning (T < 200 sec)

Quad-rate summed light curves (from T0-300s to T0+1000s)

Spectral Evolution
Spectra
Notes:
- 1) The fitting includes the systematic errors.
- 2) When the burst includes telescope slew time periods, the fitting uses an average response file made from multiple 5-s response files through out the slew time plus single time preiod for the non-slew times, and weighted by the total counts in the corresponding time period using addrmf. An average response file is needed becuase a spectral fit using the pre-slew DRM will introduce some errors in both a spectral shape and a normalization if the PHA file contains a lot of the slew/post-slew time interval.
- 3) For fits to more complicated models (e.g. a power-law over a cutoff power-law), the BAT team has decided to require a chi-square improvement of more than 6 for each extra dof.
Time averaged spectrum fit using the average DRM
Power-law model

Time interval is from   -0.440 sec. to   13.884 sec.

Spectral model in power-law:
------------------------------------------------------------
Parameters  : value       lower 90%   higher 90%
Photon index: 1.51625     ( -0.0545142   0.0545532 )
Norm@50keV  : 1.82115E-02    ( -0.000542311   0.000542269 )
------------------------------------------------------------
#Fit statistic : Chi-Squared =          53.44 using 59 PHA bins.
# Reduced chi-squared =         0.9375 for     57 degrees of freedom
# Null hypothesis probability =   6.095474e-01

Photon flux (15-150 keV)    in 14.32 sec: 2.28358 ( -0.0745553  0.0747673 ) ph/cm2/s
Energy fluence (15-150 keV)             : 2.46754e-06 ( -7.73611e-08  7.74653e-08 ) ergs/cm2
Cutoff power-law model

Time interval is from   -0.440 sec. to   13.884 sec.
Spectral model in the cutoff power-law:
------------------------------------------------------------
Parameters  : value       lower 90%   higher 90%
Photon index: 1.19556     ( -0.225837   0.21488 )
Epeak [keV] : 136.625      ( -35.0036 153.342 )
Norm@50keV  : 2.56521E-02    ( -0.00513402   0.0067933 )
------------------------------------------------------------
#Fit statistic : Chi-Squared =          46.79 using 59 PHA bins.
# Reduced chi-squared =         0.8355 for     56 degrees of freedom
# Null hypothesis probability =   8.048790e-01

Photon flux (15-150 keV)    in 14.32 sec: 2.23493 ( -0.08049  0.08077 ) ph/cm2/s
Energy fluence (15-150 keV)             : 2.42055e-06 ( -8.45596e-08  8.40727e-08 ) ergs/cm2
Band function

Time interval is from   -0.440 sec. to   13.884 sec.

Spectral model in the Band function:
------------------------------------------------------------
Parameters  : value       lower 90%   higher 90%
alpha       : -0.199033   ( -1.40009   4.19274 )
beta        : -1.61033    ( 1.61037   0.085932 )
Epeak [keV] : 47.4262      ( -20.3084 160.911 )
Norm@50keV   : 0.117131    ( -0.113051   245.323 )
------------------------------------------------------------
#Fit statistic : Chi-Squared =          45.82 using 59 PHA bins.
# Reduced chi-squared =         0.8330 for     55 degrees of freedom
# Null hypothesis probability =   8.065416e-01

Photon flux (15-150 keV)    in 14.32 sec: 2.23864 (    ) ph/cm2/s
Energy fluence (15-150 keV)             : 2.4171e-06 ( -2.417e-06  -8.39725e-08 ) ergs/cm2
Single BB

Spectral model blackbody:
------------------------------------------------------------
Parameters  : value    Lower 90%  Upper 90%
kT [keV]    : 16.4893  (  )
R^2/D10^2   : 0.180763  (   )
(R is the radius in km and D10 is the distance to the source in units of 10 kpc)
------------------------------------------------------------
#Fit statistic : Chi-Squared =         269.65 using 59 PHA bins.
# Reduced chi-squared =         4.7308 for     57 degrees of freedom
# Null hypothesis probability =   2.257754e-29

Energy  Fluence     90% Error
[keV]   [erg/cm2]   [erg/cm2]
15- 25  1.445e-07   8.420e-09
25- 50  6.236e-07   2.821e-08
50-150  1.198e-06   6.859e-08
15-150  1.966e-06   6.730e-08
Thermal bremsstrahlung (OTTB)

Spectral model: thermal bremsstrahlung
------------------------------------------------------------
Parameters  : value         Lower 90%    Upper 90%
kT [keV]    : 200.000       (      )
Norm        : 9.35796       (-0.278216     0.278213)
------------------------------------------------------------
#Fit statistic : Chi-Squared =          50.84 using 59 PHA bins.
# Reduced chi-squared =         0.8919 for     57 degrees of freedom
# Null hypothesis probability =   7.041455e-01

Energy  Fluence     90% Error
[keV]   [erg/cm2]   [erg/cm2]
15- 25  3.337e-07   1.024e-08
25- 50  6.420e-07   2.012e-08
50-150  1.408e-06   4.590e-08
15-150  2.384e-06   8.091e-08
Double BB

Spectral model: bbodyrad<1> + bbodyrad<2>
------------------------------------------------------------
Parameters  : value         Lower 90%    Upper 90%
kT1 [keV]   : 7.65775        (-0.826108      0.8901)
R1^2/D10^2  : 1.67214        (-0.50253      0.794715)
kT2 [keV]   : 27.8510        (-2.8167      3.81052)
R2^2/D10^2  : 2.28162E-02    (-0.00845714   0.0111601)
------------------------------------------------------------
#Fit statistic : Chi-Squared =          47.05 using 59 PHA bins.
# Reduced chi-squared =         0.8554 for     55 degrees of freedom
# Null hypothesis probability =   7.685385e-01

Energy  Fluence     90% Error
[keV]   [erg/cm2]   [erg/cm2]
15- 25  2.868e-07   2.878e-08
25- 50  6.451e-07   4.797e-08
50-150  1.482e-06   1.370e-07
15-150  2.414e-06   1.554e-07
Peak spectrum fit
Power-law model

Time interval is from    0.020 sec. to    1.020 sec.

Spectral model in power-law:
------------------------------------------------------------
Parameters  : value       lower 90%   higher 90%
Photon index: 1.00389     ( -0.0525137   0.0520721 )
Norm@50keV  : 9.77956E-02    ( -0.00321003   0.00320571 )
------------------------------------------------------------
#Fit statistic : Chi-Squared =          82.33 using 59 PHA bins.
# Reduced chi-squared =          1.444 for     57 degrees of freedom
# Null hypothesis probability =   1.573321e-02

Photon flux (15-150 keV)    in 1 sec: 11.2576 ( -0.372961  0.380842 ) ph/cm2/s
Energy fluence (15-150 keV)             : 1.05612e-06 ( -3.58867e-08  3.57984e-08 ) ergs/cm2
Cutoff power-law model

Time interval is from    0.020 sec. to    1.020 sec.
Spectral model in the cutoff power-law:
------------------------------------------------------------
Parameters  : value       lower 90%   higher 90%
Photon index: 0.313758     ( -0.242363   0.229815 )
Epeak [keV] : 143.397      ( -22.6061 41.657 )
Norm@50keV  : 0.197149    ( -0.0399291   0.0527351 )
------------------------------------------------------------
#Fit statistic : Chi-Squared =          53.38 using 59 PHA bins.
# Reduced chi-squared =         0.9532 for     56 degrees of freedom
# Null hypothesis probability =   5.746726e-01

Photon flux (15-150 keV)    in 1 sec: 11.0734 ( -0.3815  0.3819 ) ph/cm2/s
Energy fluence (15-150 keV)             : 1.03948e-06 ( 0  0 ) ergs/cm2
Band function

Time interval is from    0.020 sec. to    1.020 sec.

Spectral model in the Band function:
------------------------------------------------------------
Parameters  : value       lower 90%   higher 90%
alpha       : 1.75368   ( -3.91379   -3.69548 )
beta        : -1.22029    ( -0.141094   0.0844745 )
Epeak [keV] : 50.6718      ( -9.44726 62.7264 )
Norm@50keV   : 4.08621    ( -4.18215   333.8 )
------------------------------------------------------------
#Fit statistic : Chi-Squared =          46.23 using 59 PHA bins.
# Reduced chi-squared =         0.8405 for     55 degrees of freedom
# Null hypothesis probability =   7.941999e-01

Photon flux (15-150 keV)    in 1 sec:  (    ) ph/cm2/s
Energy fluence (15-150 keV)             : 0 ( 0  0 ) ergs/cm2
Single BB

Spectral model blackbody:
------------------------------------------------------------
Parameters  : value    Lower 90%  Upper 90%
kT [keV]    : 22.0145  (  )
R^2/D10^2   : 0.418553  (   )
(R is the radius in km and D10 is the distance to the source in units of 10 kpc)
------------------------------------------------------------
#Fit statistic : Chi-Squared =         151.80 using 59 PHA bins.
# Reduced chi-squared =         2.6632 for     57 degrees of freedom
# Null hypothesis probability =   1.498194e-10

Energy  Fluence     90% Error
[keV]   [erg/cm2]   [erg/cm2]
15- 25  3.753e-08   2.395e-09
25- 50  1.985e-07   9.100e-09
50-150  7.189e-07   3.590e-08
15-150  9.549e-07   3.410e-08
Thermal bremsstrahlung (OTTB)

Spectral model: thermal bremsstrahlung
------------------------------------------------------------
Parameters  : value         Lower 90%    Upper 90%
kT [keV]    : 199.363       (      )
Norm        : 46.1662       (     )
------------------------------------------------------------
#Fit statistic : Chi-Squared =         364.93 using 59 PHA bins.
# Reduced chi-squared =         6.4023 for     57 degrees of freedom
# Null hypothesis probability =   1.780928e-46

Energy  Fluence     90% Error
[keV]   [erg/cm2]   [erg/cm2]
15- 25  1.150e-07   3.650e-09
25- 50  2.211e-07   8.700e-09
50-150  4.850e-07   1.630e-08
15-150  8.211e-07   2.935e-08
Double BB

Spectral model: bbodyrad<1> + bbodyrad<2>
------------------------------------------------------------
Parameters  : value         Lower 90%    Upper 90%
kT1 [keV]   : 11.7679        (-1.9029      2.06755)
R1^2/D10^2  : 1.69958        (-0.504437      0.857131)
kT2 [keV]   : 40.3204        (-7.53141      17.5804)
R2^2/D10^2  : 4.64198E-02    (-0.0306241   0.047837)
------------------------------------------------------------
#Fit statistic : Chi-Squared =          46.64 using 59 PHA bins.
# Reduced chi-squared =         0.8481 for     55 degrees of freedom
# Null hypothesis probability =   7.813295e-01

Energy  Fluence     90% Error
[keV]   [erg/cm2]   [erg/cm2]
15- 25  5.937e-08   7.130e-09
25- 50  2.190e-07   2.460e-08
50-150  7.645e-07   1.994e-07
15-150  1.043e-06   2.033e-07
Pre-slew spectrum (Pre-slew PHA with pre-slew DRM)
Power-law model
Spectral model in power-law:
------------------------------------------------------------
Parameters  : value       lower 90%   higher 90%
Photon index: 1.51625     ( -0.0545142   0.0545532 )
Norm@50keV  : 1.82115E-02    ( -0.000542311   0.000542269 )
------------------------------------------------------------
#Fit statistic : Chi-Squared =          53.44 using 59 PHA bins.
# Reduced chi-squared =         0.9375 for     57 degrees of freedom
# Null hypothesis probability =   6.095474e-01

Photon flux (15-150 keV)    in 14.32 sec: 2.28358 ( -0.0745553  0.0747673 ) ph/cm2/s
Energy fluence (15-150 keV)             : 2.46754e-06 ( -7.73611e-08  7.74653e-08 ) ergs/cm2
Cutoff power-law model
Spectral model in the cutoff power-law:
------------------------------------------------------------
Parameters  : value       lower 90%   higher 90%
Photon index: 1.19556     ( -0.225837   0.21488 )
Epeak [keV] : 136.625      ( -35.0036 153.342 )
Norm@50keV  : 2.56521E-02    ( -0.00513402   0.0067933 )
------------------------------------------------------------
#Fit statistic : Chi-Squared =          46.79 using 59 PHA bins.
# Reduced chi-squared =         0.8355 for     56 degrees of freedom
# Null hypothesis probability =   8.048790e-01

Photon flux (15-150 keV)    in 14.32 sec: 2.23493 ( -0.08049  0.08077 ) ph/cm2/s
Energy fluence (15-150 keV)             : 2.42055e-06 ( -8.45596e-08  8.40727e-08 ) ergs/cm2
Band function
Spectral model in the Band function:
------------------------------------------------------------
Parameters  : value       lower 90%   higher 90%
alpha       : -0.212077   ( -1.38933   4.19975 )
beta        : -1.61040    ( 1.61041   0.0859037 )
Epeak [keV] : 47.6506      ( -20.4769 164.007 )
Norm@50keV   : 0.114744    ( -0.111608   240.594 )
------------------------------------------------------------
#Fit statistic : Chi-Squared =          45.81 using 59 PHA bins.
# Reduced chi-squared =         0.8330 for     55 degrees of freedom
# Null hypothesis probability =   8.065993e-01

Photon flux (15-150 keV)    in 14.32 sec: 2.23864 (    ) ph/cm2/s
Energy fluence (15-150 keV)             : 2.4171e-06 ( -2.417e-06  -8.39725e-08 ) ergs/cm2
S(25-50 keV) vs. S(50-100 keV) plot

S(25-50 keV)  = 6.15e-07
S(50-100 keV) = 8.60e-07
T90 vs. Hardness ratio plot

T90                                   = 6.07600000500679 sec.
Hardness ratio (energy fluence ratio) = 1.39837
Color vs. Color plot

Count Ratio  (25-50 keV) / (15-25 keV) = 1.5087
Count Ratio (50-100 keV) / (15-25 keV) = 1.22749
Mask shadow pattern

IMX = 7.440379484351372E-01, IMY = 3.480602275669307E-01
TIME vs. PHA plot around the trigger time
Blue+Cyan dotted lines: Time interval of the scaled map
From 0.000000 to 1.024000
TIME vs. DetID plot around the trigger time

Blue+Cyan dotted lines: Time interval of the scaled map
From 0.000000 to 1.024000
100 us light curve (15-350 keV)

Blue+Cyan dotted lines: Time interval of the scaled map
From 0.000000 to 1.024000
Spacecraft aspect plot

Bright source in the pre-burst/pre-slew/post-slew images
Pre-burst image of 15-350 keV band
Time interval of the image:
-239.280000 -0.440000

# RAcent  DECcent POSerr Theta    Phi  PeakCts   SNR AngSep     Name
#  [deg]    [deg]    ['] [deg]  [deg]                   [']
135.4995 -40.6230    2.2  38.1 -176.9   1.2666   5.4    4.3	Vela X-1
170.2461 -60.6372    2.3  34.1 -126.7   1.3145   4.9    2.2	Cen X-3
186.8072 -62.6123   25.5  37.5 -114.1   0.1868   0.4   10.3	GX 301-2
 87.5473 -31.9592    3.0  36.4  116.1   1.5208   3.9 ------	UNKNOWN
331.0136 -45.3677    3.5  56.5  -16.4   2.3164   3.3 ------	UNKNOWN
171.2657 -35.9414    3.1  55.3 -145.3   4.3966   3.8 ------	UNKNOWN
Pre-slew background subtracted image of 15-350 keV band
Time interval of the image:
-0.440000 13.884000

# RAcent  DECcent POSerr Theta    Phi  PeakCts   SNR AngSep     Name
#  [deg]    [deg]    ['] [deg]  [deg]                   [']
135.6171 -40.5410    4.8  38.2 -176.8   0.1545   2.4    4.1	Vela X-1
170.3675 -60.7549    7.2  34.1 -126.5  -0.1180  -1.6    8.1	Cen X-3
186.3199 -62.7068    6.2  37.3 -114.3  -0.1933  -1.9   10.0	GX 301-2
 75.7058 -50.7477    3.0  18.3   92.8   0.2236   3.9 ------	UNKNOWN
335.0257 -63.4422    0.2  39.4  -25.1   3.7955  50.6 ------	UNKNOWN
300.2007 -61.0299    2.2  48.3  -44.8   0.9663   5.3 ------	UNKNOWN
262.1498 -69.1993    3.5  42.4  -68.2   0.6213   3.3 ------	UNKNOWN
Post-slew image of 15-350 keV band
Time interval of the image:
484.720580 951.420600

# RAcent  DECcent POSerr Theta    Phi  PeakCts   SNR AngSep     Name
#  [deg]    [deg]    ['] [deg]  [deg]                   [']
210.2271  47.4559    2.7  55.6  177.2   5.2219   4.3 ------	UNKNOWN
169.5098 -31.1279    2.9  31.7  -15.6   1.1762   4.0 ------	UNKNOWN
161.6884 -41.7601    2.8  43.8  -11.7   1.7351   4.1 ------	UNKNOWN
212.7500  33.2307    3.0  47.1 -168.0   2.0058   3.9 ------	UNKNOWN
190.0953 -49.9774    3.6  50.7  -39.2   3.7844   3.3 ------	UNKNOWN
Plot creation:
Sun May 31 08:40:24 EDT 2015