Click here for the BAT GCN circular template
Image
Pre-slew 15.0-350.0 keV image (Event data)

#   RAcent    DECcent   POSerr    Theta     Phi              Peak Cts       SNR   Name
  105.2879    -7.8488   0.0182    41.5279   176.7982         1.3076689     10.554 TRIG_00301981

Foreground time interval of the image:
 -3.456  52.432 (delta_t =  55.888 [sec])
Background time interval of the image:
-355.699 -264.950 (delta_t =  90.749 [sec])
-239.000  -3.456 (delta_t = 235.544 [sec])
Lightcurves
Notes:
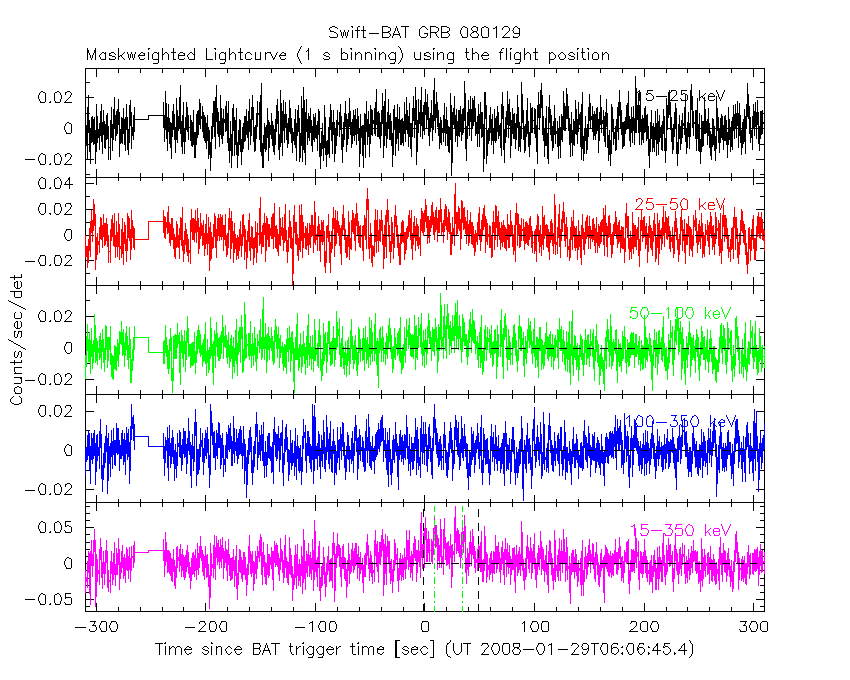
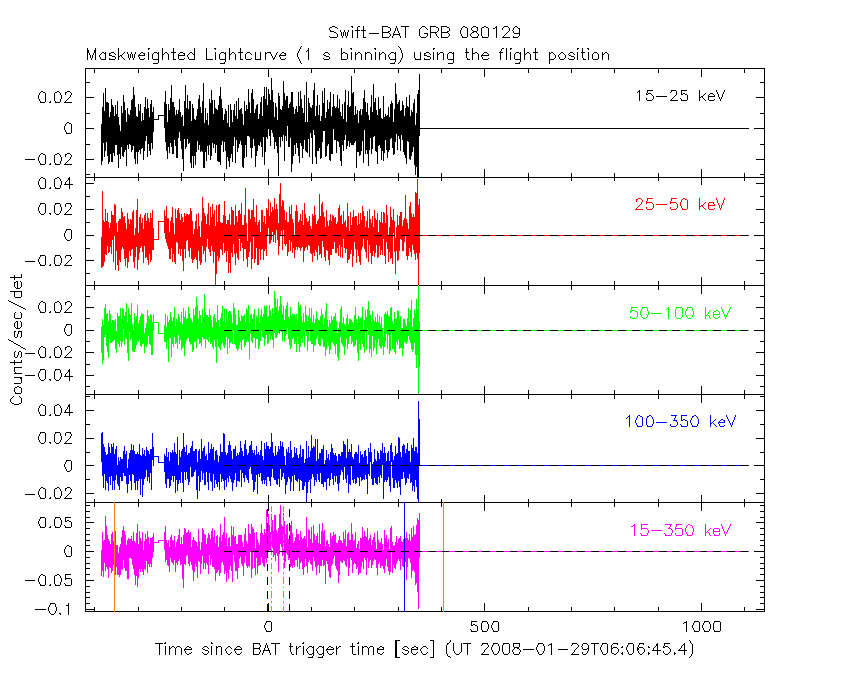
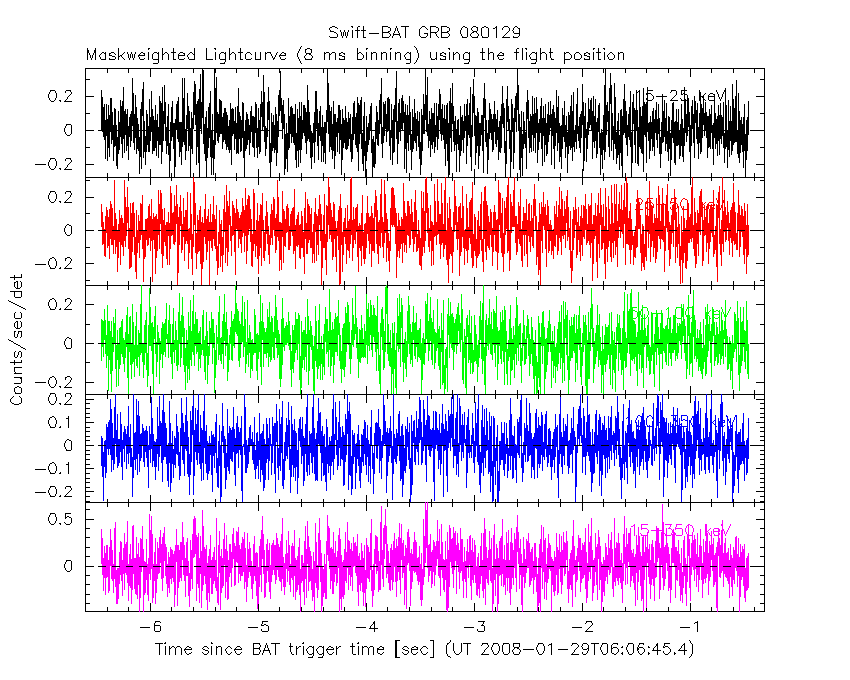
- 1) The mask-weighted light curves are using the flight position.
- 2) Multiple plots of different time binning/intervals are shown to cover all scenarios of short/long GRBs, rate/image triggers, and real/false positives.
- 3) For all the mask-weighted lightcurves, the y-axis units are counts/sec/det where a det is 0.4 x 0.4 = 0.16 sq cm.
- 4) The verticle lines correspond to following: green dotted lines are T50 interval, black dotted lines are T90 interval, blue solid line(s) is a spacecraft slew start time, and orange solid line(s) is a spacecraft slew end time.
- 5) Time of each bin is in the middle of the bin.
1 s binning
From T0-310 s to T0+310 s
From T100_start - 20 s to T100_end + 30 s

Full time interval
64 ms binning
Full time interval

From T100_start to T100_end

From T0-5 sec to T0+5 sec

16 ms binning
From T100_start-5 s to T100_start+5 s

Blue+Cyan dotted lines: Time interval of the scaled map
From 0.000000 to 64.000000
8 ms binning
From T100_start-3 s to T100_start+3 s
Blue+Cyan dotted lines: Time interval of the scaled map
From 0.000000 to 64.000000
2 ms binning
From T100_start-1 s to T100_start+1 s

Blue+Cyan dotted lines: Time interval of the scaled map
From 0.000000 to 64.000000
SN=5 or 10 sec. binning (whichever binning is satisfied first)
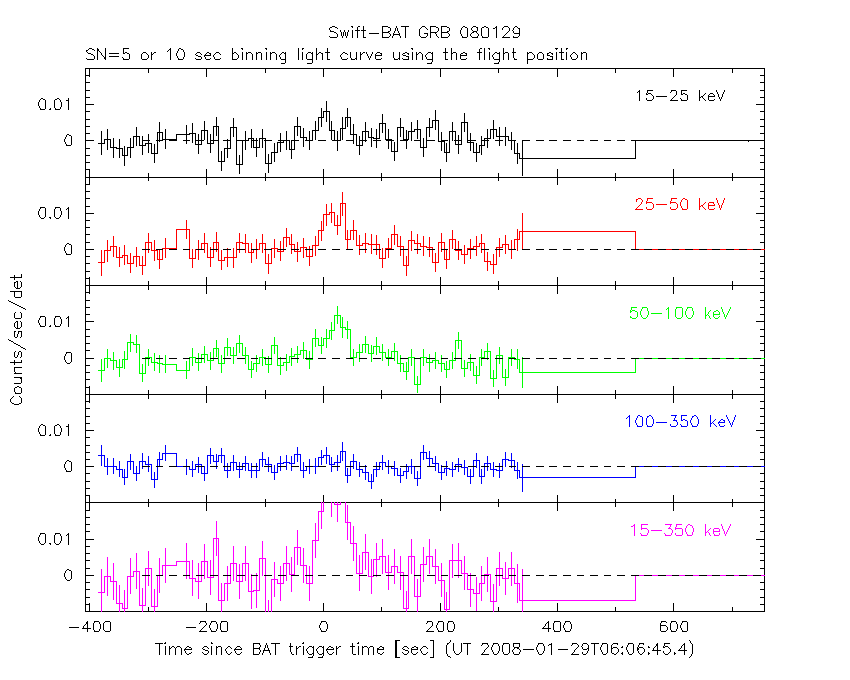
SN=5 or 10 sec. binning (T < 200 sec)

Quad-rate summed light curves (from T0-300s to T0+1000s)

Spectral Evolution

Spectra
Notes:
- 1) The fitting includes the systematic errors.
- 2) When the burst includes telescope slew time periods, the fitting uses an average response file made from multiple 5-s response files through out the slew time plus single time preiod for the non-slew times, and weighted by the total counts in the corresponding time period using addrmf. An average response file is needed becuase a spectral fit using the pre-slew DRM will introduce some errors in both a spectral shape and a normalization if the PHA file contains a lot of the slew/post-slew time interval.
- 3) For fits to more complicated models (e.g. a power-law over a cutoff power-law), the BAT team has decided to require a chi-square improvement of more than 6 for each extra dof.
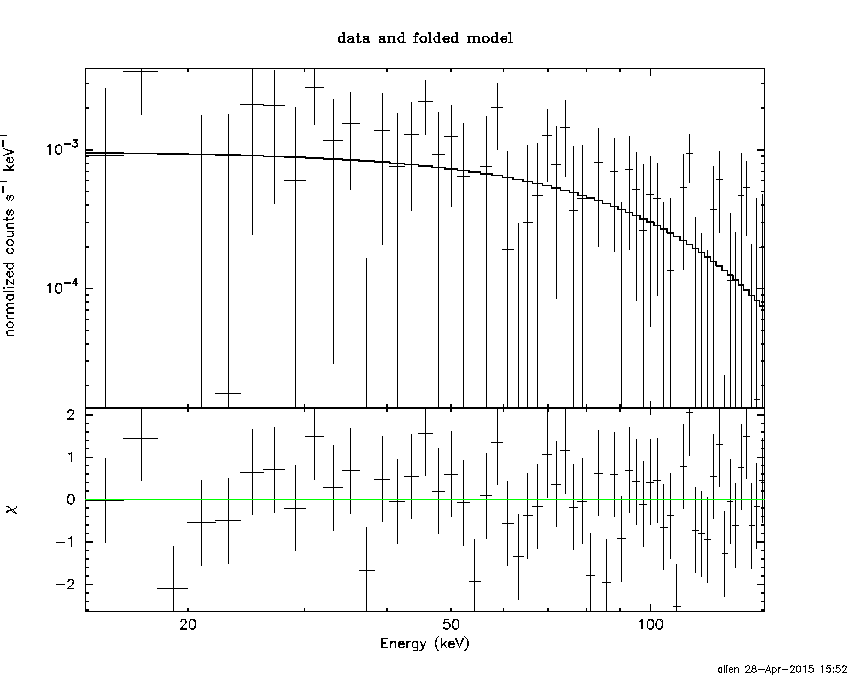
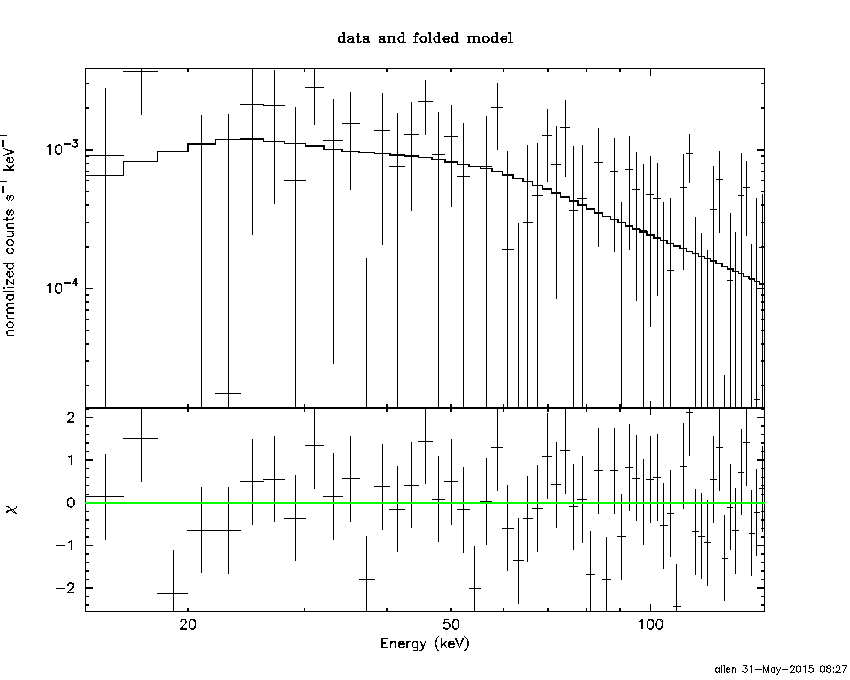
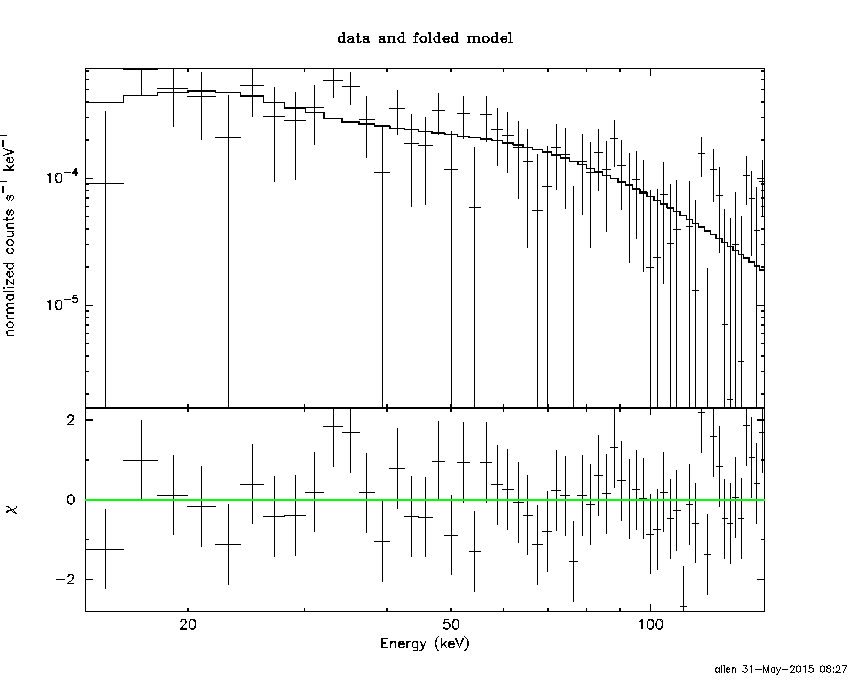
Time averaged spectrum fit using the average DRM
Power-law model
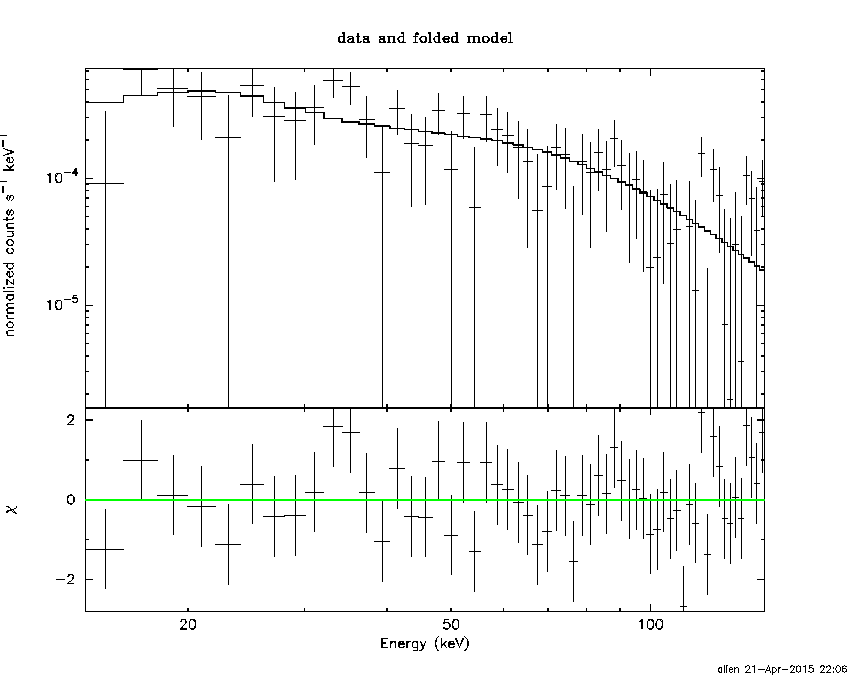
Time interval is from   -3.456 sec. to   52.432 sec.

Spectral model in power-law:
------------------------------------------------------------
Parameters  : value       lower 90%   higher 90%
Photon index: 1.26839     ( -0.266422   0.256252 )
Norm@50keV  : 1.50713E-03    ( -0.000221911   0.000221558 )
------------------------------------------------------------
#Fit statistic : Chi-Squared =          52.57 using 59 PHA bins.
# Reduced chi-squared =         0.9223 for     57 degrees of freedom
# Null hypothesis probability =   6.418104e-01

Photon flux (15-150 keV)    in 55.89 sec: 0.178799 ( -0.0280672  0.028225 ) ph/cm2/s
Energy fluence (15-150 keV)             : 8.38982e-07 ( -1.30077e-07  1.30968e-07 ) ergs/cm2
Cutoff power-law model

Time interval is from   -3.456 sec. to   52.432 sec.
Spectral model in the cutoff power-law:
------------------------------------------------------------
Parameters  : value       lower 90%   higher 90%
Photon index: 1.26882     ( -0.271355   0.255092 )
Epeak [keV] : 9999.36      ( -9999.36 -9999.36 )
Norm@50keV  : 1.51277E-03    ( -0.000221751   0.0028215 )
------------------------------------------------------------
#Fit statistic : Chi-Squared =          52.57 using 59 PHA bins.
# Reduced chi-squared =         0.9388 for     56 degrees of freedom
# Null hypothesis probability =   6.053569e-01

Photon flux (15-150 keV)    in 55.89 sec: 0.178956 ( -0.02833  0.027866 ) ph/cm2/s
Energy fluence (15-150 keV)             : 8.38842e-07 ( -6.6878e-08  1.30196e-07 ) ergs/cm2
Band function

Time interval is from   -3.456 sec. to   52.432 sec.

Spectral model in the Band function:
------------------------------------------------------------
Parameters  : value       lower 90%   higher 90%
alpha       : 5.18489E-02   ( 0.297423   0.297423 )
beta        : -1.38065    ( 1.36743   0.338048 )
Epeak [keV] : 53.6609      ( -52.9983 256.963 )
Norm@50keV   : 9.95909E-03    ( -0.01164   68.2602 )
------------------------------------------------------------
#Fit statistic : Chi-Squared =          51.98 using 59 PHA bins.
# Reduced chi-squared =         0.9452 for     55 degrees of freedom
# Null hypothesis probability =   5.905659e-01

Photon flux (15-150 keV)    in 55.89 sec:  (    ) ph/cm2/s
Energy fluence (15-150 keV)             : 0 ( 0  0 ) ergs/cm2
Single BB
Spectral model blackbody:
------------------------------------------------------------
Parameters  : value    Lower 90%  Upper 90%
kT [keV]    : 17.8492  (-3.35954  4.55883)
R^2/D10^2   : 1.15996E-02  (-0.00624754   0.0122783)
(R is the radius in km and D10 is the distance to the source in units of 10 kpc)
------------------------------------------------------------
#Fit statistic : Chi-Squared =          64.64 using 59 PHA bins.
# Reduced chi-squared =          1.134 for     57 degrees of freedom
# Null hypothesis probability =   2.271975e-01

Energy  Fluence     90% Error
[keV]   [erg/cm2]   [erg/cm2]
15- 25  4.146e-08   1.202e-08
25- 50  1.906e-07   4.759e-08
50-150  4.397e-07   1.308e-07
15-150  6.717e-07   1.495e-07
Thermal bremsstrahlung (OTTB)
Spectral model: thermal bremsstrahlung
------------------------------------------------------------
Parameters  : value         Lower 90%    Upper 90%
kT [keV]    : 200.000       (      )
Norm        : 0.756931       (-0.112641     0.112616)
------------------------------------------------------------
#Fit statistic : Chi-Squared =          56.41 using 59 PHA bins.
# Reduced chi-squared =         0.9897 for     57 degrees of freedom
# Null hypothesis probability =   4.970690e-01

Energy  Fluence     90% Error
[keV]   [erg/cm2]   [erg/cm2]
15- 25  1.054e-07   5.991e-08
25- 50  2.028e-07   1.121e-07
50-150  4.447e-07   2.485e-07
15-150  7.528e-07   4.264e-07
Double BB
Spectral model: bbodyrad<1> + bbodyrad<2>
------------------------------------------------------------
Parameters  : value         Lower 90%    Upper 90%
kT1 [keV]   : 11.4372        (-3.65352      2.61713)
R1^2/D10^2  : 4.33016E-02        (-0.0236239      0.0958474)
kT2 [keV]   : 199.227        (-160.487      -199.281)
R2^2/D10^2  : 2.61256E-05    (-8.36613e-06   0.00126593)
------------------------------------------------------------
#Fit statistic : Chi-Squared =          50.05 using 59 PHA bins.
# Reduced chi-squared =         0.9100 for     55 degrees of freedom
# Null hypothesis probability =   6.638822e-01

Energy  Fluence     90% Error
[keV]   [erg/cm2]   [erg/cm2]
15- 25  6.846e-08   3.471e-08
25- 50  2.137e-07   9.935e-08
50-150  5.367e-07   1.871e-07
15-150  8.188e-07   2.871e-07
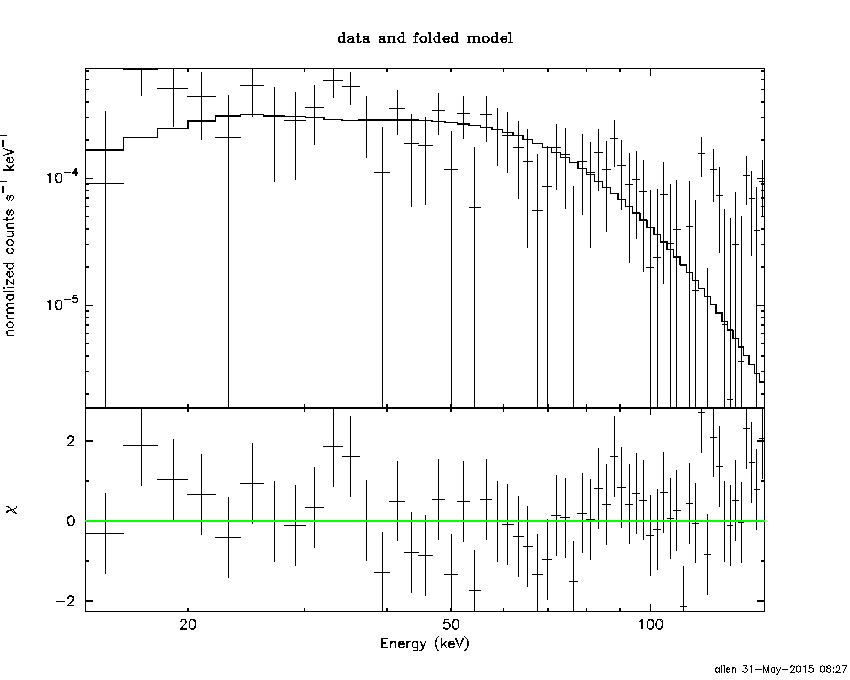
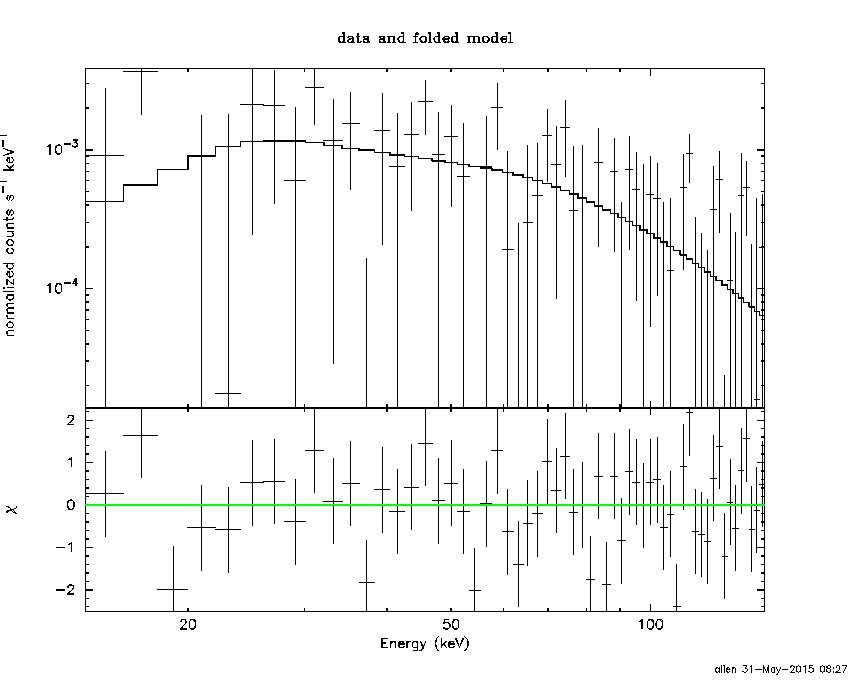
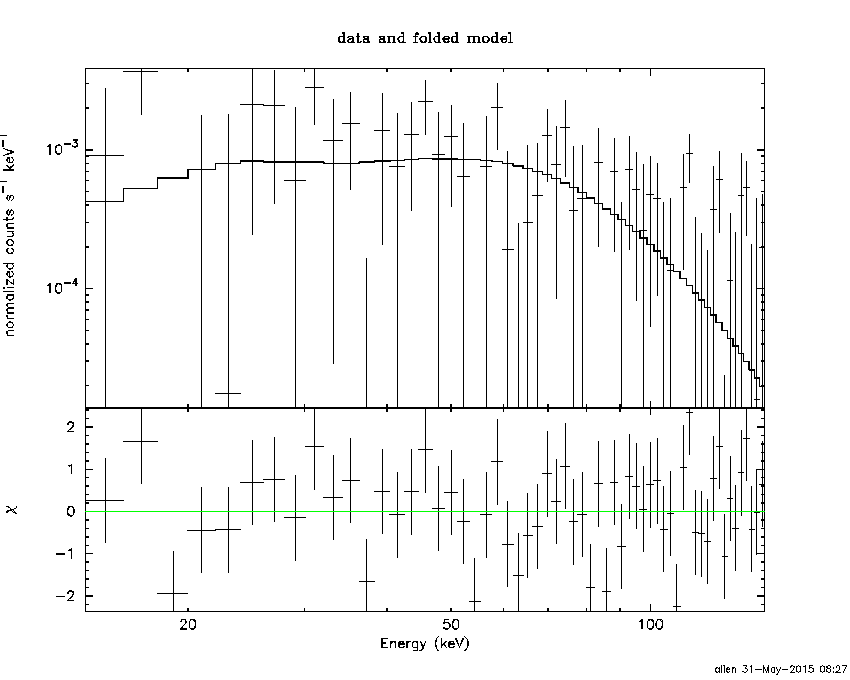
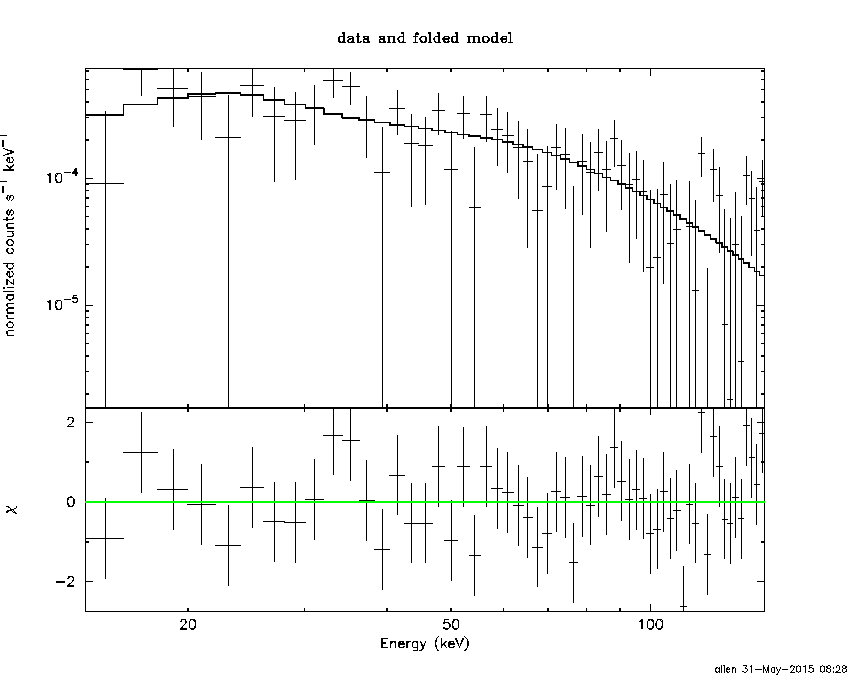
Peak spectrum fit
Power-law model

Time interval is from   27.012 sec. to   28.012 sec.

Spectral model in power-law:
------------------------------------------------------------
Parameters  : value       lower 90%   higher 90%
Photon index: 1.02299     ( -0.687446   0.569715 )
Norm@50keV  : 4.75369E-03    ( -0.00179388   0.00168954 )
------------------------------------------------------------
#Fit statistic : Chi-Squared =          58.68 using 59 PHA bins.
# Reduced chi-squared =          1.030 for     57 degrees of freedom
# Null hypothesis probability =   4.135409e-01

Photon flux (15-150 keV)    in 1 sec: 0.547983 ( -0.202575  0.208272 ) ph/cm2/s
Energy fluence (15-150 keV)             : 5.09921e-08 ( -1.72787e-08  1.73415e-08 ) ergs/cm2
Cutoff power-law model
Time interval is from   27.012 sec. to   28.012 sec.
Spectral model in the cutoff power-law:
------------------------------------------------------------
Parameters  : value       lower 90%   higher 90%
Photon index: 3.16763     (     )
Epeak [keV] : 216.489      (   )
Norm@50keV  : 2.37627E-09    (     )
------------------------------------------------------------
#Fit statistic : Chi-Squared =          58.40 using 59 PHA bins.
# Reduced chi-squared =          1.043 for     56 degrees of freedom
# Null hypothesis probability =   3.871859e-01

Photon flux (15-150 keV)    in 1 sec: 0.541947 ( -0.203409  0.210826 ) ph/cm2/s
Energy fluence (15-150 keV)             : 5.04463e-08 ( -9.4626e-09  1.76947e-08 ) ergs/cm2
Band function
Time interval is from   27.012 sec. to   28.012 sec.

Spectral model in the Band function:
------------------------------------------------------------
Parameters  : value       lower 90%   higher 90%
alpha       : 5.00000   ( -4.94535   -4.94535 )
beta        : -1.34395    ( -1.55927   0.862043 )
Epeak [keV] : 40.9406      ( -40.9408 26.8508 )
Norm@50keV   : 20.9390    ( -6.84543   1.82034e+06 )
------------------------------------------------------------
#Fit statistic : Chi-Squared =          57.74 using 59 PHA bins.
# Reduced chi-squared =          1.050 for     55 degrees of freedom
# Null hypothesis probability =   3.743159e-01

Photon flux (15-150 keV)    in 1 sec:  (    ) ph/cm2/s
Energy fluence (15-150 keV)             : 0 ( 0  0 ) ergs/cm2
Single BB
Spectral model blackbody:
------------------------------------------------------------
Parameters  : value    Lower 90%  Upper 90%
kT [keV]    : 21.6273  (-7.79111  18.3206)
R^2/D10^2   : 2.07631E-02  (-0.0207092   0.0720597)
(R is the radius in km and D10 is the distance to the source in units of 10 kpc)
------------------------------------------------------------
#Fit statistic : Chi-Squared =          59.91 using 59 PHA bins.
# Reduced chi-squared =          1.051 for     57 degrees of freedom
# Null hypothesis probability =   3.706718e-01

Energy  Fluence     90% Error
[keV]   [erg/cm2]   [erg/cm2]
15- 25  1.811e-09   1.188e-09
25- 50  9.480e-09   5.895e-09
50-150  3.311e-08   2.159e-08
15-150  4.440e-08   2.837e-08
Thermal bremsstrahlung (OTTB)

Spectral model: thermal bremsstrahlung
------------------------------------------------------------
Parameters  : value         Lower 90%    Upper 90%
kT [keV]    : 199.361       (-101.893      -199.363)
Norm        : 2.40338       (-0.844471     0.844522)
------------------------------------------------------------
#Fit statistic : Chi-Squared =          61.09 using 59 PHA bins.
# Reduced chi-squared =          1.072 for     57 degrees of freedom
# Null hypothesis probability =   3.314139e-01

Energy  Fluence     90% Error
[keV]   [erg/cm2]   [erg/cm2]
15- 25  5.985e-09   3.828e-09
25- 50  1.151e-08   6.915e-09
50-150  2.525e-08   1.559e-08
15-150  4.275e-08   2.728e-08
Double BB
R1^2/D10^2  : 7.46681E-02        (      )
kT2 [keV]   : 199.363        (-199.363      -199.363)
R2^2/D10^2  : 8.59245E-05    (-8.68374e-05   0.0383313)
------------------------------------------------------------
#Fit statistic : Chi-Squared =          59.57 using 59 PHA bins.
#Fit statistic : Chi-Squared =          57.65 using 59 PHA bins.
#Fit statistic : Chi-Squared =          57.63 using 59 PHA bins.
# Reduced chi-squared =          1.083 for     55 degrees of freedom
# Reduced chi-squared =          1.048 for     55 degrees of freedom
# Reduced chi-squared =          1.048 for     55 degrees of freedom
# Null hypothesis probability =   3.128812e-01
# Null hypothesis probability =   3.775075e-01
# Null hypothesis probability =   3.780934e-01

Energy  Fluence     90% Error
[keV]   [erg/cm2]   [erg/cm2]
15- 25  2.494e-09   1.179e-09
25- 50  9.258e-09   5.700e-09
50-150  3.324e-08   2.135e-08
15-150  4.499e-08   2.875e-08
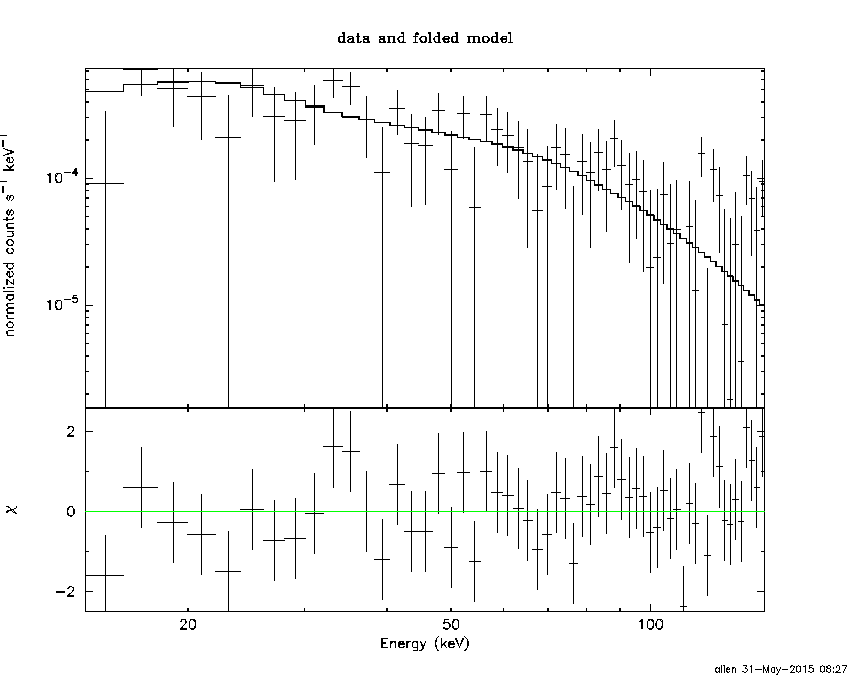
Pre-slew spectrum (Pre-slew PHA with pre-slew DRM)
Power-law model
Spectral model in power-law:
------------------------------------------------------------
Parameters  : value       lower 90%   higher 90%
Photon index: 1.26839     ( -0.266422   0.256252 )
Norm@50keV  : 1.50713E-03    ( -0.000221911   0.000221558 )
------------------------------------------------------------
#Fit statistic : Chi-Squared =          52.57 using 59 PHA bins.
# Reduced chi-squared =         0.9223 for     57 degrees of freedom
# Null hypothesis probability =   6.418104e-01

Photon flux (15-150 keV)    in 55.89 sec: 0.178799 ( -0.0280672  0.028225 ) ph/cm2/s
Energy fluence (15-150 keV)             : 8.38982e-07 ( -1.30077e-07  1.30968e-07 ) ergs/cm2
Cutoff power-law model

Spectral model in the cutoff power-law:
------------------------------------------------------------
Parameters  : value       lower 90%   higher 90%
Photon index: 1.26882     ( -0.271355   0.255092 )
Epeak [keV] : 9999.36      ( -9999.36 -9999.36 )
Norm@50keV  : 1.51277E-03    ( -0.000221751   0.0028215 )
------------------------------------------------------------
#Fit statistic : Chi-Squared =          52.57 using 59 PHA bins.
# Reduced chi-squared =         0.9388 for     56 degrees of freedom
# Null hypothesis probability =   6.053569e-01

Photon flux (15-150 keV)    in 55.89 sec: 0.178956 ( -0.02833  0.027866 ) ph/cm2/s
Energy fluence (15-150 keV)             : 8.38842e-07 ( -6.6878e-08  1.30196e-07 ) ergs/cm2
Band function
Spectral model in the Band function:
------------------------------------------------------------
Parameters  : value       lower 90%   higher 90%
alpha       : 5.18489E-02   ( 0.297423   0.297423 )
beta        : -1.38065    ( 1.36743   0.338048 )
Epeak [keV] : 53.6609      ( -52.9983 257.178 )
Norm@50keV   : 9.95909E-03    ( -0.01164   68.2602 )
------------------------------------------------------------
#Fit statistic : Chi-Squared =          51.98 using 59 PHA bins.
# Reduced chi-squared =         0.9452 for     55 degrees of freedom
# Null hypothesis probability =   5.905659e-01

Photon flux (15-150 keV)    in 55.89 sec:  (    ) ph/cm2/s
Energy fluence (15-150 keV)             : 0 ( 0  0 ) ergs/cm2
S(25-50 keV) vs. S(50-100 keV) plot
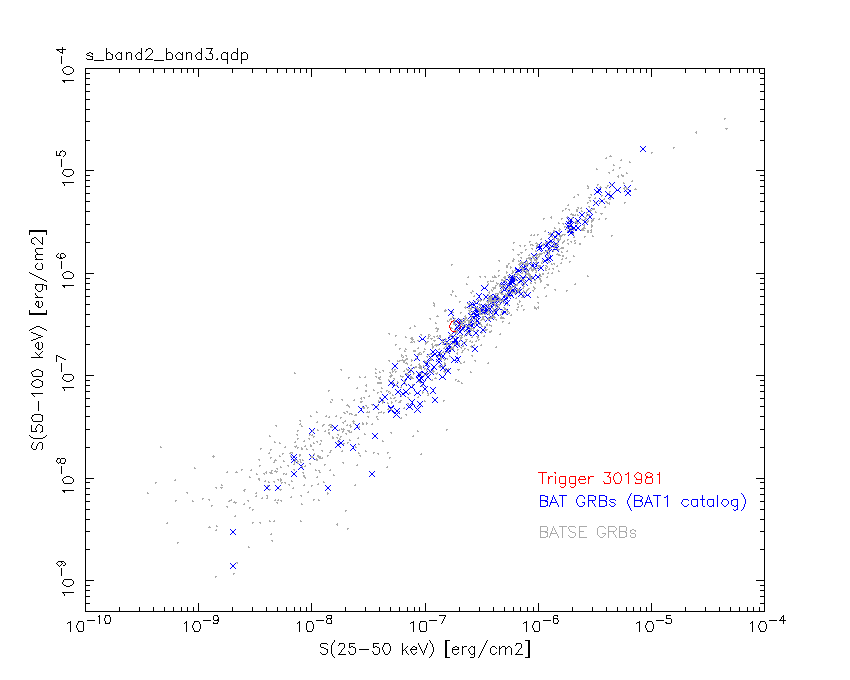
S(25-50 keV)  = 1.83e-07
S(50-100 keV) = 3.05e-07
T90 vs. Hardness ratio plot

T90                                   = 50.1800000071526 sec.
Hardness ratio (energy fluence ratio) = 1.66667
Color vs. Color plot

Count Ratio  (25-50 keV) / (15-25 keV) = 1.82385
Count Ratio (50-100 keV) / (15-25 keV) = 1.60027
Mask shadow pattern
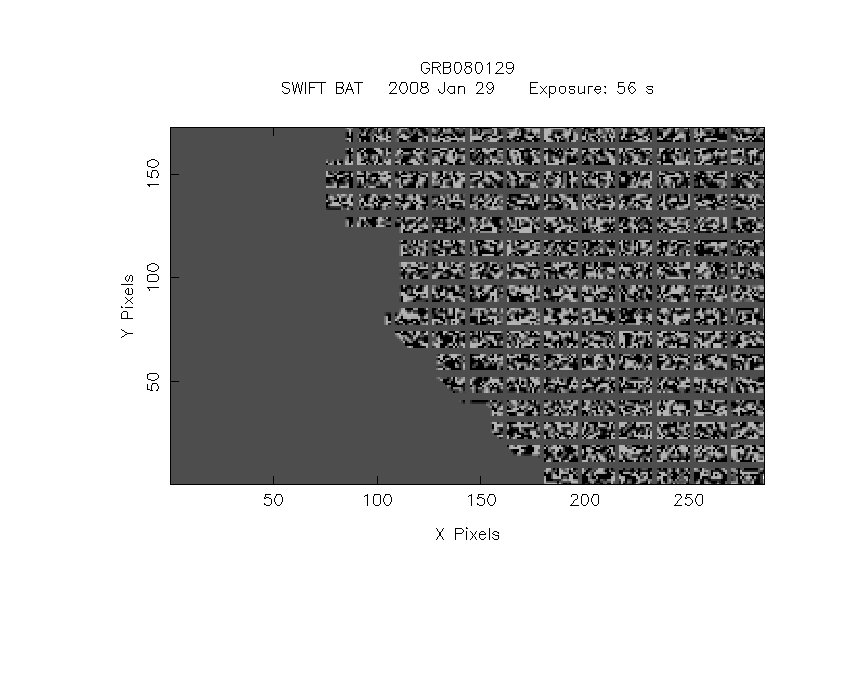
IMX = -8.842114871837599E-01, IMY = -4.946245927239137E-02
TIME vs. PHA plot around the trigger time

Blue+Cyan dotted lines: Time interval of the scaled map
From 0.000000 to 64.000000
TIME vs. DetID plot around the trigger time

Blue+Cyan dotted lines: Time interval of the scaled map
From 0.000000 to 64.000000
100 us light curve (15-350 keV)
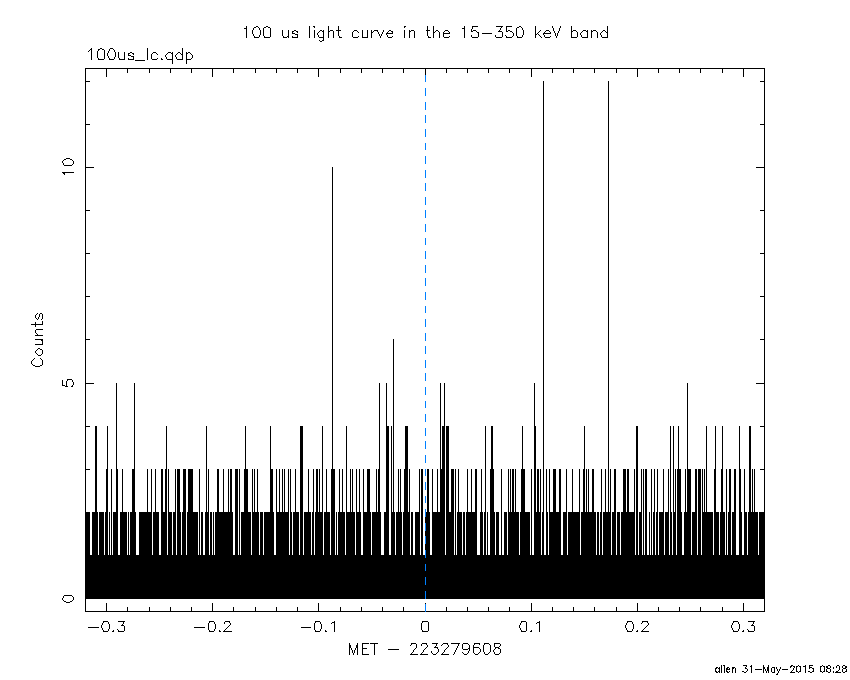
Blue+Cyan dotted lines: Time interval of the scaled map
From 0.000000 to 64.000000
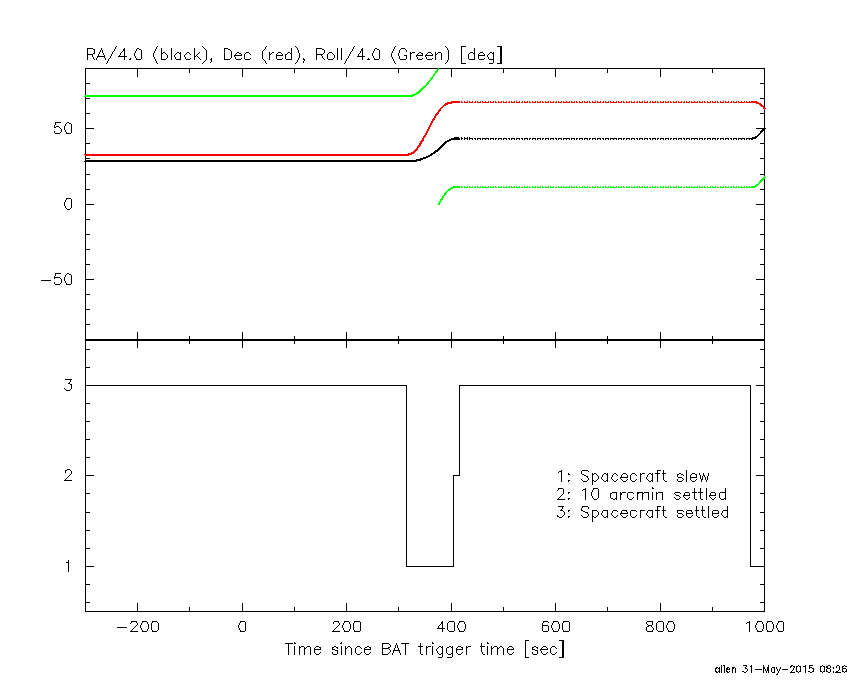
Spacecraft aspect plot
Bright source in the pre-burst/pre-slew/post-slew images
Pre-burst image of 15-350 keV band
Time interval of the image:
-355.699400 -264.950000
-239.000000 -3.456000

# RAcent  DECcent POSerr Theta    Phi  PeakCts   SNR AngSep     Name
#  [deg]    [deg]    ['] [deg]  [deg]                   [']
 83.6300  22.0086    0.3  28.7 -120.5  13.5991  44.6    0.4	Crab
125.7051 -10.9129    2.4  45.3  147.5   2.9097   4.9 ------	UNKNOWN
187.6852  60.9734    3.5  54.0   19.3   4.7035   3.3 ------	UNKNOWN
187.4862  71.6039    2.2  53.9    6.1   4.5239   5.2 ------	UNKNOWN
143.5859  64.7696    2.8  36.7    4.9   1.2708   4.2 ------	UNKNOWN
100.0023 -22.5409    3.3  57.0  179.3   5.1239   3.5 ------	UNKNOWN
102.6388 -12.6533    2.4  46.8  179.1   1.9923   4.8 ------	UNKNOWN
106.5517  21.9371    2.0  12.7 -163.9   1.1947   5.7 ------	UNKNOWN
 99.8636   6.2452    2.7  29.6 -167.0   0.9927   4.2 ------	UNKNOWN
 67.4852  86.5330    2.9  54.8  -19.0   3.0073   4.0 ------	UNKNOWN
 11.4319  83.8638    3.1  58.6  -22.9   5.4207   3.7 ------	UNKNOWN
Pre-slew background subtracted image of 15-350 keV band
Time interval of the image:
-3.456000 52.432000

# RAcent  DECcent POSerr Theta    Phi  PeakCts   SNR AngSep     Name
#  [deg]    [deg]    ['] [deg]  [deg]                   [']
 83.4771  21.9852    4.9  28.9 -120.4   0.2316   2.3    8.9	Crab
180.1025  51.8281    2.5  50.6   31.2   1.6927   4.7 ------	UNKNOWN
132.9909  48.4697    2.9  21.2   21.2   0.3004   4.0 ------	UNKNOWN
105.2879  -7.8488    1.1  41.5  176.8   1.3074  10.6 ------	UNKNOWN
 88.4594  -9.5723    2.4  48.8 -161.9   0.8114   4.9 ------	UNKNOWN
Post-slew image of 15-350 keV band
Time interval of the image:
404.200600 963.120000

# RAcent  DECcent POSerr Theta    Phi  PeakCts   SNR AngSep     Name
#  [deg]    [deg]    ['] [deg]  [deg]                   [']
147.4353  33.2376    3.4  37.7   82.8   3.2002   3.4 ------	UNKNOWN
290.9053  88.5164    2.4  23.1 -131.7   1.3903   4.8 ------	UNKNOWN
268.2673  56.0982    2.5  41.2  -77.6   6.6444   4.7 ------	UNKNOWN
Plot creation:
Sun May 31 08:28:27 EDT 2015